
 ?Mathematical formulae have been encoded as MathML and are displayed in this HTML version using MathJax in order to improve their display. Uncheck the box to turn MathJax off. This feature requires Javascript. Click on a formula to zoom.
ABSTRACT
The Norwegian coastal goat is a national and endangered breed. Coastal goat populations are mainly divided with a large mainland and two small island populations. The objective of this study is to describe genetic diversity in the feral Skorpa island population and its relationship to the mainland coastal goat population (Selje) using the Norwegian milk goat population as a reference. Analyses were based on 96 samples genotyped by the CaprineSNP50 Beadchip from three populations; 7 Skorpa (SK), 37 Selje (SE) and 52 Norwegian milk goats (MG). The SK population had significantly less genetic variation and higher levels of inbreeding than the two other populations. It was more distant from the two mainland populations than they were from each other. The marginal contribution of the SK population to genetic diversity was small. Means of introducing genetic diversity into the SK population should be considered if the population is prioritized for conservation.
Introduction
The Norwegian coastal goat is defined as a national and endangered breed and thus managed to ensure the conservation of the breed to maintain genetic diversity in line with the Convention on Biological Diversity. Historically, the Norwegian coastal goat has been kept in the western part of Norway, along the Atlantic coast, for meat production based on an extensive production system. The coastal goat has thus also been integral in maintaining biodiversity in local biotopes, e.g. the coastal heath landscapes.
The current coastal goat population is divided with the largest population being in the mainland county of Selje, and smaller populations including the populations at the islands Skorpa and Sandsøy. There were 388 registered breeding goats in the national goat register in 2018 (Animalia, Citation2018).
The census population size at Skorpa has been estimated to vary between 60 and 104 individuals in the period 1999–2007 (Folkestad, Citation2007). A counting conducted 9 May 2017 from boat counted 18 females, 20 males and 15 kids. This population has been unmanaged since permanent residence at the island of Skorpa ceased in the period between 1955 and 1970. The Skorpa population is thus to be considered a feral population. The future of the Skorpa population is challenged by the fact that it is unmanaged but is still classified as a livestock species.
To provide knowledge for the future management of the Skorpa population, a characterization of the population was initiated. Part of this was a genetic characterization of genetic diversity and population structure and relatedness to the larger mainland population at Selje.
The objective of this study is to describe genetic diversity in the Skorpa coastal goat population, its relationship to the mainland coastal goat population using the Norwegian milk goat population as a reference.
Data
Analyses were based on samples from three populations. Samples from AI rams of the Norwegian milk goat referred to as the MG population (N=52, MG). Norwegian coastal goat samples from four herds from the county of Selje, aged 1–9 years old (N=37, SE), referred to as the SE population. The SK population was Norwegian coastal goat samples from rams of feral coastal goats from the island of Skorpa (N=7, SK). Samples were either semen samples from AI rams or blood. New DNA samples from the SK population were sampled by darting and sedating five rams 9 May and 9 June 2017, to allow the collection of blood as well as collecting faecal samples and making a body condition score. The five rams sampled were between 4 and 10 years of age. Two additional SK samples were from two live SK males captured for semen production.
All samples were genotyped using the CaprineSNP50 BeadChip (Tosser-Klopp et al., Citation2014) containing 53.347 single nucleotide polymorphisms (SNPs).
Prior to analyses, the genotypes were edited for the following quality criteria, leaving out loci if minor allele frequency <0.02 (leaving out loci with a minor frequency allele count of 0 or 1), >10% missing markers per individual, > 10% missing genotypes per marker and the probability of deviation from the Hardy–Weinberg equilibrium < 0.0001 using Plink v1.9 (Chang et al., Citation2015; Plink v1.9). Due to the low sample sizes, these editing was done across populations. Further, loci on sex chromosomes and loci with unknown map position were excluded. These quality criteria left 45,772 marker loci for further analysis.
Methods
All analyses were based on the edited 45,772 marker loci, unless otherwise specified.
Based on homozygosity averaged across all 45,772 marker loci, inbreeding was computed (Fhom) using Plink 1.9 (Chang et al., Citation2015; Purcell & Chang), aswhere HO and HE are the observed and expected proportion of homozygotes.
An alternative measure of inbreeding was based on the proportion of the genome covered by runs of homozygosity (ROH) (FROH) relative to the length of the autosome covered by SNP computed using the R package detectRUNS (Biscarini et al., Citation2018). ROH was detected using a sliding window size of 15 SNP, a threshold of overlapping windows of the same state (homozygous/heterozygous) to call an SNP in a run was 0.1, minimum number of SNP in a run of 15 and a maximum number of heterozygous SNP in a sliding window of 1, in agreement with parameters used in a previous study on continental and insular goat breeds (Cardoso et al., Citation2018).
Inbreeding was computed for different length classes of ROH, but only inbreeding based on the total proportion of the genome covered by ROH is presented here, as relative results were similar.
Identity by state (IBS) relationships between individuals i and j were calculated aswhere IBS2 and IBS1 are the number of loci where individuals i and j share 2 and 1 allele, respectively, and m is the number of marker loci. Genetic distances were calculated as D = 1 − DST. Average genetic distance within and between populations was computed by averaging pairwise genetic distances.
Admixture assuming K postulated ancestral populations was estimated using a likelihood-based model as implemented in Admixture (Alexander et al., Citation2009). The model estimates the proportion of each individuals genome contributed by K postulated ancestral populations. Values for K ranging from 1 to 6 were fitted and 5-fold cross-validation errors were used to select the value of K with best predictive ability.
IBS between all individuals were computed. Genetic distances between individuals based on a permutation score were plotted. Pairwise FST values between the three populations were calculated. These analyses were based on the R package SNPrelate (Zheng et al., Citation2012).
Historical effective population sizes (Ne) were estimated from linkage disequilibrium, using the methods for unphased genotypes described by Barbato et al. (Citation2015), as implemented in the software SNeP.
Finally, the marginal contribution of the three populations to genetic diversity was computed following Eding et al. (Citation2002). Genetic contributions were optimized to maximize genetic diversity by minimizingwith respect to contributions c with H being the IBS relationships between individuals. The measure of diversity 1 − f(S) quantifies the maximal diversity achievable given the animals and populations. Then one breed was removed from the data and genetic diversity maximized from the two remaining breeds. The loss in maximal diversity was used as a measure of the marginal diversity contributed by the breed left out.
Results
The level of heterozygosity at segregating loci was highest in MG and significantly lower in SK. Estimates of inbreeding were significantly different between the three populations as shown in for both measures of inbreeding. Both measures of inbreeding were much higher in the SK population. The standard deviation of inbreeding in the SE population was larger than in the two other populations, indicating some highly inbred individuals in this population. Estimates of inbreeding based on ROH show that a larger proportion of the genome is covered by ROH in the SK population than in the other populations (). As shown in , FROH was consistently larger across all chromosomes, however more variable in SK, likely due to lower sample size.
Figure 1. Inbreeding per chromosome estimated from the proportion of the chromosome covered by ROH for the 29 autosomes in the three populations (from detectRUNS (Biscarini et al. Citation2018)). MG, Norwegian Milk goat AI rams; Se, Norwegian coastal goat Selje; Sk, Norwegian coastal goat Skorpa.
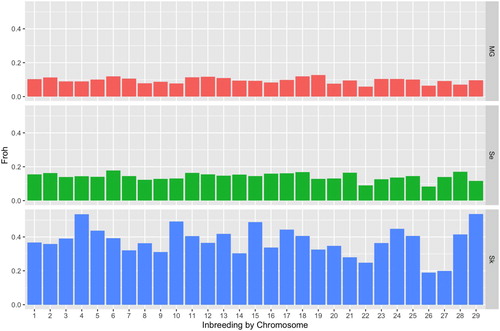
Table 1. Observed (Heto) heterozygosity, average genetic distance within population (D), inbreeding based on excess of homozygotes (FHOM) and inbreeding based on the proportion of the genome covered by runs of homozygosity (FROH). MG, Norwegian Milk goat AI rams; Se, Norwegian coastal goat Selje; Sk, Norwegian coastal goat Skorpa. Mean ± std.
Further, shows that the genetic distance within the SK population was significantly smaller as could be expected in a more inbred population.
Admixture analysis showed the best predictive ability with five postulated ancestral populations, as shown in . For comparison, the five-fold cross-validation error assuming K equal to 1 or 6 was 0.63573 and 0.62032, respectively. There were minor differences in the cross-validation error for 3, 4 or 5 postulated ancestral populations. The SK population had consistently contributions from a separate ancestral population, and this ancestral SK population had a small contribution to SE and MG (<2.5%). SE and MG consistently had contributions from different ancestral populations. For K=5, two ancestral populations contributed more than 90% to MG but only 10% to SE. Likewise, two other ancestral populations contributed 88.2% to SE but only 7.8% to MG. Standard deviations of ancestral contributions to SE and MG were large, reflecting heterogeneity within populations as well as variability in the amount of shared ancestry between SE and MG individuals.
Table 2. Contributions from K postulated ancestral populations, using a likelihood-based model as implemented in Admixture (Alexander et al. Citation2009). Mean (+ SD) contributions from K ancestral populations assuming values of K ranging from 2 to 5 (cv.error = cross-validation error).
The same pattern is seen for genetic distances between individuals as shown in and average distances between populations in . The three populations clearly separate and indicate that the SE population is more closely related to the MG population than the SK population. This is further supported by the pairwise FST values, shown in , with the SK population being distant to the two other populations. Both FST and average pairwise genetic distances D () show a larger distance between the two coastal goat populations than the larger SE coastal goat population and the MG population. Similar to the results in , also shows a heterogeneity within populations. Especially, there are seven MG individuals (to the right in ) that forms a separate cluster.
Figure 2. Clustering based on genetic distance between the 96 individuals from the three populations. MG, Norwegian Milk goat AI rams; Se, Norwegian coastal goat Selje; Sk, Norwegian coastal goat Skorpa.
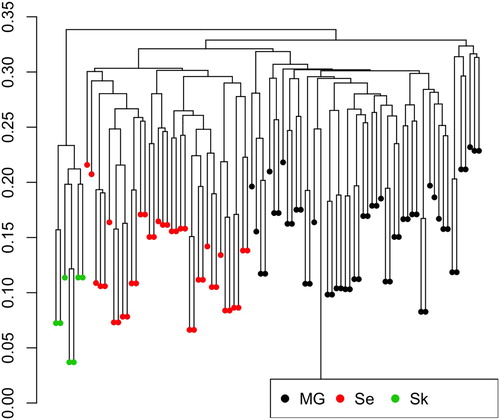
Figure 3. Historical effective population sizes in the island and mainland population of coastal goat estimated from linkage disequilibrium. MG, Norwegian Milk goat AI rams; Se, Norwegian coastal goat Selje; Sk, Norwegian coastal goat Skorpa.
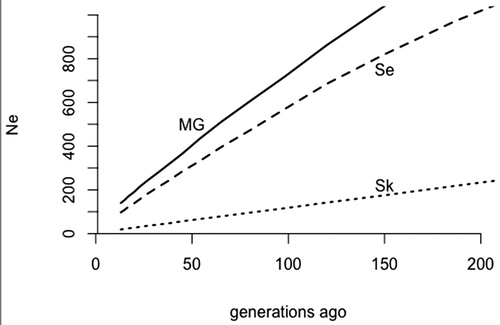
Table 3. Pairwise FST values (below diagonal) and average pairwise genetic distances (above diagonal) between the three populations. Average genetic distances within populations are in . MG, Norwegian Milk goat AI rams; Se, Norwegian coastal goat Selje; Sk, Norwegian coastal goat Skorpa.
Historical effective population sizes are shown in , estimated from linkage disequilibrium. The effective population size has been much lower in the SK population than in SE and is estimated to have been below 50 for the last 40 generations, below 30 for the last 20 generations and most recently below 20. For MG, the historical effective population size has been large and has most recently decreased to 140. The SE population of Norwegian coastal goat has also had a significantly larger effective population size compared to the SK population, with most recent estimates being just below 100 (98). The effective population size as estimated here reflects the effective number of ancestors and thus, the SK population has fewer effective ancestors than the other populations.
As a measure of marginal genetic diversity contributed by the breeds, the diversity lost in an optimized set when excluding one breed at a time was computed. The loss in diversity was 5.64%, 0.67% and 0.01% for MG, SE and SK, respectively.
Discussion
Genetic diversity is significantly lower in the feral island population of coastal goat relative to the mainland coastal goat population and the milk goat population, measured by inbreeding, genetic diversity within breeds and proportion of segregating loci. Recent effective population sizes of the two coastal goat populations are markedly different. The island SK population has estimated effective population sizes significantly smaller than those recommended for maintaining genetic diversity in the short term (50–100, Meuwissen & Woolliams, Citation1994). These estimates indicate a need to increase genetic diversity in the SK population, to ensure adaptive genetic variation in the feral island population of the coastal goat to maintain their potential to adapt to changing environmental conditions. The low number of observed kids per female (15 kids from 18 females) could be caused by inbreeding negatively affecting reproduction.
In a study of nine goat breeds, the levels of inbreeding based on homozygosity and ROH were reported in the range 0.009–0.057 (Brito et al., Citation2017), much lower than reported for the coastal goat populations included here. In a larger study of 117 goat populations, levels of FROH were lower than 10% for most populations (as for MG in this study) and was only above 30% for 10% of populations (as for SK) (Bertolini et al., Citation2018).
Increasing effective population sizes in the past were also estimated by Visser et al. (Citation2016). Their estimates were comparable to those obtained for the MG and SE populations in this study. The large historical effective population sizes likely reflect admixture before and following breed formation.
The clear separation between the island and mainland coastal goat populations can be due to both selection (adaptation) and genetic drift. In a small population, these can be difficult to distinguish (Stephan, Citation2016). The excessive appearance of long ROH throughout the genome of the island population would indicate that small population size and thus genetic drift is a major contributor to differences between populations. On the other side, the observation that the mainland population is closely related to the milk goat population than the island population indicates that selection or migration has contributed to the differences between the populations. There is historical evidence that 15 milk goats were introduced to the island of Skorpa in the 1970s to increase genetic variation (Folkestad, Citation2007). The complete lack of signs of admixture () indicates that the introduced animals have been less fit, and thus a selection against these individuals. Further, there is a large variation in the inbreeding across chromosomes () in the SK population, which could be explained by selection. Contrary to this, very little genetic diversity will be lost if the SK population goes extinct, highlighting that the SK population represents a subset of the variation present in the two other populations. However, this should be interpreted with care, as this result might be sensitive to the small sample sizes.
Particularly within the MG population, there seems to be sub-clusters, as shown in . The most likely explanation is introgression of other milk goat breeds in the MG population.
The cause of the genetic differentiation between populations is important. In case it is due to genetic drift, then genetic diversity could be increased by introducing unrelated animals from the mainland population. In case the differentiation reflects an adaptation (selection), then migration between populations are not likely to be a successful strategy for increasing genetic variation in the island population. The present study cannot firmly distinguish these causes of differentiation.
Samples from the two mainland populations represent the two populations either as being representative of AI rams or being sampled across herds. For the SK population, only seven individuals were available for this study. Two individuals were AI samples from rams born mid-1990s (Folkestad, Citation2007), and the remaining five were blood samples collected in 2017. Results might be sensitive to the low number of samples. However, the general high kinships and low variability in inbreeding do not indicate that results are biased by sampling of related individuals.
The present study is a genetic characterization of the three populations. Additional factors should be considered to conclude on their future priority for conservation and sustainable use. Our results indicate a need for more evidence on the adaptation of the feral SK population. Further, both the island and mainland populations might have other values that should be considered, e.g. their historical–cultural value and their contributions to maintain coastal heath landscapes. In addition, animal health and welfare should also be considered.
Conclusion
The island SK coastal goat population is significantly more inbred than the mainland populations, as evident from both fewer segregating markers and longer ROH. The three populations clearly separate with the SK and mainland goat populations being significantly different. The SK population has an ignorable marginal contribution to genetic diversity, likely because of its origin from the mainland population and its current genetic distance mainly being due to genetic drift.
The genetic diversity in the island population is low and estimates of effective population size indicate that this population has an unsustainable effective size. Means of introducing genetic diversity into the population should be considered if the population is prioritized for conservation.
Acknowledgements
A number of people have enthusiastically facilitated the study by sharing local knowhow and providing practical assistance when collecting DNA samples from the Skorpa goat population. In particular, we want to thank: Alv Ottar Folkestad for sharing his local observations of the Skorpa goats, and being our main local point of contact. Leif Skorpen for being our point of contact representing the land owners of Skorpa and for taking us safely to and around Skorpa by boat. Sigurd Nygard for assisting us when sedating and darting the goats. Erling Meisingset (NIBIO) for darting and sedating the goats. Thanks also to Nina Hovden Sæther, from The Norwegian Genetic Resource Centre, for enthusiastic follow up.
Disclosure statement
No potential conflict of interest was reported by the author(s).
Additional information
Funding
References
- Alexander, D. H., Novembre, J. & Lange, K. (2009). Fast model-based estimation of ancestry in unrelated individuals. Genome Research 19, 1655–1664. doi: 10.1101/gr.094052.109
- Animalia. (2018). Ammegeitkontrollen. Available at https://www.animalia.no/no/Dyr/husdyrkontrollene/ammegeitkontrollen/.
- Barbato, M., Orozco-terWengel, P., Tapio, M. & Bruford, M. W. (2015). SNep: a tool to estimate trends in recent effective population size trajectories using genome-wide SNP data. Frontiers in Genetics 6, 109. doi: 10.3389/fgene.2015.00109
- Bertolini, F., Cardoso, T. F., Marras, G., Nicolazzi, E. L., Rothchild, M. F., Amills, M. & the AdaptMap Consortium (2018). Genome-wide patterns of homozygosity provide clues about the population history and adaptation of goats. Genetics Selection Evolution 50–59. doi: 10.1186/s12711-018-0424-8
- Biscarini, F., Cozzi, P., Gaspa, G. & Marras, G. (2018). detectRUNS: Detect runs of homozygosity and runs of heterozygosity in diploid genomes. R package version 0.9.5. Available at https://CRAN.R-project.org/package=detectRUNS.
- Brito, L. F., Kijas, J. W., Ventura, R. V., Sargolzaei, M., Porto-Neto, L. R., Cánovas, A., Feng, Z., Jafarikia, M. & Schenkel, F. S. (2017). Genetic diversity and signatuires of selection in various goat breeds revealed by genome-wide SNP markers. BMS Genomics 18, 229. doi: 10.1186/s12864-017-3610-0
- Cardoso, T. F., Amills, M., Bertolini, F., et al. (2018). Patterns of homozygosity in insular and continental goat breeds. Genetics, Selection, Evolution 50(56). doi: 10.1186/s12711-018-0425-7
- Chang, C. C., Chow, C. C., Tellier, L. C. A. M., Vattikuti, S., Purcell, S. M. & Lee, J. J. (2015). Second-generation PLINK: rising to the challenge of larger and richer datasets. GigaScience 4(1), s13742–015–0047–8. doi:10.1186/s13742-015-0047-8.
- Eding, H., Croijmanns, R. P. M. A., Groenen, M. A. M. & Meuwissen, T. H. E. (2002). Assessing the contribution of breeds to genetic diversity in conservation schemes. Genetics, Selection, Evolution 34, 613–633. doi:10.1051/gse:2002027 doi: 10.1186/1297-9686-34-5-613
- Folkestad. (2007). Kystgeita – ein husdyrvariant og eit husdyrbruk på kanten av å bli borte (coastal goat – a livestock breed and production system about to go extinct). Report published online. Accessed 25 July 2019, available at http://www.kystgeit.com/30461369.
- Meuwissen, T. H. E. & Woolliams, J. A. (1994). Effective sizes of livestock populations to prevent a decline in fitness. Theoretical and Applied Genetics 89, 1019–1026. doi: 10.1007/BF00224533
- Purcell, S. & Chang, C. PLINK 1.9. Available at www.cog-genomics.org/plink/1.9/.
- Stephan, W. (2016). Signatures of positive selection: from selective sweeps at individual loci to subtle allele frequency changes in polygenic adaptation. Molecular Ecology 25(1), 79–88. doi: 10.1111/mec.13288
- Tosser-Klopp, G., Bardou, P., Bouchez, O., Cabau, C., Crooijmans, R., Dong, Y., et al. (2014). Design and characterization of a 52K SNP chip for goats. PLoS ONE 9(1), e86227. doi: 10.1371/journal.pone.0086227
- Visser, C., Lashmar, S. F., Van Marle-Köster, E., Poli, M. A. & Allain, D. (2016). Genetic diversity and population structure in South African, French and Argentinian Angora goats from genome-wide SNP data. PLoS ONE 11(5), e0154353. doi:10.1371/ journal.pone.0154353 doi: 10.1371/journal.pone.0154353
- Zheng, X., Levine, D., Shen, J., Gogarten, S. M., Laurie, C. & Weir, B. S. (2012). A high-performance computing toolset for relatedness and principal component analysis of SNP data. Bioinformatics 2012, doi: 10.1093/bioinformatics/bts606