
 ?Mathematical formulae have been encoded as MathML and are displayed in this HTML version using MathJax in order to improve their display. Uncheck the box to turn MathJax off. This feature requires Javascript. Click on a formula to zoom.
ABSTRACT
One aim was to compare four classes of ewes for test-day milk yield (TDMY). The classes are the local Menz breed, the Awassi breed, and their main crossbreds (50 and 75%). Another aim was to estimate variance components to facilitate the prediction of breeding values and their accuracy. A total of 1040 TDMY records of 211 ewes were used. A univariate repeatability model with Legendre polynomial coefficients were used to model lactation curves. The 100% Awassi ewes produced significantly (p < 0.05) more milk than the other studied ewe groups within 120 Days in milk (DIM). The Local ewes produced significantly less than the other groups. Estimates of heritability (h2) and repeatability (r) of TDMY were 0.10 ± 0.08 and 0.15 ± 0.03, respectively. The genetic variance indicated for TDMY could give a genetic gain in the dissemination program if recorded for all ewes at the two centres.
Introduction
In Ethiopia, there are around 43 million sheep (CSA, Citation2021). The sheep are mainly kept by smallholder farmers who raise them for meat, wool, and milk (Legesse et al., Citation2008). Sheep production is based on indigenous breeds except for crossbreds, mainly Awassi x Menz/Wollo crossbreds making up less than 1% of the national sheep population (Tibbo, Citation2006; Getachew et al., Citation2016). The current strategy employed in Ethiopia to increase production from sheep is to crossbreed locally adapted breeds with exotic breeds of high genetic merit, particularly Awassi. The exotic breeds are kept at governmental farms, and these have a mandate to distribute crossbred rams for communal use by farmers (Getachew et al., Citation2016). In addition, some farmers specialize in the production of crossbred rams (Gizaw & Getachew, Citation2009). The Awassi sheep breed is known for milk, meat, and wool and has been widely spread to many countries (Epstein, Citation1985; Galal, Citation1985; Tzanidakis et al., Citation2014). In Ethiopia, especially the milking ability and meat production potential of Awassi are in demand by farmers. Ewe milk is not commonly used (Haile et al., Citation2020), however, milk production from sheep is an important trait in rearing of lambs and also for human consumption (Galal, Citation1985; Legesse et al., Citation2008; Mirkena et al., Citation2011; Getachew et al., Citation2016; Mekasha et al., Citation2016). Thus, there is a demand for increased milk production from sheep through genetic selection.
The potential for genetic improvement of important traits of sheep in a selection program depends on the genetic variability, accuracy of the predicted breeding value, intensity of selection, and the generation interval. Prediction of the breeding value relies on the variance components as does the accuracy of the predicted breeding value of individuals (Lynch & Walsh, Citation1998). To maximize accuracy, it has become standard to use animal models to predict individual breeding values utilizing genetic relationships between animals (Kruuk, Citation2004). If repeated observations exist on the same individual for the same trait over time, e.g. for milk yield then repeatability or random regression models can be used in the estimation of variance components and prediction of breeding values (Schaeffer, Citation2016). In either of these models, regressions of the phenotype on orthogonal polynomials for DIM can be modeled, the most common being Legendre polynomials (Mrode, Citation2014). Repeatability and random regression models allow ewe classes/groups to be evaluated based on any number of test-day records during a lactation, and hence all test-day information can be used in genetic evaluations. One aim of the present study was to compare four classes of ewes for their test-day milk yield (TDMY) at the governmental sheep farms, utilizing a repeatability animal model and pedigree relationship between animals. Another aim was to estimate variance components in order to predict breeding values for test-day milk yield and to calculate associated accuracies for the recorded animals and their ancestors, to facilitate the possibility to predict breeding value for test-day milk yield with such data.
Material and methods
Site and animal management
Data were obtained from two government farms: Debre-Berhan Sheep Breeding and Multiplication Center (DB-R) and Amed-Guya Sheep Breeding and Multiplication Center (AG-R), both located in the central highland of the Amhara regional state in Ethiopia (). These governmental sheep farms distribute high-performance rams to farmers. Test-day records of ewes were used in the study. The flock management is semi-intensive. Animals are fed clover, straw, green fodder (during the rainy seasons), and concentrates. Ewes are mated throughout the year using natural service from about 12 months of age with a male-to-female ratio around 1:40–45. Rams are culled after three years of use. No artificial insemination has been used in the two flocks.
Table 1. Characteristics of the two governmental farms located in the central highlands of Ethiopia.
Data
A total of 1040 test-day (TD) yields from 211 ewes that lambed and were milked from 2015 to 2017 were included in the study (). The test-day milk yield (TDMY, kg day−1) data used in this study were from genetic groups of Menz, Awassi x Menz crossbreds (50% and 75% Awassi), and 100% Awassi ewes. Milk production was measured on farm by trained local people and the first author. Milk measurements started from the 7th day after lambing (after the colostral phase). On evenings prior to test days, lambs were separated from their mothers for 12 h. The next morning, one half-udder was hand milked until it felt empty, while the other half udder was suckled by the lamb. The Weigh-Suckle-Weigh (WSW) method plus hand milking was used to measure milk production, recorded according to Benchohra et al. (Citation2013). The weight difference of the lamb before and after suckling was used to estimate the milk suckled by the lamb. Then, TDMY was taken to be the sum of that hand milked and that consumed by the lamb multiplied by two, following the Method E suggested by ICAR (Citation2002). The average number of TDMY per lactation per ewe was 5 (ranging from 3 to 17).
Table 2. Number of ewes with test-day milk yield (TDMY) records and number of records in each genetic group.
The pedigree data included all ewes with recorded milk, and their ancestors, if available, up to 5 generations. Of the observed ewes, 201 had both parents known, and 10 had only one parent. The 211 ewes were from 51 sires and 196 dams. The total number of males and females in the pedigree was 92 and 620, respectively.
Statistical analysis
The analysis was performed in three steps. First, the variance components for TDMY were estimated using ASReml, version 4.1 (Gilmour et al., Citation2015). Then, the estimates of variance components were used in our R programs to estimate contrasts between genetic groups and their confidence intervals. Finally, R was used to calculate breeding values and associated accuracies.
Lactation curve
To model the effect of the lactation curve for each genetic group, regression coefficients for Legendre Polynomials (LP) were calculated according to Schaeffer (Citation2016) by use of R programming (R Core Team, Citation2018). First, days in milk (DIM), with = 7 and
= 127, were transformed to a normalized scale using:
. Then, the coefficients of the LP were obtained for each test-day observation as: ϕ0 = 0.7071, ϕ1 = 1.2247t, ϕ2 = −0.7906 + 2.3717t2, and ϕ3 = −2.8062t + 4.6771t3.
Breed composition and heterosis effect
Breed composition of each ewe as either Menz or Awassi was derived, with the percentage of the Awassi breed of ewe i calculated as:
where pAi is the calculated percentage of the Awassi breed of ewe i; pASi and pADi are, respectively, the percent of the Awassi breed of the sire (S) and dam (D) of ewe i. Calculation of the Menz proportion may be done likewise, or as:
since only two breeds were considered.
Then, retained heterozygosity (Hi) in each crossbred ewe (i) was calculated using the following equation (Dickerson, Citation1973):
where pMSi and pMDi represent the proportions of Menz in the sire and dam of animal i (Bourdon, Citation1999).
Estimation of variance components and genetic parameters
Variance components for additive genetic, permanent environmental
, and residual
effects of TDMY were estimated by restricted maximum likelihood. They were used to obtain the phenotypic variance
, heritability (h2 =
/
), and repeatability
. Likelihood ratio testing (e.g. Wilson et al., Citation2010) was carried out to test for significance of the variance components. The full model contained all three variance components, while the reduced models excluding the additive genetics, or only contained the random error term. The heritability for the average TDMY based on n records was computed with the following formula:
(Bourdon, Citation1999).
Models
After excluding non-significant fixed effects of birth type (single, multiple), farm (DB-R, AG-R), heterozygosity (0, 0.5, and 1, as a regression) and sex of lamb (male, female, others), while keeping parity for biological reasons (even though it was not significant), the data were analyzed with the following model:
where y is the vector of TDMY; b is a vector of fixed regression coefficients for: DIM (7–127) of 3rd order (k = 0, 1, 2, 3) of LP within the 4 genetic groups: Menz (0% Awassi), 50% Awassi, 75% Awassi and 100% Awassi (g = 1, 2, 3, 4); and fixed effects of 3 parities (first, second, later) and 3 seasons of lambing (long rainy, dry, short rainy); X is a design matrix assigning fixed effects to the observations, including information on parity of ewes, season of lambing, and Legendre transformed functions of day of lactation for the observation within genetic group (ϕk(t)); a is a vector of additive genetic effects for all individuals in the pedigree; pe is a vector of ewe permanent environmental effects; Z and W are matrices linking the random additive genetic (a) and random permanent environmental ewe (pe) effects to the observations y; and e is the vector of random residual effects associated with y.
Reduced models that excluded a and pe were also run.
Random effects were assumed normally distributed with zero means and the following covariance structures:
and so
Above, A is the additive relationship matrix between the individuals included in the pedigree,
represents an identity matrix of dimension equal to the number of observed ewes, and
is an identity matrix of dimension equal to number of observations.
R programs were used to calculate Least-Squares Means (LSM) and to plot lactation curves for TDMY using the estimated variance components from the full model. The values were estimated with:
= (X’ V−1 X)−1 X’ V−1 y, where
is a 20*1 vector including 4*4 = 16
, to establish the form of the lactation curves within the 4 genotypes, in addition to 2 estimated fixed effects of parity and 2 for season of lambing (the third levels of parity and season were omitted to get consistent estimates). Variance of this estimator is: var (
) = (X’ V−1 X)−1, and it was estimated by replacing the true variance components in V with their estimates.
Calculation of estimated averages of TDMY for genetic groups
For genetic group = 1, 2, 3, and 4, LSM yields over lactation days DIM = 1, 2, … , 120 (the interval with positive
values for all groups), making up the lactation curve, were computed with:
=
, where
is a 120*20 matrix with ϕ0, ϕ1, ϕ2 and ϕ3 for each of the 120 days in the genetic group
’s positions of the matrix X, and 0 for the other groups, and averaging the main effects of parity and season of lambing. This means that the
is a vector with 120 estimated TDMY LSM values for group
The LSM average daily milk yield for a ewe in genetic group g over the 120 first days of lactation was calculated as follows:
where k is a vector with 120 equal elements:
.
Testing differences between genetic groups of ewes
LSM differences between genetic groups ( = 1 vs. 2, for example) of ewes over the first 120 days of lactation were found as:
The corresponding variance of the difference between the average daily milk yield for genetic groups 1 and 2 in the first 120 days was calculated as:
A similar procedure was followed for the other groups and time periods. Above, is the standard error of the estimated difference. A 95% confidence interval for the difference was calculated using a t-distribution with the number of ewes as degrees of freedom:
Similar confidence intervals were calculated for all the estimated differences, replacing
with the relevant standard errors in each case. LSM differences between genetic groups were taken as non-significant at a 5% level if their confidence interval included 0.
Estimated breeding value
The estimated breeding value (EBV) over the 120 days were for each animal calculated as the sum of the average daily milk yield for a ewe in genetic group of the relevant animal and the corresponding predicted individual additive genetic effects of animal i (
) as:
Determination of accuracy of estimated breeding value
Accuracy of the estimated breeding value was calculated considering only the random part of the EBV, i.e. . This is in accordance with Henderson (Citation1984) and known as the correlation between the predicted
and true (
) additive breeding value for an individual i:
where C22ii is the diagonal element for individual i from the inverse left-hand side of the Mixed Model Equation, and Gii is the diagonal element in G for individual i.
Results
The likelihood-test statistics from inclusion of the permanent environmental effect over that of the environmental was 20.36, which is χ2 distributed with 1 degree of freedom (p < 0.00001). The estimates of variance components and genetic parameters from a model with the permanent environmental, and from one that additionally models the additive genetic effect (a) are given in . In both models, the repeatability was of similar size (∼ 0.15). However, in the full model, the standard error of the permanent environmental variance estimate increased considerably and for the additive genetic variance the standard error in this model was large (relative to the estimate). The additive genetic variance estimate of 0.016 kg2 had a standard error of 0.013. For the full model heritability for TDMY was estimated as 0.10, with a standard error of 0.08. The heritability estimates for single observations translated into an estimate of 0.31 for an average TDMY based on the mean of 5 observations per ewe.
Table 3. Estimated variance components and genetic parameters (± SE), for test-day milk yield (kg day−1) obtained with statistical models with or without additive genetic effect a.
TDMY LSM for the genetic groups for 120 DIM were 0.81, 1.02, 1.06, and 1.69 kg day−1 for 0% Awassi, 50% Awassi, 75% Awassi, and 100% Awassi ewes, respectively (). The 100% Awassi ewes produced better (p < 0.05) than the other groups of ewes, whereas the Menz (0% Awassi) ewes produced significantly less than the others. The LSM values for 50% and 75% Awassi ewes were quite similar and not significantly different. The contrasts between the genetic groups can also be visualized through the fitted lactation curves, given in . The lactation curve for the 0% Awassi lay consistently below the others, while the curves for 50% and 75% Awassi overlapped. Relative to the others, the 100% Awassi group started out with especially high values in early lactation and lay consistently over the others throughout the 120 DIM.
Figure 1. Observed test-day milk yields (TDMY, kgday−1) and fitted lactation curves for each genetic group.
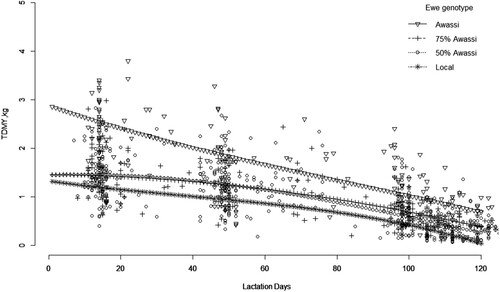
Table 4. Least-squares means (LSM) of average test-day milk yield (kg day−1) over 120 days in milk in each genetic group of ewes and estimated contrasts between groups. All estimates are given with standard error (SE).
Ranges of estimated breeding values for ewes with TDMY records and their sires are given in . The table values show that the EBV’s were mainly determined by but with individual variation due to the
i term. In ewes the largest individual range was for 100% Awassi, followed by the two crossbred Awassi groups, and least range was calculated for Menz. The larger ranges for the Awassi groups reflect also the accuracy of the estimated breeding value
of ewes, being on average largest in the 100% Awassi group, and least in Menz (). The largest individual accuracy was, however, found among the sires, due to sires being progeny tested with up to 43 offspring in the data.
Table 5. Number of individuals in each genetic group and corresponding minimum and maximum estimates of breeding values (EBV, kgday−1) for test-day milk yield (sum of average genetic group effect for an individual over 120 days in milk and individual animal genetic effect).
Table 6. Mean, minimum and maximum accuracy of estimated breeding values for test-day milk yield in each genetic group of ewes and sires of ewes.
Discussion
In the two farms studied, the average TDMY over 120 DIM was higher for Menz (0.81 kg day−1) than the corresponding result earlier obtained in the farmers’ environment by Haile et al. (Citation2020) (0.56 kg day−1). This indicates a more intensive environment at the two governmental farms than in the field. The 100% Awassi produced 1.69 kg day−1, more than double of that of the Menz and significantly more than the other groups. Not only did the two crossbred ewe groups produce between the Menz and the purebred Awassi, as also was obtained for the two intermediate Awassi groups by Haile et al. (Citation2020), but the 100% Awassi now stood out with increased production in the improved environment. This resulted in a significant higher production compared to the other groups, despite only 21 ewes being purebred. Moreover, the larger number of ewes in the intermediate Awassi groups (125 and 37) relative to that of Haile et al. (Citation2020) (both 19) together with the increased number of ewes (211 vs. 115) and records (1040 vs. 466), approximately halved the standard error of LSM contrasts and improved the power of detecting significant differences between the genetic groups in the present paper.
Inclusion of the LP as fixed effects in the genetic evaluation model allowed to estimate the trajectory of the lactation curves (). For all genetic groups, these curves were continuously decreasing from the start of lactation, in agreement with the result of Haile et al. (Citation2020). Moreover, the trajectory of the curves indicated shorter length of lactation ( close to 0 for Menz at 120 DIM) for Menz than for the three Awassi groups. In consequence, the comparison of genetic groups done here on the average yields for 120 DIM favored the Menz ewes. Thus, the yield advantage of the three Awassi groups would have been even larger if comparison had included more than 120 DIM, which is considered as standard lactation length for many sheep breeds (Berger et al., Citation2010; Tzanidakis et al., Citation2014).
The three variance components for additive genetic, permanent environment and error for TDMY summarize the variance along the curve into only one parameter for each, the same for all genetic groups and individual ewes ( and
, respectively). From these variance components, the repeatability and heritability of TDMY were estimated to be 0.15 ± 0.03 and 0.10 ± 0.08, respectively. The repeatability denotes the upper limit of the heritability (Falconer & Mackay, Citation1996) and was estimated with a small standard error (irrespective of model), while the standard error for the heritability was close to as large as the estimate. When both genetic additive and permanent environment were included in the model, the permanent environmental effect was estimated with a much larger standard error than when a model not including the additive genetic was run. This indicates that there exists limited information in the data to separate these two effects. This could be due to the limited quality of the pedigree relationships, i.e. both depth and relationships between the sampled animals, and due to the limited size of the data set. Our estimates were considerably smaller than comparable estimates of repeatability and heritability, e.g. the 0.39 and 0.28 obtained by Bauer et al. (Citation2012) and the corresponding estimates of 0.40 and 0.15 reported by Othmane et al. (Citation2002). Bauer et al. (Citation2012) found the flock-test day effect to be the most important systematic environmental factor in their data, whereas we in the present data considered to have too few observations per test day for this effect to be included in the model. If accounted for, it could have reduced the error variance and increased both our repeatability and heritability estimates.
Breeding values and their accuracies were calculated assuming the estimated variance components were the true values. For the ewes in the 100% Awassi group, the estimated breeding values had the largest range and mean accuracy, which is beneficial because this group is the one to be multiplied, contributing the most, also through the 50 and 75% Awassi ewes. The ram lambs in the two latter groups are the product for distribution from the station to farmers. Currently rams are selected for the field by mass selection based on own weight. These rams could also be selected based on breeding values for milk yield. This would require recording milk yield on ewes in the centers and to include the young ram selection candidates in an expanded relationship matrix A. With such a breeding scheme the accuracy of selection from only including the average 5 records of the animals’ own mother would become 0.27 , using selection index theory, see e.g. Bourdon (Citation1999), and become marginally higher by including information on more distant relatives, e.g. that from aunts. However, accuracy could increase if actions could be taken to increase the size of the genetic parameters. For example, assuming the heritability (h2) and repeatability (r) values of Bauer et al. (Citation2012) for the same 5 records would result in an accuracy of 0.37. Including additional information through genotyping would have the potential to further increase the accuracy. Selection within the purebred groups in the centers (with more than 3000 sheep in each of the two), both 100% Awassi and Menz, could also be based on the same TDMY information. However, consideration needs to be taken for rate of inbreeding since both groups can be considered closed.
Recipients of the 50% and 75% Awassi rams distributed to farmers locally organized as cooperative breeding groups (as given in Gizaw & Getachew, Citation2009) through the Community-Based sheep Breeding Program (CBBP) in the central highland of Ethiopia. These groups consist of 6–12 (sometimes more) farmers, and the rams are rotated across farmers and groups. Each third year, the ram is replaced with another ram from one of the governmental farms. Recently, Haile et al. (Citation2020) have shown 30–50% Awassi ewes to produce best in the local villages. Thus, there is a need to disseminate rams from the governmental farms with a variable blood level (25–75%). An alternative would be to produce 25–50% Awassi rams locally, a development that anyhow seems to be practiced. Locally, in the villages, the ram lambs could, in the future, be selected on estimated breeding values given that herd recording became established and one was able to keep track of the genetic relationships between animals (could well be determined by the use of genetic markers in future). This would be pivotal in developing a breeding scheme relying on utilizing data from the field. By carrying out breeding value estimation, for example with variants of the model presented in this paper, a synthetic population could be established, converging toward the Awassi percentage favorable in the field. In the future, traits to be recorded should not be restricted to TDMY but also include growth, milk quality, survival, and wool traits. Such a development would be one in which the vision is that Ethiopia can utilize its own genetic resources and improve them through genetic selection over time. This would build infrastructure and contribute to increased knowledge that is essential for an efficient national sheep production.
Conclusion
The genetic advantage of an increased Awassi percentage for milk yield was larger at the two multiplication centers than under field conditions, i.e. for an improved environment. Moreover, the advantage of Awassi would increase if the comparison had been done over more than 120 DIM. An exploitable amount of genetic variance was indicated for TDMY. If information were recorded for all ewes at the two centers, preferably with higher heritability values than in the current study, there is potential for the dissemination program to considerably increase selection accuracy and genetic gain also for TDMY.
Acknowledgements
The authors are grateful to the cooperation received from the DB-R and AG-R staff members while collecting data for this study.
Disclosure statement
No potential conflict of interest was reported by the author(s).
Additional information
Funding
References
- Bauer, J., Milerski, M., Přibyl, J. & Vostry, L. (2012). Estimation of genetic parameters and evaluation of test-day milk production in sheep. Czech Journal of Animal Science, 57(11), 522–528.
- Benchohra, M., Amara, K., Hemida, H., Kalbaza, A. Y. & Aggad, H. (2013). Assessing dairy potential and lamb growth performance in Algerian Rembi sheep. Livestock Research for Rural Development, 25, Article #218. http://www.lrrd.org/lrrd25/12/benc25218.html.
- Berger, Y. M., Mikolayunas, C. & Thomas, D. L. (2010). Guide to Raising Dairy Sheep. University of Wisconsin-Extension, Cooperative Extension.
- Bourdon, R. M. (1999). Understanding Animal Breeding (2nd ed.) (Upper River, NJ: Pearson Education).
- CSA. (2021). Agricultural sample survey 2017/18. Report on Livestock and Livestock Characteristics (Private Peasant Holdings), Statistical Bulletin 587, Volume II. Addis-Ababa: Central Statistical Authority (CSA).
- Dickerson, G. E. (1973). Inbreeding and heterosis in animals. Journal of Animal Science, 1973, 54–77.
- Epstein, H. (1985). The Awassi sheep with special reference to the improved dairy type. Animal Production and Health, Paper No. 57. Rome: FAO.
- Falconer, D. S. & Mackay, T. F. C. (1996). Introduction to Quantitative Genetics (4th ed.) (Harlow: Longmans Green).
- Galal, E. S. E. (1985). Selection for increased production in multi-purpose sheep and goats. In Small ruminant production in the developing countries. FAO Animal Production and Health Paper No. 58, Proceedings of an expert consultation held in Sofia, Bulgaria, pp. 8–12.
- Getachew, T. (2015). Genetic diversity and admixture analysis of Ethiopian fat tailed and Awassi sheep using SNP markers for designing crossbreeding schemes. PhD thesis, University of Natural Resources and Life Sciences, Vienna, Austria.
- Getachew, T., Aynalem, H., Wurzinger, M., Rischkowsky, B., Gizaw, S., Abebe, A. & Sölkner, J. (2016). Review of sheep crossbreeding based on exotic sires and among indigenous breeds in the tropics: An Ethiopian perspective. African Journal of Agricultural Research, 11(11), 901–911.
- Gilmour, A. R., Gogel, B. J., Cullis, B. R., Welham, S. J. & Thompson, R. (2015). ASReml user guide release 4.1. VSN International Ltd, UK, available at: http://www.vsni.co.uk/.
- Gizaw, S. & Getachew, T. (2009). Awassi-Menz sheep crossbreeding project in Ethiopia: Achievements and lessons learnt. Proceedings of ESGPIP sheep and goat project review conference, Hawassa, Ethiopia. pp. 53–62.
- Haile, W. G., Banerjee, S., Ayele, A., Mestawet, T., Klemetsdal, G. & Ådnøy, T. (2020). Finding best exotic breed proportion in crossbred lactating sheep kept under farmers’ conditions in Ethiopia determined by use of nested Legendre polynomials with limited data. Acta Agriculturae Scandinavica, Section A—Animal Science, 68(4), 174–180. doi:10.1080/09064702.2020.1717591
- Henderson, C. R. (1984). Application of Linear Models in Animal Breeding (Guelph: University of Guelph), pp, 462.
- ICAR. (2002). International agreement of recording practices. Approved by the general assembly held in Interlaken, Switzerland on 30 May 2002.
- Kruuk, L. E. B. (2004). Estimating genetic parameters in natural populations using the ‘animal model’. Philosophical Transactions of the Royal Society of London. Series B: Biological Sciences, 359(1446), 873–890. doi:10.1098/rstb.2003.1437
- Legesse, G., Abebe, G., Siegmund-schultze, M. & valle Zarate, A. (2008). Small ruminant production in two mixed-farming systems of southern Ethiopia: Status and prospects for improvement. Experimental Agriculture, 44(3), 399–412.
- Lynch, M. & Walsh, B. (1998). Genetics and Analysis of Quantitative Traits (Sunderland, MA: Sinauer Associates Inc).
- Mekasha, Y., Shewage, T., Hoekstra, D. & Tegegne, A. (2016). Sidama study shows economic benefits of sheep milk in Ethiopia. The Livestock and Irrigation Value Chains for Ethiopian Smallholders (LIVES) project.
- Mirkena, T., Gemeda, D., William, A., Wurzinger, M., Aynalem, H., Rischkowsky, B., Okeyo, A. M., Markos, T. & Solkner, J. (2011). Community-based alternative breeding plans for indigenous sheep breeds in four agro-ecological zones of Ethiopia. Journal of Animal Breeding and Genetics, 129(3), 244–253.
- Mrode, R. A. (2014). Linear Models for the Prediction of Animal Breeding Values (3rd ed.). Boston, MA: CABI.
- Othmane, M. H., De La Fuente, L. F., Carriedo, J. A. & San Primitivo, F. (2002). Heritability and genetic correlations of test day milk yield and composition, individual laboratory cheese yield, and somatic cell count for dairy ewes. Journal of Dairy Science, 85, 2692–2698.
- R Core Team. (2018). R: A Language and Environment for Statistical Computing (Vienna: R Foundation for Statistical Computing). https://www.R-project.org/.
- Schaeffer, L. R. (2016). Random regression models. pp. 117. Accessed 20 December 2018, available at: http://www.aps.uoguelph.ca/~lrs/BOOKS/rrmbook.pdf.
- Tibbo, M. (2006). Productivity and health of indigenous sheep breeds and crossbreds in central Ethiopian Highlands. PhD dissertation, Uppsala: Swedish University of Agricultural Sciences.
- Tzanidakis, N., Stefanakis, A. & Sotiraki, S. (2014). Dairy sheep breeding. Technical Note. Low Input Breeds. http://www.lowinputbreeds.org/publications/lib-technical-notes.html#c10401.
- Wilson, A. J., Réale, D., Clements, M. N., Morrissey, M. M., Postma, E., Walling, C. A., Kruuk, L. E. B. & Nussey, D. H. (2010). An ecologist’s guide to the animal model. Journal of Animal Ecology, 79, 13–26.