
ABSTRACT
Sialic acids (Sias) are an outermost-situated sugar of glycoproteins and glycolipids to play important roles in various biological phenomena. They are often modified by additional substituents, such as O-acetyl group, to display more than 50 different structures in nature. Of those modified Sia, nothing is known about the occurrence and biological functions of sulfated Sias (SiaSs) in mammals. To elucidate the significance of sialic acid sulfation, we investigated various mammalian-cultured cell lines for the expression of SiaS using the specific antibody 3G9. First, SiaS is expressed in a cell line-dependent and a cell density-dependent manner. Second, in CHO cells, the expression of SiaS is reversibly induced by treatment with the antibiotic G418. Taken together, the expression of SiaS is changed by intrinsic and extrinsic factors in mammalian cells. This is the first demonstration of regulated expression of SiaS.
GRAPHICAL ABSTRACT
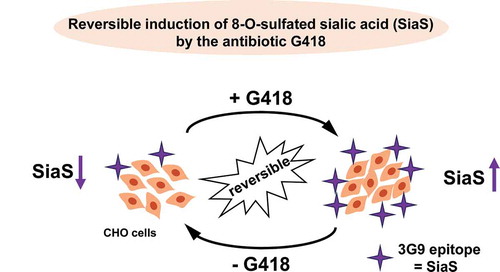
Reversible induction of the surface sulfation of sialic acid residues by the antibiotic G418 in mammalian cells.
Sialic acids (Sias) modify glycan chains of glycoproteins and glycolipids of cell surface and extracellular fluid and play crucial roles in cellular recognition and signaling [Citation1–Citation3]. One of the unique features of Sias that other monosaccharides of the glycan chains do not have is the structural diversity. Namely, Sias consist of N-acetylneuraminic acid (Neu5Ac), N-glycolylneuraminic acid (Neu5Gc), deaminoneuraminic acid (Kdn), and their modified forms by O-acetylation, O-sulfation, O-methylation, O-lactylation, lactonization, and so on [Citation1–Citation3]. However, very little is known about biological significance of these modified Sia residues, although the natural occurrence of O-acetylated Sias is more frequently documented than other modified Sias [Citation3,Citation4]. As for O-sulfated Sia (SiaS) structures, 8-O-sulfation of Neu5Ac and Neu5Gc () are known in sea urchin gametes [Citation5–Citation13]. We previously showed that the SiaS residues were involved in sperm–egg interaction [Citation14] as well as in the regulation of sperm motility [Citation10,Citation11] in sea urchin. In contrast, nothing is known about the occurrence of SiaS in vertebrates, except for bovine gastric gangliosides [Citation15,Citation16]. Thus, our final goal is to comprehensively understand not only the occurrence but also the biosynthesis and functions of SiaS in vertebrates. In this study, as the first step, we sought to identify the presence of SiaS in mammals using various cultured cell lines. In addition, we also examine if the expression of SiaS on mammalian-cultured cells is dynamically changed depending on the cultural conditions.
Figure 1. Structure of 8-O-sulfated sialic acids in the α-configuration. (a) 8-O-sulfated Neu5Ac. (b) 8-O-sulfated Neu5Gc. R, aglycon.

Materials and methods
Materials
The aminoglycoside antibiotic G418 was obtained from FUJIFILM Wako Pure Chemical Corp. (Osaka, Japan). The pcDNA3.1(neo) plasmid encoding the neomycin-resistance gene (the amino 3ʹ-glycosyl phosphotransferase gene) was purchased from Thermo Fisher Scientific (Waltham, MA USA). Bovine serum albumin and trifluoroacetic acid (TFA) were purchased from Nacalai Tesque (Kyoto, Japan). 1,2-diamino-4,5-metylenedioxy-benzene (DMB) was purchased from Dojindo Molecular Technologies, Inc. (Kumamoto, Japan). The 4-methylumbelliferyl α-glycoside of 8-O-sulfated N-acetylneuraminic acid (4MU-Neu5Ac8S) was prepared as previously described [Citation13]. The monoclonal IgM antibody 3G9 (mAb.3G9), which specifically recognizes the α-glycosides of Neu5Ac8S, was previously prepared using sea urchin sperm as an immunogen [Citation17]. mAb.2G9 (10 μg/mL) was obtained as an IgM clone, which did not react with Neu5Ac8S-containing gangliosides, during the preparation of 3G9 and used for the isotype control.
Cell culture
Cultured cell lines used were Chinese hamster ovary CHO, mouse neuroblastoma Neuro2A, mouse macrophage RAW, and human cervical carcinoma HeLa cells, those of which were purchased from Riken Cell Bank (Japan). CHO cells were cultured in MEM-α (Wako, Japan) supplemented with 100 units/mL penicillin G and 100 μg/mL streptomycin sulfate, and 10% fetal bovine serum (FBS) in a 5% CO2 and 95% air humidified atmosphere at 37°C. The other cells were cultured under the same conditions except that Dulbecco’s Modified Eagle’s Medium (DMEM) was used instead of MEM-α.
Treatment with the antibiotic G418
CHO cells (1.5 × 10⁶ cells/dish) were cultured in a 10 cm-dish until 70% confluent state, and further cultured in fresh medium containing 1.5 mg/mL G418 for 10 days before analyses. During the culture, almost every three days, when the cells reach the 90% confluency, they were split into fresh media with or without G418 at 1.5 × 10⁶ cells/10-cm dish to keep the cultural conditions constant. For the preparation of the stable-transfected cells, CHO cells (1.5 × 10⁵ cells/dish) were cultured in a 10 cm-dish overnight and transfected with 3 μg of pcDNA3.1(neo) plasmid encoding the neomycin-resistance gene (neo) using the PEI-Max Transfection Reagent (Polysciences Inc., USA). At 48 h post-transfection, the cells were cultured in the presence of G418 at 1 or 1.5 mg/mL for 15 days to establish the stably pcDNA3.1(neo)-transfected CHO cells. The pcDNA3.1(neo)-transfected CHO cells were also cultured in the presence and absence of G418 for appropriate periods before analyses. The cells were collected and subjected to the flow cytometric analysis with 3G9 and the fluorometric HPLC analysis.
Cell density experiments
CHO cells and the stably pcDNA3.1(neo)-transfected CHO cells were inoculated into a 10 cm-dish at cell numbers of 1.0, 1.5, and 2.0 × 10⁶ cells, and cultured for 2 days. The cells were collected and the cell number was counted. The surface expression of 3G9 epitope was analyzed by flow cytometry.
Flow cytometry
Cells were collected with a cell scraper, washed twice with PBS, and blocked with 5 mM EDTA, 0.5% BSA (PBE) at 4°C for 30 min. They were incubated with mAb.3G9 (10 µg/mL) at 4°C for 1 h and washed with PBS. mAb.2G9 (10 μg/mL) was used for the isotype control. The cells were incubated with Alexa488-labeled anti-mouse IgG+M (2 µg/mL; Thermo Fisher Scientific) at 4°C for 30 min. After washing them twice with PBS, the cell surface fluorescence was analyzed using a flow cytometer (Gallios, Beckman Coulter, Brea, USA) and the collected data were analyzed with the Kaluza software (Beckman Coulter). The mean fluorescence intensity (MFI) values and the proportion of the 3G9 epitope were analyzed.
Fluorometric high-performance liquid chromatography (HPLC) analysis
Cells were homogenized with PBS containing 1% Triton X-100, 1 μg/mL each of aprotinin, leupeptin, and pepstatin and 2 μg/mL of antipain, and 5 mM EDTA, and incubated on ice for 1 h. Homogenates were centrifuged at 15,000 × g at 4°C for 15 min and the supernatants were quantitated for the protein amount by the bicinchoninic acid assay. The cell homogenates (40 µg protein) were subjected to mild-acid hydrolysis with 0.1 N TFA at 80°C for 2 h, and the hydrolyzates were dried on the SpeedVac vacuum concentrators (Savant, Thermo Fisher Scientific). To the hydrolyzates were added 20 µL of 0.01 TFA and 20 µL of DMB solution [Citation18], and incubated at 50°C for 2 h. The DMB-derivatized samples were directly applied on an ODS column (250 × 4.6 mm i.d., Capcellpak C18 type MG, Shiseido, Japan) and eluted with acetonitrile/methanol/0.05% TFA (4:6:90, v/v/v) at 1.0 mL/min for 120 min on a JASCO HPLC system (excitation, 373 nm; emission, 448 nm) as previously described [Citation13]. 4MU-Neu5Ac8S was used as a positive control for these procedures.
Results
Expression of the 3G9 epitope in mammalian cell lines
We previously developed the monoclonal IgM antibody 3G9 specifically recognizing 8-O-sulfated N-acetylneuraminic acid (Neu5Ac8S) residues. To examine the expression level of Neu5Ac8S on the cell surface of CHO, HeLa, Neuro2A, and RAW cells that were cultured for 2 days in each 10-cm dish that was initially inoculated at 1.5 × 10⁶ cells/dish, these cells were subjected to flow cytometric analysis using 3G9 (). Control profiles were obtained using control IgM (). In CHO and Neuro2A cells, both 3G9-positive and negative populations were observed, and the proportions of 3G9-positive population were 30% and 19%, respectively. In HeLa cells, a single 3G9-positive population was observed, although no intense staining was detected, thus suggesting that the 3G9 epitope is expressed in HeLa cells albeit weakly. In RAW cells, no expression of 3G9 epitope was detected. These results indicate that the 3G9 epitope is expressed in a cell line-specific manner.
Figure 2. Flow cytometric analysis of the expression of 3G9 epitope in mammalian cell lines. CHO, HeLa, Neuro2A and RAW cell lines were immunostained with 3G9 (black) or control IgM (gray), followed by flow cytometry. The left four panels show one of representative data from triplicated experiments. The right panel shows the mean fluorescence intensity (MFI) of the 3G9 epitope profiles. The experiments were carried out in triplicate, and the error bars indicate the standard deviations.

In CHO cells, the 3G9-positive population gave a discrete peak in flow cytometry. When several single colonies were isolated and cultured as monoclonal cell lines, any of the 3G9-positive cell lines showed high 3G9-positive property at the early stage of subcloning; however, most of them turned to the 3G9-negative population after a week of culture after cloning (data not shown). Therefore, it is concluded that 3G9-positive population is formed by environmental factors, but not by the selective expansion.
Effects of the antibiotic G418 on the 3G9 epitope expression
In the course of experiments to search for protein factors that change the cell surface level of 3G9 epitope by the transfection method, we observed an unexpected observation as follows. CHO cells were transfected with an empty plasmid of pcDNA3.1(neo), and cultured in the presence of 1.0 and 1.5 mg/mL G418 for 15 days. The flow cytometric analysis showed that the proportion of 3G9-positive cells increased from 30% () to 46% and 63% in the presence of 1.0 and 1.5 mg/mL G418, respectively, while no change was observed when the control IgM was used ()). Interestingly, the more the G418 dose increased, the more the 3G9-positive population increased. Then, the 1.5 mg/mL G418-treated pcDNA3.1-transfected cells were cultured in the absence of G418 for 10 more days. This treatment resulted in decrease of the proportion of 3G9-positive population from 63% to 30% ()). Furthermore, when these cells were again treated with 1.5 mg/mL G418 for 1 month, the proportion of 3G9-positive population was found to return back to 60% ()). These results suggest that the 3G9-epitope on the pcDNA3.1(neo)-transfected cells is reversibly induced by the presence and absence of the G418 treatment.
Figure 3. G418-induced expression of 3G9 epitope in CHO cells. (a) The stably pcDNA3.1(neo)-transfected CHO cells were treated with 1.0 and 1.5 mg/mL G418 for 15 days, and analyzed by flow cytometry after immunostained with 3G9 (upper panel) or control IgM (lower panel). The % value in each panel stands for the proportion of the 3G9-positive cell population. (b) The 1.5 mg/mL G418-treated stable-transfected cells (shown in a) were further cultured without G418 for 10 days, and analyzed for the 3G9 epitope by flow cytometry. (c) The stable-transfected CHO cells cultured without G418 (shown in b) were again cultured with 1.5 mg/mL G418 for 1 month, and analyzed for the 3G9 epitope by flow cytometry. In the right panels, the mean fluorescence intensity (MFI) of the 3G9 epitope profiles (upper) and the proportion of the 3G9-positive cell population (lower) are shown. All the experiments were triplicated, and the error bars indicate the standard deviations. *p < 0.05 (Student t-test, n = 3). (d) Parental CHO cells were treated with 1.5 mg/mL G418 for 10 days, and analyzed by flow cytometry after immunostained with 3G9 (upper panel) or control IgM (lower panel). The % value in each panel stands for the proportion of the 3G9-positive cell population. (e) The 1.5 mg/mL G418-treated cells (shown in d) were further cultured without G418 for 10 days, and analyzed for the 3G9 epitope by flow cytometry. In the right panels, the mean fluorescence intensity (MFI) of the 3G9 epitope profiles (upper) and the proportion of the 3G9-positive cell population (lower) are shown. (f) The CHO cells cultured without G418 (shown in e) were again cultured with 1.5 mg/mL G418 for 1 month, and analyzed for the 3G9 epitope by flow cytometry. All the experiments were triplicated, and the error bars indicate the standard deviations. *p < 0.05, **p < 0.001 (Student t-test, n = 3).

Then, we asked if the reversible induction of 3G9 epitope in the CHO cells was dependent on the pcDNA3.1(neo)-transfection or not. To answer the question, the same experiments were carried out using parental CHO cells without transfection procedures (). First, parental CHO cells were cultured in the presence of G418 at 0.2, 0.5, 0.75, 1.0, 1.5, and 2.0 mg/mL for 5 days, and found to be in good condition at less than 1.0 mg/mL G418. However, at 1.0 and 1.5 mg/mL G418, 10% and 25% of the cells were dead, respectively. At 2.0 mg/mL, the cells are mostly dead. Interestingly, we found that continuing culture of the cells at 1.5 mg/mL G418 for 10 more days allowed them to be alive and resistant to the G418-treatment. Flow cytometric analysis of the G418-treated cells at this stage showed that the MFI value was significantly increased and that the proportion of the 3G9-positive population was increased from 30% () to 55% ()). Then, we successively incubated these G418-treated cells in the absence of G418 for 10 days. The MFI value was decreased and the proportion of the 3G9-positive population was decreased from 55% to 24% ()). We further cultured these cells to the culture medium containing 1.5 mg/mL G418 and cultured for 1 month. We could observe that the MFI value was greatly increased and the proportion of the 3G9-positive population returned back to 52% ()). These results showed that the G418-treatment induced the increase of the 3G9 epitope and that this induction was reversible dependent on the presence and absence of G418 in parental CHO cells. These features of the parental cells were the same as those of the pcDNA3.1(neo)-transfected cells, suggesting that the increased expression of 3G9 epitope was due to the G418 effect, independent of the transfection with the neo gene. It should be noted that the 3G9-positive population remained at a high level (59%) even at 2 days after removal of G418 (), middle), suggesting that the time course of the inducible changes of the 3G9 epitope is of day level. However, the kinetics of G418-dependent induction of the SiaS expression are to be examined in detail. Taken together, we conclude that G418 reversibly induces the expression of 3G9 epitope, even at low concentrations that do not kill the CHO cells.
Figure 4. Cell density-dependent expression of 3G9 epitope. (a) CHO cells were inoculated into 10 cm-dishes at 1.0, 1.5 and 2.0 × 10⁶ cells, and cultured for 2 days. The surface expression of 3G9 epitope was analyzed by flow cytometry. The % value in each panel indicates the proportion of 3G9-positive cell population. (b) The mean fluorescence intensity (MFI) values for the 3G9 epitope profiles are shown for each initial cell density at inoculation. (c) The proportions of the 3G9-positive cell population (% Area) are shown for each initial cell density at inoculation. (d) CHO cells were transfected with the pcDNA3.1(neo) plasmid, and selected by G418 for 15 days to establish the stable cell line. The pcDNA3.1(neo)-transfected CHO cells were inoculated into 10 cm-dishes at 1.0, 1.5 and 2.0 × 10⁶ cells, and cultured for 2 days without G418. The expression of 3G9 epitope was analyzed by flow cytometry. (e) The MFI values are shown as in b. (f) The proportions of the 3G9-positive cell population (% Area) are shown as in c. All the experiments were triplicated, and the error bars indicate the standard deviations. *p < 0.05 (Student t-test, n = 3).

Effects of cell density on the 3G9 epitope expression
The flow cytometric analysis showed that there were two populations in CHO cell lines: 3G9-positive and negative populations ()). To answer the question of why it happened even when the cells were cultured in the same dish under the same conditions, effects of cell density on the expression of 3G9 epitope were investigated. CHO cells were cultured in each 10 cm-dish that was inoculated at different cell numbers, 1.0, 1.5, and 2.0 × 10⁶ cells for 2 days, and the cell numbers reach 2.5, 4.8, and 6.3 × 10⁶ cells/dish, or 40%, 80%, and 100% confluent states, respectively. The harvested cells were analyzed by flow cytometry with 3G9 ()). The MFI value ()) and the proportion of 3G9-positive cells ()) were both the highest for the initial cell density of 1.5 × 10⁶ cells/dish, compared with those at other lower and higher initial cell densities. Thus, the expression of the 3G9 epitope is dependent on cell density. The same experiments were carried out for the G418-treated pcDNA3.1(neo)-transfected cells to examine if the cell density-dependent expression was affected by the transfection and G418 treatment. The stably transfected cells were inoculated into a 10 cm-dish at different cell numbers, 1.0, 1.5, and 2.0 × 10⁶ cells and cultured for 2 days without G418. They showed longer doubling times than the parental cells, and the cell numbers reach 2.0, 3.5, and 5.1 × 10⁶ cells/dish, or 40%, 60%, and 90% confluent states, respectively. The harvested cells were analyzed by flow cytometry with 3G9 ()). The MFI value ()) and the proportion of 3G9-positive cells ()) were both the highest for the initial cell density of 1.5 × 10⁶ cells/dish of those for other cell densities, which were the same results with the parental cells. Therefore, we can conclude that the cell density-dependent expression of 3G9 epitope is unrelated with the transfection or the G418 treatment. Since 4.8 × 10⁶ cells/dish for the parental cells and 3.5 × 10⁶ cells/dish for the G418-treated pcDNA3.1(neo)-transfected cells were corresponding to 80% and 60% confluent states, respectively, the expression of 3G9 epitope was maximized at the late exponential to nearly confluent stages of cell proliferation.
Chemical identification of Neu5Ac8S
To make sure if the 3G9 epitope that was expressed in CHO cells was sulfated Sia, the G418-treated CHO cells were analyzed by the fluorometric HPLC analysis. The stably transfected CHO cells with pcDNA3.1(neo) were treated with 1.5 mg/mL G418 for 2 days and the cell lysate was hydrolyzed to release free Sias, followed by the DMB derivatization for the HPLC analysis (). The authentic DMB-Neu5Ac8S was eluted before DMB-Neu5Ac ()). The retention time for DMB-Neu5Ac8S in ) was different from that in ), because the dates of experiment were different from each other. A peak eluted at the corresponding retention time with the authentic DMB-Neu5Ac8S was detected for both the G418-untreated and treated cells ()). The peak of DMB-Neu5Ac8S for the G418-treated cells was higher than that for the untreated ones. The detected peak was also found to be increased when the authentic DMB-Neu5Ac8S was co-injected (), bottom panel), thus indicating that the 3G9 epitope increased in the G418-treated cells is corresponding to Neu5Ac8S. Based on the peak areas ()), Neu5Ac8S and Neu5Ac amounted to 3.1 and 1,400 pmol/mg protein for G418-untreated cells, respectively, and 17 and 2,000 pmol/mg for G418-treated cells, respectively. The Neu5Ac8S to Neu5Ac ratio was increased from 0.22% to 0.85% of total amounts of Neu5Ac after the treatment of G418.
Figure 5. Identification of the G418-induced 3G9-epitope in CHO cells by the fluorometric HPLC analysis. (a) HPLC profiles of the DMB-Neu5Ac (Neu5Ac) and DMB-Neu5Ac8S (Neu5Ac8S) (Authentic). The retention time was different from those in b, because the experiments were carried out on the separate day; however, the order of elution is always the same. (b) HPLC profiles of DMB-derivatives of the CHO cells cultured in the absence (Untreated) and presence (Treated) of 1.5 mg/mL G418. The bottom panel (Treated+Neu5Ac8S) shows the HPLC profile of the sample from the treated cells co-injected with DMB-Neu5Ac8S. The arrows indicate a peak of DMB-Neu5Ac8S.

Discussion
In this study, we for the first time demonstrated the presence of SiaS in mammalian cell lines, whose expression depends not only on the type of cell lines but also on the cell density. We also demonstrated that the expression of SiaS is increased by the treatment of the cells with the antibiotic G418. This is the first observation that the expression level of SiaS is regulated under the intrinsic and extrinsic factors. In particular, the expression of SiaS is reversibly regulated by the G418-treatment in CHO cells. It is thus suggested that there exists a sulfotransferase responsible for sulfation of Sia residues, whose gene expression and/or enzyme activation are induced by the presence and absence of G418.
G418 is a Micromonospora-produced aminoglycoside antibiotic [Citation19], and inhibits protein biosynthesis in eukaryotes as well as in prokaryotes [Citation20,Citation21], eventually being toxic to the cells. Resistance to G418 is acquired by the eukaryotic cells that express the antibiotic resistance gene [Citation22]. Therefore, G418 is often used as a selective agent for the introduction of the antibiotic resistance gene that is often accompanied by a gene for an exogenous protein into eukaryotic cells. The pcDNA3.1(neo) plasmid we used in this study encodes the aminoglycoside 3ʹ-phosphotransferase II as the antibiotic resistance gene [Citation23] and the multiple cloning site into which the gene for an exogenous protein can be subcloned. In this study, we observed that SiaS was inducibly expressed with G418, irrespective of the pcDNA3.1(neo)-transfected or parental cells (), thus indicating that the antibiotic G418 causes the induction of SiaS as an intrinsic response of normal cells. It has been shown that G418 inhibits the translation of nascent proteins by directly acting on ribosome [Citation20,Citation21]. We do not know relationships between the impaired protein biosynthesis and the induction of SiaS; however, G418-driven impairments of protein biosynthesis might induce the expression of SiaS through some stress response. In this regard, one can speculate that the cell density-dependent changes of sulfation () may relate to protein biosynthetic status which may depend on cell proliferation stages. Alternatively, it is well known that sulfation is involved in detoxification of numerous xenobiotic compounds that pose a threat to the cells, in which cytosolic sulfotransferases play a major role [Citation24–Citation26]. This study did not show any evidence of direct sulfation of G418 in CHO cells. In no organisms, sulfation of aminoglycoside antibiotics has been reported. However, it would be interesting to study the sulfation of Sia residues in relation with detoxification reactions in future. Finally, we previously showed that sulfated Sia residues were resistant to bacterial sialidases [Citation13]. The increase of the expression of SiaS on the cell surface in the presence of G418 may give the cell surface resistant property to exogenous or endogenous sialidases. We do not know the meaning of the increased expression of surface SiaS; however, this may be related to increased levels of serum sialidases in occasions of inflammation and infection of pathogenic bacteria [Citation1,Citation27].
Sialylation and desialylation of glycoconjugates are critically important events that affect the fate of the glycoconjugates and subsequently the cells. Notably, our study has revealed that sulfation and desulfation of the Sia residues on the glycoconjugates happen frequently and dynamically. This is a different process than the sialylation/desialylation as terminal modifications of glycoconjugates. Thus, we here propose a new concept that there always happens a fine tuning of terminal Sia structure by the modification/de-modification for cells to respond to intrinsic and extrinsic changes of conditions. Further studies are necessary on the identification and characterization of enzymes involved in inducible sulfation/desulfation.
Author contributions
NE performed all the experiments and collect the data. NE, CS, and KK designed and discussed the results. All authors approved the final version of the manuscript for submission.
Disclosure statement
No potential conflict of interest was reported by the authors.
Additional information
Funding
References
- Schauer R, Kamerling JP. Exploration of the sialic acid world. Adv Carbohydr Chem Biochem. 2018;75:1–213.
- Varki A, Schnaar RL, Schauer R. Sialic acids and other nonulosonic acids. In: Varki A, Cummings RD, Esko JD, et al., editors. Essentials of glycobiology. 3rd ed. Cold Spring Harbor (NY): Cold Spring Harbor Laboratory Press; 2015. p.179–195.
- Kitajima K, Varki N, Sato C. Advanced technologies in sialic acid and sialoglycoconjugate analysis. Top Curr Chem. 2015;367:75–103.
- Baumann AM, Bakkers MJ, Buettner FF, et al. 9-O-acetylation of sialic acids is catalysed by CASD1 via a covalent acetyl-enzyme intermediate. Nat Commun. 2015;6:7673.
- Prokazova NV, Mikhailov AT, Kocharov SL, et al. Unusual gangliosides of eggs and embryos of the sea urchin strongy locentrotus intermedius. Structure and density-dependence of surface localization. Eur J Biochem. 1981;115:671–677.
- Kochetkov NK, Smimova GP, Chekareva NV. Isolation and structural studies of a sulfated sialosphingolipid from the sea urchin Echinocardium cordatum. Biochim Biophys Acta. 1976;424:274–283.
- Kubo H, Irie A, Inagaki F, et al. Gangliosides from the eggs of the sea urchin, Anthocidaris crassispina. J Biochem (Tokyo). 1990;108:185–192.
- Ijuin T, Kitajima K, Song Y, et al. Isolation and identification of novel sulfated and nonsulfated oligosialyl glycosphingolipids from sea urchin sperm. Glycoconj J. 1996;13:401–413.
- Kitazume S, Kitajima K, Inoue S, et al. The occurrence of novel 9-O-sulfated N-glycolylneuraminic acid-capped a2/5-Oglycolyl-linked oligo/polyNeu5Gc chains in sea urchin egg cell surface glycoprotein. Identification of a new chain termination signal for polysialyltransferase. J Biol Chem. 1996;22:6694–6701.
- Miyata S, Sato C, Kitamura S, et al. A major flagellum sialoglycoprotein in sea urchin sperm contains a novel polysialic acid, an alpha2,9-linked poly-N-acetylneuraminic acid chain, capped by an 8-O-sulfated sialic acid residue. Glycobiology. 2004;14:827–840.
- Miyata S, Sato C, Kumita H, et al. Flagellasialin: a novel sulfated alpha2,9-linked polysialic acid glycoprotein of sea urchin sperm flagella. Glycobiology. 2006;16:1229–1241.
- Miyata S, Yamakawa N, Toriyama M, et al. Co-expression of two distinct polysialic acids, α2,8- and α2,9-linked polymers of N-acetylneuraminic acid, in distinct glycoproteins and glycolipids in sea urchin sperm. Glycobiology. 2011;21:1596–1605.
- Yamakawa N, Sato C, Miyata S, et al. Development of sensitive chemical and immunochemical methods for detecting sulfated sialic acids and their application to glycoconjugates from sea urchin sperm and eggs. Biochimie. 2007;89:1396–1408.
- Maehashi E, Sato C, Ohta K, et al. Identification of the sea urchin 350-kDa sperm-binding protein as a new sialic acid-binding lectin that belongs to the heat shock protein 110 family: implication of its binding to gangliosides in sperm lipid rafts in fertilization. J Biol Chem. 2003;278:42050–42057.
- Slomiany A, Kojima K, Banas-Gruszka Z, et al. Structure of a novel sulfated sialoglycosphingolipid from bovine gastric mucosa. Biochem Biophys Res Commun. 1981;100:778–784.
- Slomiany BL, Kojima K, Banas-Gruszka Z, et al. Characterization of the sulfated monosialosyltriglycosylceramide from bovine gastric mucosa. Eur J Biochem. 1981;119:647–650.
- Ohta K, Sato C, Matsuda T, et al. Isolation and characterization of low density detergent-insoluble membrane (LD-DIM) fraction from sea urchin sperm. Biochem Biophys Res Commun. 1999;258:616–623.
- Hara S, Takemori Y, Yamaguchi M, et al. Fluorometric high-performance liquid chromatography of N-acetyl- and N-glycolylneuraminic acids and its application to their microdetermination in human and animal sera, glycoproteins, and glycolipids. Anal Biochem. 1987;164:138–145.
- Wagman GH, Testa RT, Marquez JA, et al. Antibiotic G-418, a new micromonospora-produced aminoglycoside with activity against protozoa and helminths: fermentation, isolation, and preliminary characterization. Antimicrob Agents Chemother. 1974;6:144–149.
- Eustice DC, Wilhelm JM. Fidelity of the eukaryotic codon-anticodon interaction. Interference by aminoglycoside antibiotics. Biochemistry. 1984;23:1462–1467.
- Moazed D, Noller H. Interaction of antibiotics with functional sites in 16S ribosomal RNA. Nature. 1987;327:389–394.
- Jimenez A, Davies J. Expression of a transposable antibiotic resistance element in Saccharomyces. Nature. 1980;287:869–871.
- Beck E, Ludwig G, Auerswald EA, et al. Nucleotide sequence and exact localization of the neomycin phosphotransferase gene from transposon Tn5. Gene. 1982;19:327–336.
- Stanley EL, Humeb R, Coughtrie MWH. Expression profiling of human fetal cytosolic sulfotransferases involved in steroid and thyroid hormone metabolism and in detoxification. Mol Cell Endocrinol. 2005;240:32–42.
- Gamage N, Barnett A, Hempel N, et al. Human sulfotransferases and their role in chemical metabolism. Toxicol Sci. 2006;90:5–22.
- Suiko M, Kurogi K, Hashiguchi T, et al. Updated perspectives on the cytosolic sulfotransferases (SULTs) and SULT-mediated sulfation. Biosci Biotech Biochem. 2017;81:63–72.
- Sumida M, Hane M, Yabe U, et al. Rapid trimming of cell surface polysialic acid (polySia) by exovesicular sialidase triggers release of preexisting surface neurotrophin. J Biol Chem. 2015;290:13202–13214.