
ABSTRACT
Potato (Solanum tuberosum L.) tubers are usually harvested once a year; thus, long-term storage is required to supply quality-assured tubers throughout the year. Further, an applicable method to predict tuber quality during storage is needed. In this study, gas chromatography-mass spectrometry (GC/MS) metabolomics was applied to identify applicable biomarkers for prediction of potato chip color based on 3 years’ field-grown tubers. The projections to latent structures (PLS) prediction model, calculated from a metabolome data set obtained before storage, was consistent with actual measured chip color values. Additionally, GC with frame ionization detector (GC/FID) metabolite fingerprinting simultaneously re-constructed more reliable and relevant prediction models for chip color quality compared to GC/MS. Moreover, nine metabolites detected by GC/MS analysis were further validated as applicable prediction markers. This strategy will provide a practical and cost-effective quality-control tool for potato processing manufacturers on an industrial scale.
Graphical abstract
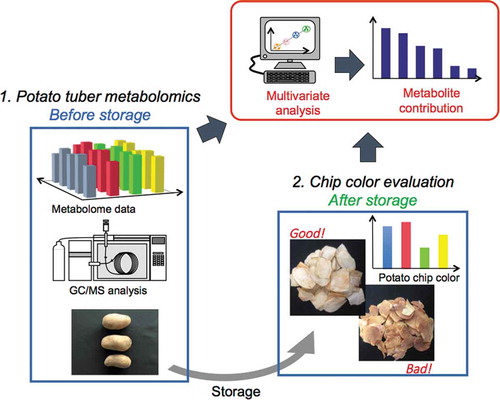
GC/MS and GC/FID metabolomics was applied to identify applicable biomarkers for prediction of potato chip color.
Potato (Solanum tuberosum L.) is the third most important crop worldwide, after wheat and rice, with an annual production of 487 million tons in 2017 (FAOSTAT; http://www.fao.org/faostad/). In the United States, over half of the tubers produced are used by processing industries to make chips, french fries, and related products (National Agricultural Statistics Service; https://www.nass.usda.gov/). Since potatoes are usually harvested once a year, storage in cold conditions is required to provide a year-round supply of quality-assured potatoes for processing. However, the most important traits for industrial use in tuber quality are the levels of reducing sugars. The amount of reducing sugars increases during cold storage due to cold-induced sweetening [Citation1]. During high-temperature deep frying, reducing sugars undergo the non-enzymatic Maillard reaction with amino acid asparagine, which results in browning, bitter, and burnt taste products [Citation2]. Additionally, toxic and potentially carcinogenic acrylamides are generated [Citation3].
The essential quality requirement for consumption of processed potato products is light-colored, flavorful foods. RNA interference (RNAi) suppression of Vinv (vacuolar acid enzyme invertase) transgenic tubers, which suppresses sucrose hydrolysis into fructose and glucose, resulted in higher chip quality, correlating with decreasing levels of tuber reducing sugar content [Citation4]. Furthermore, Vinv knockout lines exhibiting significantly decreased acrylamide levels in processed potato chips were created without the incorporation of foreign DNA using transcription activator-like effector nucleases (TALEN) techniques [Citation5]. Moreover, silencing the potato asparagine synthesis genes in tubers resulted in less than one-half the level of asparagine accumulation, resulting in the production of low-acrylamide potato chips [Citation6,Citation7]. Challenges based on corresponding molecular techniques, such as gene knockdown, have provided valuable frameworks for improving the quality of potato products in commercially suitable potato lines. Because public and political acceptance among these schemes differ in each country, a universally applicable tool for the potato supply chain must be established [Citation8].
Metabolomics is a rapidly emerging technology, which can extract useful metabolites that are differentially influenced by alteration in the environment, nutrition, and biological status using NMR and MS [Citation9]. Previously, we reported metabolite profiling with gas chromatography-mass spectrometry (GC-Q/MS) metabolomics techniques to identify relevant prediction markers for potato sprouting [Citation10]. Thus, these biomarkers can provide novel tools for controlling potato storage without the use of chemical-suppression agents such as chlorpropham (CIPC) to inhibit sprouting. On the other hand, the correlation study between potato constituents measured by HPLC and chip color was reported; however, evaluation of the influence of metabolites was limited to specific sugars, phenolic acids, and amino acids [Citation11,Citation12]. In this study, we investigated applicable metabolite markers derived from a similar metabolomics strategy. The level of these metabolites before storage will contribute to predict chip color after storage for stable potato chip production. Although metabolite prediction markers can successfully estimate chip color quality after long-term storage, capabilities to conduct MS with a specialized operator may be limited at each factory. Therefore, the application of identified prediction markers has been proposed using a more practical and cost-effective analytical system, gas chromatography with frame ionization detector (GC/FID). GC/FID is relatively inexpensive and widely available for routine quality-control analysis to predict chip color [Citation13–Citation15], thus more applicable than GC/MS, especially for small potato chip factories.
In this study, GC/MS metabolic profiling of tubers was performed in 2014 to develop a predictive model using projections to latent structures (PLS) regression analysis. The reproducibility of the prediction markers selected on the basis of their contribution to the PLS model was verified in 2015 and 2016. Subsequently, metabolic fingerprinting based on GC/FID was employed for the same sample set cultivated in 2014. Further, regression models based on GC/FID analysis were conducted to verify the applicability and repeatability of the established protocols. Taken together, our results will contribute to the development of a novel prediction method for determining potato chip quality after long-term storage for the potato supply industry.
Materials and methods
Potato tuber material
Chipping potato varieties, including typical varieties and breeding lines, were used in this study (Table S1). The potato breeding lines were chosen to roughly represent a wide range of chipping color. All potato tubers used in this study were grown in an experimental field of the Eniwa Research Station (Hokuren Agricultural Research Institute, Eniwa, Japan) between 2014 and 2016. Potatoes were cultivated during the beginning of May and the middle of October each year.
In total, 35 tubers for each cultivar or breeding line were collected from a ridge. At a production site, a prediction model would be used to predict the quality of tubers as a single lot. Therefore, the 35 tubers were collected as an individual lot (n = 1), even the same cultivar or breeding line was included in each year. Fifteen tubers were used both in GC/MS and GC/FID metabolome analysis, whereas the remaining 20 tubers were used for evaluation of chip color after storage. Tubers for metabolome analysis were frozen and lyophilized, then ground with an ultra-centrifugal mill (ZM 200, Retsch, Germany). Tubers for chip color evaluation were set to promote the final skin set and formation of the wound periderm for 2 weeks after harvest, followed by storage for 7 months at 8.0°C and 95% relative humidity.
Evaluation of chip color
After 7 months of storage, the remaining 20 tubers were washed and sliced to 1 mm thickness. Following, they were rinsed with tap water immediately and deep-fried using an electrical fryer (Maruzen Co, Ltd, Tokyo, Japan) with ordinary palm oil for 100 s at 180°C to make chips for each cultivar or breeding line. Evaluation of chip color was performed using an agtron scale (M series 2, Agtron Inc, Reno, NV, USA), which is a spectrophotometer used for color evaluation of foods. The scale was calibrated to 0 with a black disk and 100 with a white disk. Approximately 100 g of chips was used and measured three times (n = 3). Mean values of chip color for each cultivar or line are listed in Table S1.
Reagents
All chemicals, including methanol, chloroform, ribitol used as an internal standard, and pyridine, were purchased from Wako (Osaka, Japan). Methoxyamine hydrochloride was purchased from Sigma (St. Louis, MO, USA). N-Methyl-N-(trimethylsilyl)trifluoroacetamide and hydrocarbon mixtures were purchased from GL Sciences, Inc. (Tokyo, Japan).
Sample preparation for metabolome analysis
Extraction and derivatization steps were conducted according to the methods of Pongsuwan et al. [Citation16]. Briefly, 10 μg of freeze-dried potato powder was ground again with a Retsch (Haan, Germany) ball mill (20 Hz, 5 min) with liquid nitrogen cooling and extracted with 1 mL of extraction solvent consisting of methanol/distilled water/chloroform (5:2:2, v/v/v) containing an internal standard (ribitol at 12 μg/mL). The mixture was shaken for 30 min and centrifuged at 16,000 g for 3 min at 4°C. Subsequently, 900 μL of supernatant was transferred to a 1.5 mL Eppendorf tube, and 400 μL of Milli-Q water (Wako) was added before vortexing. Following centrifugation (16,000 g, 3 min, 4°C), 400 μL of supernatant was transferred to a fresh 1.5 mL Eppendorf tube and capped. Additionally, 200 μL of supernatant was collected from each sample and pooled to produce a mixture of all samples used as quality controls (QCs). Extracts were evaporated to remove methanol in a centrifuge vacuum concentrator (CVE-3110, EYELA, Tokyo, Japan) for 2 h, followed by freeze-drying overnight.
For derivatization, 100 μL of methoxyamine hydrochloride in pyridine (20 mg/mL) was added to the sample as the first derivatizing agent, and the mixture was incubated at 30°C for 90 min. For the second derivatizing agent, 100 μL of N-methyl-N-(trimethylsilyl)trifluoroacetamide (MSTFA) was added and incubated at 37°C for 30 min. One microliter of the sample was injected in split mode (25:1, v/v), and QCs were analyzed every five injections.
GC/MS analysis and data processing
GC/MS analysis workflow for hydrophilic potato tuber extracts has been described in detail elsewhere [Citation10]. The median relative standard deviation (RSD) of intensities for each peak based on 22 QC analyses was 10.13. According to a previous benchmark study, the RSD value was acceptable and did not warrant technical replication [Citation17]. Raw data files were converted into an AIA file (ANDI files: Analytical Data Interchange Protocol, *.cdf) by the GC-MS Solution software package (Shimadzu, Kyoto, Japan). Freely available MetAlign software package [Citation18] was used for processing of GC/MS scan data on the ANDI files, and peak retention time alignment was normalized to the ribitol internal standard. QCs were employed for normalization of each peak intensities based on the LOWESS software package [Citation19]. The normalized data matrices were then imported into AIoutput2 (version 1.29) [Citation20,Citation21] for automated RI-based compound identification and quantification.
GC/FID analysis and data processing
GC/FID analysis was performed on a GC-2010 (Shimadzu) coupled to an injector (AOC-20i/s, Shimadzu) using potato tubers cultivated in 2014. For data validation, the same type of column analysis was performed. The injector and FID temperature were set at 230°C and 330°C, respectively. Column flow rate of the carrier gas (helium) was set at 1.72 mL/min with a linear velocity of 39 cm/s. The column temperature program was the same as the GC/MS analysis. Since appropriate software programs for automatic baseline correction and alignment of each peak were not available for the GC/FID systems used in this study, both selection and alignment of each peak were performed manually with a threshold peak intensity of 1000 (Table S2). QCs were also employed for normalization of each peak intensity based on the LOWESS software package, same as the GC/MS analysis [Citation16].
Multivariate data analysis
Prior to multivariate analysis, metabolite data sets were auto-scaled as pretreatment to accommodate differences among metabolites. PLS regression analysis was performed using commercial software, The Unscrambler (v10.2; CAMO ASA, Trondheim, Norway), to analyze the relationships between potato tuber metabolome and chip quality after long-term storage. A 7-fold cross-validation was carried out to assess the accuracy of the prediction model in practice. The goodness-of-fit (R2) and predictability (Q2) parameters were determined.
Results and discussion
Determination of chipping quality
Chip color is one of the most important factors for the quality of fried potato chips for visual appearance as well as the accumulation of toxic acrylamide formed by the Maillard reaction during deep frying. Quantification of the chip color degree is determined by the agtron scale. The color values of cultivars and breeding lines used in this study are summarized in Table S1. Breeding line_H showed the highest color quality both in 2014 and 2015, whereas NY-115 had the highest value in 2016.
GC/MS metabolome analysis
In our previous study, several chipping potato varieties and breeding lines were used to construct a prediction model of tuber sprouting in 2014 and 2015 [Citation10]. In this study, potato tubers cultivated in 2016 were also investigated. Table S3 shows the annotated and identified metabolites, which were used for further analysis in each year. Because the cultivars and environmental conditions including the experimental fields and pest control varied, differences in the annotated metabolites among the 3 years were observed.
Regression modeling of projections to latent structures (PLS)
PLS regression modeling was employed to determine the relationships between potato chip quality and the metabolome data set obtained before storage. In this study, metabolite peak intensities obtained by GC/MS analysis were used as the prediction variables (X), whereas chip color values measured by agtron scale obtained after 7 months storage were used as (Y). PLS models described the response variable well with Q2 = 0.76, 0.57, and 0.75 in 2014, 2015, and 2016, respectively (Q2 denotes cross-validated fitting) (). Potato chip quality predicted by the tuber metabolome obtained shortly after harvest corresponded well to actual measurements among the 3 years’ analysis.
Figure 1. PLS regression model for chip color quality based on measured score vs predicted score based on GC/MS data of (a) 59 cultivars or lines in 2014, (b) 33 cultivars or lines in 2015, and (c) 56 cultivars or lines in 2016. The models consist of an individual lot of tubers even same cultivar or breeding line is included (n = 1).

The initial motivation of this study was to identify applicable biochemical markers that could predict, at or shortly after harvest, chip color quality following long-term storage. To identify highly contributable metabolite marker candidates, variable importance in projection (VIP) values were calculated based on PLS analysis [Citation22]. X-terms with large VIP values (>1.0) are more relevant for explaining Y. In 2014, 21 metabolites including reducing sugars, amino acids, organic acids, and other compounds with high VIP scores were identified (). These results were in good agreement with correlation analysis based on HPLC profiling [Citation11,Citation12]; however, the significant influence of malic acid, glyceric acid, malonic acid, citric acid, adenine, and allantoin was a new finding of this study. The reproducibility of these metabolites observed between different years is shown in . The VIP values of malic acid and reducing sugars, including glucose, fructose, and mannose, had remarkably high reproducibility as constitutive metabolites from the Maillard reaction, which play essential roles for chip color quality. Therefore, these metabolites were determined as robust biochemical markers for chip color prediction. Additionally, alanine, leucine, and aspartic acid highly contributed to the prediction model. On the other hand, asparagine revealed lower correspondence to chip color, even producing brown color with reducing sugars, which is considered less useful as a prediction marker. Asparagine synthetase converts aspartate to asparagine in an ATP-dependent reaction. During storage, respiration rate in later storage increases 2–4 times higher than the beginning of storage [Citation23], suggesting that asparagine synthetase activity, involved in ATP consumption, increased after dormancy. Although asparagine concentration in potato tuber increases during storage at low temperatures [Citation24,Citation25], significant relationships were not observed between asparagine levels measured before storage and chip color in this study. Conversely, caffeic acid provides higher contribution values in the prediction model, which would affect browning of potato chips, depending on the nonenzymatic polyphenol oxidative reaction [Citation26].
Table 1. Degree of reproducibility for high VIP metabolites (VIP > 1).
Application of prediction markers based on GC/FID metabolic fingerprinting
Due to the GC/MS potato tuber metabolomics cultivated three-year field experiments, several predictive markers for chip color were extracted. Consequently, GC/FID fingerprinting was employed for the development of rapid assessment using potato samples collected in 2014, which can be a more cost-effective and applicable tool for quality screening of potato chips.
Table S2 shows RT of 58 detected peaks subjected for further analysis (sample 47 (underlined) was excluded because peak alignment was not successful due to significant variability in differences in RT of each peak). Consequently, 58 peaks detected from 58 samples were subjected to PLS regression analysis to construct the prediction model, same as the MS analysis. The PLS model was built with an R2 = 0.87 and Q2 = 0.75 (). The robustness of the model in predicting (Q2) derived from GC/FID was similar to that of the GC/MS data. Twelve peaks detected in the GC/FID chromatograms had large VIP values (>1.0), which significantly contributed to the prediction model (). Although detailed information of each peak is not required for metabolic fingerprinting [Citation9], individual annotations of 12 peaks were performed to verify the quality of prediction markers extracted from the GC/MS analysis. A total of 40 peaks were tentatively annotated by determination of retention time of both co-injected authentic chemical standards and contrast of the identified peaks based on GC/MS chromatograms (Table S2). Differences in retention time between authentic standards and each peak detected in tuber analysis were sufficiently small, including those for alanine (0.000 min), malic acid (0.007 min), and caffeic acid (0.014 min). As a result, nine metabolites, including alanine, glyceric acid, malic acid, citric acid, allantoin, fructose, glucose, and inositol, were annotated, which highly contributed to the prediction model constructed by GC/FID analysis (). These results suggest that the GC/FID system would provide robust, inexpensive, and widely acceptable analysis to screen chipping potato quality. For practical application, differences between tuber production lots due to environmental conditions including weather, soil, fertilization, and pest control require further investigation.
Table 2. Comparison of metabolites with large VIP values from GC/FID and GC/MS in 2014.
Figure 2. PLS regression model for chip color quality based on measured score vs predicted score based on GC/FID data in 2014. The models consist of an individual lot of tubers even same cultivar or breeding line is included (n = 1).

In this study, a metabolite profiling for potato chip quality evaluation using the GC/MS metabolomics strategy was performed, which provides a chip color prediction model from the tuber metabolome obtained shortly after harvest. Previously, we investigated a similar strategy to identify applicable prediction markers for potato sprouting [Citation10]. Since tuber sprouting and potato chip color are the most important traits for the potato processing industry, appropriate systems to monitor prediction markers for assessment of these phenotypes would be highly desirable. Additionally, GC/FID metabolite fingerprinting simultaneously re-constructed reliable and relevant prediction models for chip color quality compared to GC/MS. Nine metabolites, including alanine, glyceric acid, malic acid, citric acid, allantoin, fructose, glucose, and inositol, detected by GC/MS analysis were further validated as applicable prediction markers through GC/FID analysis. Therefore, this strategy will provide a practical and cost-effective application for quality control, especially for routine analysis among potato processing manufacturers on an industrial scale.
Author contribution
T.F. designed and performed the experiments and analyzed the data. K.T carried out GC/FID measurements and analysis. T.F. wrote the manuscript in consultation with E.F. and T.B. All authors discussed the results and commented on the manuscript.
Supplemental_tables_3.pdf
Download PDF (46.6 KB)Supplemental_tables_2.pdf
Download PDF (310.7 KB)Supplemental_tables_1.pdf
Download PDF (38.2 KB)Acknowledgments
We thank members of the Hokuren Eniwa Research Station for sample development. We also would like to thank Editage (www.editage.com) for English language editing.
Disclosure statement
The authors declare no competing financial interest.
Supplementary material
Supplemental data for this article can be accessed here.
References
- Alamar MC, Tosetti R, Landahl S, et al. Assuring potato tuber quality during storage: a future perspective. Front Plant Sci. 2017;8:2034.
- Shallenberger RS, Smith O, Treadway RH. Food color changes, role of the sugars in the browning reaction in potato chips. J Agric Food Chem. 1959;7:274–277.
- Mottram DS, Wedzicha BL, Dodson AT. Acrylamide is formed in the Maillard reaction. Nature. 2002;419:448–449.
- Wiberley-Bradford AE, Busse JS, Jiang J, et al. Sugar metabolism, chip color, invertase activity, and gene expression during long-term cold storage of potato (Solanum tuberosum) tubers from wild-type and vacuolar invertase silencing lines of Katahdin. BMC Res Notes. 2014;7:801.
- Clasen BM, Stoddard TJ, Luo S, et al. Improving cold storage and processing traits in potato through targeted gene knockout. Plant Biotechnol J. 2015;14:169–176.
- Rommens CM, Yan H, Swords K, et al. Low-acrylamide French fries and potato chips. Plant Biotechnol J. 2008;6:843–853.
- Chawla R, Shakya R, Rommens CM. Tuber-specific silencing of asparagine synthetase-1 reduces the acrylamide-forming potential of potatoes grown in the field without affecting tuber shape and yield. Plant Biotechnol J. 2012;10:913–924.
- Keijbets MJH. Potato processing for the consumer: developments and future challenges. Potato Res. 2008;51:271–281.
- Fiehn O. Metabolomics - the link between genotypes and phenotypes. Plant Mol Biol. 2002;48:155–171.
- Fukuda T, Takamatsu K, Bamba T, et al. Gas chromatography-mass spectrometry metabolomics-based prediction of potato tuber sprouting during long-term storage. J Biosci Bioeng. 2019;128:249–254.
- Rodriguez-Saona LE, Wrolstad RE, Pereira C. Modeling the contribution of sugars, ascorbic acid, chlorogenic acid and amino acids to non-enzymatic browning of potato chips. J Food Sci. 1997;62:1001–1010.
- Rodriguez-Saona LE, Wrolstad RE. Influence of potato composition on chip color quality. Am Potato J. 1997;74:87–106.
- Na C, Wang H, Lu X, et al. Metabolic fingerprinting investigation of Artemisia annua L. in different stages of development by gas chromatography and gas chromatography-mass spectrometry. J Chromatogr A. 2008;1186:412–419.
- Jumtee K, Bamba T, Fukusaki E. Fast GC/FID based metabolic finger- printing of Japanese green tea leaf for its quality ranking prediction. J Sep Sci. 2009;32:2296–2304.
- Yeh TF, Morris CR, Goldfarb B, et al. Utilization of polar metabolite profiling in the comparison of juvenile wood and compression wood in loblolly pine (Pinus taeda). Tree Physiol. 2006;26:1497–1503.
- Pongsuwan W, Fukusaki E, Bamba T, et al. Prediction of Japanese green tea ranking by gas chromatography/mass spectrometry-based hydrophilic metabolite fingerprinting. J Agric Food Chem. 2007;55:231–236.
- Parsons HM, Ekman DR, Collette TW, et al. Spectral relative standard deviation: a practical benchmark in metabolomics. Analyst. 2009;134:478–485.
- Lommen A. MetAlign: interface-driven, versatile metabolomics tool for hyphenated full-scan mass spectrum data processing. Anal Chem. 2009;81:3079–3086.
- Tsugawa H, Kanazawa M, Ogiwara A, et al. MRMPROBS suite for metabolomics using large-scale MRM assays. Bioinformatics. 2014;30:2379–2380.
- Tsugawa H, Tsujimoto Y, Arita M, et al. GC/MS based metabolomics: development of a data mining system for metabolite identification by using soft independent modeling of class analogy (SIMCA). BMC Bioinf. 2011;12:131–143.
- Tsugawa H, Bamba T, Shinohara M, et al. Practical non-targeted gas chromatography/mass spectrometry-based metabolomics platform for metabolic phenotype analysis. J Biosci Bioeng. 2011;112:292–298.
- Chong I, Jun C. Performance of some variable selection methods when multicollinearity is present. Chemom Intell Lab Syst. 2005;78:103–112.
- Copp LJ, Blenkinsop RW, Yada RY, et al. The relationship between respiration and chip color during long-term storage of potato tubers. Am J Potato Res. 2000;77:279–287.
- Muttucumaru N, Powers SJ, Elmore JS, et al. Evidence for the complex relationship between free amino acid and sugar concentrations and acrylamide-forming potential in potato. Ann Appl Biol. 2014;164:286–300.
- Brierley ER, Bonner PLR, Cobb AH. Aspects of amino acid metabolism in stored potato tubers (cv. Pentland Dell). Plant Sci. 1997;127:17–24.
- Cilliers JJL, Singleton VL. Nonenzymic autoxidative phenolic browning reactions in a caffeic acid model system. J Agric Food Chem. 1989;37:890–896.