
 ?Mathematical formulae have been encoded as MathML and are displayed in this HTML version using MathJax in order to improve their display. Uncheck the box to turn MathJax off. This feature requires Javascript. Click on a formula to zoom.
ABSTRACT
The apparent amylose content (AAC) is usually measured by an iodine colorimetric method using the starch as a sample. Nevertheless, it is time-consuming and labor-intensive to prepare rice starch. Therefore, we compared two methods, starch method and milled rice flour method. The former AACs were higher than the latter and correlated with pasting properties, physical properties and sensory scores better than the latter. Therefore, we developed a novel formula for estimating the AACs of starches from japonica rice cultivars using milled rice flours instead of using rice starch. The correlation coefficients of the new formula were 0.89 for calibration and 0.94 for validation, which showed that this equation can be applied to unknown japonica rice samples, and will lead to easy, rapid, and accurate iodine method to determine rice AACs using milled rice flours instead of starch.
Abbreviations: AAC: apparent amylose content; RS: resistant starch; SLC: super-long chain; CD: chain length distribution; RVA: Rapid Visco Analyzer; SB: setback; BD: breakdown; Max.vis: maximum viscosity; Min.vis: minimum viscosity; Pt: pasting temperature; Cons: consistency; Final.vis: Final viscosity; SB/Cons: setback/consistency; Max/Min: maximum viscosity/minimum viscosity; Max/Fin: maximum viscosity/final viscosity.
GRAPHICAL ABSTRACT
Formula for estimating the AACs of rice starch based on the iodine colorimetric analysis using milled rice flour.
Rice (Oryza sativa L.) is one of the main food crops throughout the world and the staple food for over half of the global population. Therefore, it is necessary and meaningful for consumers to improve the quality of rice all over the world. Quality evaluations for rice are performed using a sensory test and based on physicochemical measurements. The former is a basic method but requires much amounts of samples and many panelists. Therefore, novel methods and advanced instruments need to be developed to assess palatability. According to Ohtsubo et al. [Citation1], grain quality evaluations aim to select high-quality rice simply and accurately. Particularly, amylose is one of the components of rice starch that greatly affects the quality and gelatinization properties of cooked rice [Citation2]. Low-amylose rice generally becomes soft and sticky after cooking, whereas high-amylose rice becomes hard with fluffy separated grains [Citation3]. The group of high-amylose starches includes two types of rice starches with similar apparent amylose content (AAC) but different super-long chains (SLC) contents of amylopectin [Citation4,Citation5].
Rice starches contain 0–30% of amylose, and their contents vary depending on the rice cultivars and the ambient temperatures during the development of the grains. The starches of rice grown at low temperature have a significantly higher amylose content than those of rice grown at high temperatures [Citation6–Citation11].
The initial colorimetric method reported for the determination of rice amylose content was that of Williams et al. [Citation12] and was simplified by Juliano [Citation13] and Inatsu et al. [Citation14]
The most widely used assay for amylose determination is colorimetric assay, in which iodine binds with amylose to produce a blue-purple product, which is measured spectrophotometrically at 620 nm [Citation15]. Amylopectin reacts with iodine to yield a colored product, which interferes with the direct measurement of that of the amylose-iodine complex. Igarashi et al. [Citation16] used an automatic analyzer, developed to obtain an iodine absorption spectrum ranging from 400 to 900 nm setting 600 nm as a bordering wavelength. Not only amylose but also amylopectin greatly affects the gelatinization properties of rice starch and eating quality of cooked rice grains. We previously found that the iodine absorption curve differed among the various sample rice cultivars and developed the estimation formulae for AAC, resistant starch (RS) content, and amylopectin chain length [Citation17]. Those equations were meaningful, but starch preparation is time-consuming and labor-intensive.
Here we evaluated the relationship between AACs measured using starch from 48 japonica rice samples and those using milled rice flours. Based on the iodine absorption curves using milled rice flours instead of rice starches, we tried to develop a novel estimation formula for AACs which would provide an easy, rapid, and accurate method for characterizing AAC.
Materials and methods
Materials
The rice samples were purchased in 2018 at a local market and were subjected to the measurement in 2019 (Japonica subspecies) (n = 27). Japonica were as follows: Akitakomachi (cultivated in Akita), Datemasayume (Miyagi), Ginganoshizuku (Iwate), Hatsushimo (Gifu), Hitomebore (Miyagi), Ichihomare (Fukui), Kinumusume A (Shimane), Kinumusume B (Shimane), Koshihikari A (Toyama), Koshihikari B (Niigata), Morinokumasan (Kumamoto), Nanatsuboshi A (Hokkaido), Nanatsuboshi B (Hokkaido), Ryunohitomi (Gifu), Sagabiyori (Saga), Sasanishiki A (Miyagi), Sasanishiki B (Miyagi), Seitennohekireki A (Aomori), Seitennohekireki B (Aomori), Tsuyahime A (Yamagata), Tsuyahime B (Yamagata), Tsuyahime C (Shimane), Yukiwakamaru (Yamagata), Yumeobako (Akita), Yumepirika A (Hokkaido), Yumepirika B (Hokkaido), and Yumeshizuku (Saga).
And the rice samples were purchased in 2017 at a local market and subjected to the measurement in 2018 (Japonica subspecies) (n = 21). Japonica was as follows: Asahi (Okayama), Asahinoyume A (Gunma), Akitakomachi (Akita), Genkitukushi (Fukuoka), Haenuki (Yamagata), Hatsushimo (Gifu), Hinohikari (Saga), Hitomebore (Miyagi), Koshihikari A (Niigata), Koshihikari B (Niigata), Milky-queen (Yamagata), Morinokumasan (Kumamoto), Nanatsuboshi (Hokkaido), Oborozuki (Hokkaido), Sagabiyori (Saga), Sasanishiki (Miyagi), Seitennohekireki (Aomori), Tentakaku (Toyama), Tsugaruroman (Aomori), Tsuyahime (Yamagata), and Yumepirika (Hokkaido).
Preparation of milled rice flour
Milled rice flour was prepared from each sample using a cyclone mill (SFC-S1; UDY, Corp., Fort Collins, Co, USA) with a screen containing 1-mm-diameter pores.
Preparation of starch granules
Starch granules were prepared from milled rice flour using the cold alkaline method [Citation18,Citation19].
Iodine absorption spectrum
The iodine absorption spectrum of alkali-treated rice starch and milled rice flour was measured using a Shimadzu UV-1800 spectrophotometer. The AACs of alkali-treated rice starch and milled rice flours were measured using the iodine colorimetric method of Juliano [Citation13,Citation20]. Potato amylose (type III; Sigma Chemical Co., St. Louis, MO) and waxy rice starch (fat and proteins removed) were used as amylose and amylopectin standards, respectively, for amylose determination. The iodine absorption spectrum [Citation17] was analyzed from 200 to 900 nm using a square cell with a 1 × 1 cm inner dimension. The absorbance was measured at 620 nm (followed to Juliano’s method), λmax (peak wavelength on iodine staining of starch, which shows high correlation with the length of glucan chain; molecular size of amylose and SLC), and absorbance at λmax (Aλmax).
Pasting properties
The pasting properties of milled rice flours from 48 premium japonica rice cultivars were measured using a Rapid Visco Analyzer (RVA) (model Super 4; Newport Scientific Pty Ltd, Warriewood, Australia). A programmed heating and cooling cycle described by Toyoshima et al. was adopted [Citation21].
Novel indices such as the Set/Cons ratio and Max/Fin ratio are very strongly correlated with the proportion of intermediate and long chains of amylopectin: Fb1+2+3 (DP ≥ 13) [Citation22].
Physical properties of cooked rice grains
For standard samples, the milled rice (10 g) was mixed with 14 g (1.4 times standard moisture content, w/w; 13.5% coefficient (gross water volume/dry matter weight): 1.77, calculated for each sample) of distilled water in an aluminum cup. After soaking for 1 h, the samples were cooked in an electric rice cooker (National SR-SW182). The cooked rice samples were kept in the vessel at 25°C for 2 h and then used to obtain measurements. The hardness and stickiness of the boiled rice grains were measured using a Tensipresser (My Boy System, Taketomo Electric Co., Tokyo, Japan) with the individual grain method in low compression (25%) and high compression (90%) tests [Citation23]. The average of each parameter was calculated by measuring 20 individual grains.
Sensory evaluation
The sensory test was carried out by the method reported in our previous paper [Citation24]. Koshihikari (product of Nagano in 2018) was used as a standard sample (score was 3 points). The milled rice (250 g) was added to 350 g (1.4 times standard moisture content, w/w; 13.5% coefficient (gross water volume/dry matter weight): 1.77, calculated for each sample) of distilled water at 15°C. After soaking for 1 h, the samples were cooked in an electric rice cooker (National SR-SW182). The cooked rice samples were kept in the vessel at 25°C for 1.5 h and then used for the sensory test 50 g each sample. The cooked rice samples were subjectively scored by eight trained taste panelists. Five rankings were used to evaluate the appearance, aroma, hardness, taste, and overall liking.
Statistical analyses
All the results, including the significance of regression coefficients, were statistically analyzed using Student’s t-test, one-way analysis of variance, and Tukey’s test with Excel Statistics (ver. 2006; Microsoft Corp., Tokyo, Japan).
Results and discussion
Measurement of iodine absorption spectra
AAC comprises large and small amounts of amylose and super-long chain (SLC) of amylopectin, respectively. The molecular structures of several starches are published, including those of amylose and amylopectin branch chain lengths [Citation25,Citation26]. The λmax of high molecular weight amyloses are generally longer and the λmax values of glutinous rice cultivars are very short. In contrast, indica rice and japonica–indica hybrid rice cultivars have higher λmax values, and normal japonica rice cultivars have intermediate values [Citation17]. The starches of rice cultivars grown at low temperatures have significantly higher amylose contents and lower SLC amylopectin contents than cultivars grown at high temperature [Citation7,Citation8]. For example, Taira et al. [Citation27] reported that the lipid content and fatty acid composition of rice are affected by the daily mean temperature during ripening. Starch lipids bind to amylose in the endosperm starch granules to form intertwined helices of amylose and hydrocarbon chains of lipids [Citation28–Citation30].
We found that the AACs measured using starch (9.1–18.6%; mean, 15.7%) from 27 japonica rice samples were higher than those measured using milled rice flours (6.3–15.5%; mean, 12.5%). AAC of Tuyahime A showed the highest value, whereas that of Datemasayume showed the lowest value among all rice samples.
The λmax values of starch (549.0–586.0 nm; mean, 577.2 nm) from 27 japonica rice samples were higher than those milled rice flour (533.0–574.0 nm; mean, 561.0 nm). The λmax value of Akitakomachi showed the highest, whereas that of Ryunohitomi showed the lowest ().
Table 1. Analysis of iodine absorption parameters of starch or milled rice flours from 27 japonica rice samples in 2018.
Sowbhagya et al. [Citation15] and Bolling et al. [Citation31] reported that native lipids compete with iodine in forming a complex with amylose; thus, whether the sample is defatted or not affects the result of amylose content measurements of seriously. We previously found that a low-amylose cultivars were more easily bonded to linolenic acid than linoleic acid, further, the oleic acid content negatively correlates with those of linoleic acid and palmitic acid [Citation32]. Morrison and Nasir [Citation33] reported about the significant linear correlations between amylose contents, lipid contents, gelatinization temperatures, and enthalpies of 60 rice starches.
To evaluate the properties of amylose and the effect of the chain length of amylopectin, we selected Aλmax as an indicator of amylopectin microstructure [Citation17]. The Aλmax values of starch (0.229–0.341; mean, 0.306) from 27 japonica rice samples were higher than those of milled rice flour (0.232–0.316; mean, 0.284). The Aλmax value of Tuyahime A showed the highest value, whereas that of Datemasayume showed the lowest value.
The λmax/Aλmax ratio showed an almost opposite tendency for AAC [Citation32]. The λmax/Aλmax ratios of starch (1709.3–2439.4; mean, 1896.5) from 27 japonica rice samples were lower than those of milled rice flour (1802.2–2302.6; mean,1987.6). The λmax/Aλmax ratio of Datemasayume showed the highest, whereas that of Tuyahime A showed the lowest ().
As a result, the AACs of starch from 27 japonica rice samples were 1.2–1.3-times higher than those using milled rice flours, and those of the λmax and Aλmax values were similar ().
Pasting properties
The pasting properties also influence the rice eating quality; therefore, it is useful to conduct a gelatinization test as a quality assay for rice [Citation34,Citation35]. Breakdown BD indicates the ease with which the starch granules are disintegrated. High-amylose cultivars had a higher final viscosity than low-amylose cultivars, where the final viscosity is related to the degree of starch retrogradation after cooling [Citation36]. A highly positive relationship was observed between SLC content and consistency viscosity, therefore, SLC in amylopectin appears to have a great effect on the viscosity consistency of starch [Citation5].
We, therefore, developed a novel index of the ratio of comprising Setback/Consistency (SB/Cons), which positively correlated with the proportion of intermediate- and long-chains of amylopectin (Fb1+2+3 (DP ≧ 13) Citation[22]). Further, we found that the ratio of Maximum viscosity to Final viscosity (Max/Fin) negatively correlated with (Fb1+2+3 (DP ≧ 13) Citation[22]). The 27 japonica rice samples had values as follows: Max.vis (319.1–414.9 RVU; mean, 355.0 RVU), BD values (158.6–255.0 RVU; mean, 207.0 RVU), SB (Final.vis – Max.vis: −167.0 – −11.5 RVU; mean, −83.8 RVU), Pt (61.5–68.1°C, mean, 65.6°C), Final.vis (183.3–322.0 RVU; mean, 271.2 RVU), Min. vis (101.5–180.3 RVU; mean, 148.0RVU), Cons (Final.vis – Mini.vis: (81.8–147.1 RVU; mean, 123.2RVU), SB/Cons (−2.0 – −0.1; mean, −0.7), Max/Min (1.0–1.9; mean, 1.3) and Max/Fin (1.9–3.5; mean, 2.4) (). The Final.vis of Seitennohekireki A showed the highest, whereas that of Datemasayume showed the lowest, and those of consistency values were similar. Koshihikari A showed the highest BD, whereas that of Seitennohekireki A showed the lowest value. Furthermore, Datemasayume showed the highest Max/Min and Max/Fin ratios, whereas that of Seitennohekireki A showed the lowest value.
Table 2. Pasting properties of 27 japonica milled rice samples in 2018.
The values of low-amylose japonica rice cultivars (Datemasayume and Ryunohitomi) were as follows: Max.vis. (mean, 359.2 RVU); BD values (mean, 244.1 RVU); SB (mean, −162.3 RVU); Pt (mean, 66.9°C); Final.vis (mean, 196.9 RVU); Min. vis (mean, 115.1 RVU); Cons (mean, 81.8 RVU); SB/Cons ratios (mean, −1.9); Max/Min ratios (mean, 1.8); and Max/Fin ratios (mean, 3.2) (). Thus, the Max.vis., BD, Max/Min, and Max/Fin ratios of low-amylose japonica rice cultivars were higher than those of ordinary japonica rice cultivars, although the values of Mini.vis., Final vis., SB, Cons, and SB/Cons ratios were lower than those of ordinary japonica rice cultivars.
Table 3. Physical properties of cooked milled rice of 27 japonica rice samples in 2018 using Tensipresser.
Physical properties of cooked rice grain
shows the physical properties of the cooked rice grains obtained using the low-compression (25%) and high-compression (90%) methods [Citation23] with the Tensipresser.
There were differences in the values of H1, H2, S1, S2, L3, A1, A3, A4, A6, “balance degree of surface layer (ratio of height) H1; S1/H1,” “balance degree of overall layer (ratio of height) H2; S2/H2,” “balance degree of surface layer (ratio of area) A1; A3/A1,” and “balance degree of overall layer (ratio of area) A2; A6/A4” between the cooked rice grains.
The balance of H1(S1/H1), H2(S2/H2), A1(A3/A1), and A2(A6/A4) are important indices when evaluating the palatability of rice [Citation37].
As shown in , the 27 japonica rice samples in 2018 had values as follows: the hardness of the surface layer (H1) (51.8–93.1 gw/cm2; mean = 70.5 gw/cm2), the hardness of the overall layer (H2) (1425.0–1961.0 gw/cm2; mean = 1730.3 gw/cm2), the stickiness of the surface layer (S1) (–20.4 – –8.9 gw/cm2; mean = –14.8 gw/cm2), the stickiness of overall layer (S2) (– 494.7 – –246.7; gw/cm2 mean = –381.0 gw/cm2), the balance degree of the surface layer H1(0.13–0.27; mean = 0.21), the balance degree of overall layerH2 (0.16–0.26; mean = 0.22), the balance degree of the surface layer A1 (0.22–0.55; mean = 0.37), and the balance degree of overall layer A2 (0.07–0.19; mean = 0.14). Yukiwakamaru showed the highest hardness of surface layer (H1), whereas that of Datemasayume showed the lowest value; furthermore, Nanatsuboshi A showed the highest hardness of the overall layer (H2), whereas that of Ginganoshizuku showed the lowest value. Yukiwakamaru showed the highest stickiness of the surface layer (S1), whereas that of Nanatsuboshi A showed the lowest value; furthermore, Ryunohitomi showed the highest stickiness of the overall layer (S2), whereas that of Hitomebore showed the lowest value. Datemasayume showed the highest balance degree of the surface layer H1, the balance degree of the surface layer A1, and the balance degree of overall layer A2, whereas those of Nanatsuboshi A showed the lowest values.
The low-amylose cultivars Datemasayume, Ryunohitomi, and Yumepirika had good eating qualities due to their low hardness and high stickiness, whereas that of Nanatsuboshi A had a low balance degree of surface layer and overall layer.
Sensory evaluation
As shown in , the 27 japonica rice samples in 2018 had values as follows: appearance (2.8–3.7 points; mean = 3.1 points), aroma (2.5–3.6 points; mean = 3.1 points), taste (2.7–3.9 points; mean = 3.2 points), hardness (1.3–3.4 points; mean = 2.7 points), stickiness (2.8–4.6 points; mean = 3.4 points), overall evaluation (2.9–3.8 points; mean = 3.3 points). Tuyahime C and Yumepirica A cultivars showed a high evaluation in appearance. Sagabiyori cultivar was the most highly evaluated in taste, whereas that of Akitakomachi cultivar was the lowest. Nanatsuboshi B cultivar was the hardest evaluation in hardness. Datemasayume cultivar was the most highly evaluated in stickiness, whereas that of hardness was the lowest. Yumepirika A and Sagabiyori cultivars showed a high evaluation in the overall evaluation, whereas that of Sasanishiki cultivar was the lowest.
Table 4. Result of sensory test of 27 japonica rice samples in 2018.
Correlation among AACs using starch or milled rice and pasting properties, physical properties and sensory evaluation
Significant correlations between the AACs using starch or milled rice and pasting properties are shown in . The AACs using starch from 27 japonica rice samples had a negative correlation with BD (r = −0.58) (p < 0.01), Pt (r = −0.46) (p < 0.05), Max/Fin ratios (r = −0.72) (p < 0.01) and Max/Min ratios (r = −0.79) (p < 0.01), and positive correlation with Mini. vis (r = 0.45) (p < 0.05), Final. vis (r = 0.66) (p < 0.01), SB (r = 0.71) (p < 0.01), Cons (r = 0.79) (p < 0.01) and SB/Con ratios (r = 0.81) (p < 0.01). Furthermore, the AACs using milled rice from 27 japonica rice samples had a negative correlation with Max/Fin ratios (r = −0.62) (p < 0.01) and Max/Min ratios (r = −0.67) (p < 0.01), and positive correlation with Mini. vis (r = 0.57) (p < 0.01), Final. vis (r = 0.72) (p < 0.01), SB (r = 0.52) (p < 0.01), Cons (r = 0.77) (p < 0.01) and SB/Con ratios (r = 0.69) (p < 0.01).
Table 5. Correlation among pasting properties, physical properties, sensory evaluation, and AACs using starch or milled rice flour from 27 japonica rice samples in 2018.
Thus, the AACs using starch from 27 japonica samples showed higher correlation with BD (1.6 -times), SB (1.4 -times), Pt (2.0 -times), Max/Fin ratios (1.2 -times), Max/Min ratios (1.2 -times), and SB/Cons ratios (1.2 times) than those using milled rice flour. On the other hand, the AACs using milled rice from 27 japonica samples showed a higher correlation with Mini. vis (1.3 -times), and Final. vis (1.1 -times) than those using starch.
Significant correlations between the AACs using starch or milled rice and physical properties are shown in . The AACs using starch from 27 japonica rice samples had a negative correlation with balance of H1 (r = −0.51) (p < 0.01), balance of A1 (r = −0.61) (p < 0.01) and balance of A2 (r = −0.55) (p < 0.01). Furthermore, the AACs using milled rice from 27 japonica rice samples had a negative correlation with balance of H1 (r = −0.43) (p < 0.05), balance of H2 (r = −0.49) (p < 0.01), balance of A1 (r = −0.58) (p < 0.01) and balance of A2 (r = −0.44) (p < 0.05), and positive correlation with overall stickiness (S2) (r = 0.49) (p < 0.05).
Thus, the AACs using starch from 27 japonica samples showed a higher correlation with balance of H1 (1.2 -times), balance of A1 (1.1 -times), and balance of A2 (1.3 -times) than those using milled rice flour. On the other hand, the AACs using milled rice from 27 japonica samples showed a higher correlation with overall stickiness (S2) (2.2 -times), and balance of H2 (1.4 -times) than those using starch.
Significant correlations between the AACs using starch or milled rice and sensory evaluation are shown in . The AACs using starch from 27 japonica rice samples had a negative correlation with stickiness (r = −0.41) (p < 0.05), and positive correlation with hardness (r = 0.57) (p < 0.01). Furthermore, the AACs using milled rice from 27 japonica rice samples had a positive correlation with hardness (r = 0.40) (p < 0.05).
Thus, the AACs using starch from 27 japonica samples showed a higher correlation with hardness (1.4 -times) and stickiness (1.8 -times) than those using milled rice flour.
We believe therefore that it may be advantageous to use starch sample to measure AACs vs milled rice samples.
Applications of the novel formula for estimating the AACs of starch from japonica rice cultivars using milled rice flours instead of using rice starch
Igarashi et al. [Citation16] reported a positive correlation between absorbance atλmax and AAC. And Inouchi et al. [Citation8] showed that SLC content of starch can be estimated on the basis ofλmax and the blue value of purified amylopectin and proposed the calibration formula of the apparent amylose content derived from the value of wavelength at maximum absorbance of iodine absorption spectra of unpolished brown rice [Citation38].
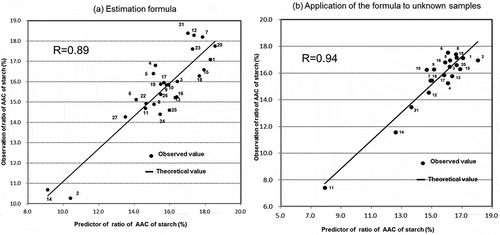
Although we reported that the iodine absorption curve differed among the various wide-range sample rice cultivars and developed the estimation formulae for AAC [Citation17], in the present paper, we propose the simple and rapid estimation method for AAC using milled rice flours instead of rice starch. The AACs using starch from 27 japonica rice samples positively correlated with AAC values (r = 0.77) (p < 0.01), λmax values (r = 0.89) (p < 0.01), Aλmax values (r = 0.50) (p < 0.01) of acquired using milled rice flour (). The color and λmax of the complex vary accordingly to the DP of the polymer chain, and λmax increases with the length of the glucan chain [Citation36]. The formula for estimating AACs of starch according to colorimetric analysis of milled rice was developed as follows: The AACs of starch were used as response variables and the analysis of the iodine absorption parameters of milled rice flour served as predictor variables in the multiple regression analyses. (a) shows the formula for estimating the AACs of starch according to the analysis of the iodine absorption parameters of milled rice flours. To reflect the properties of amylose as well as the effect of the chain length of amylopectin, we selected Aλmax as an indicator for the microstructure of amylopectin and λmax as an indicator of the chain length of amylose. The multiple regression coefficient was 0.89 for the calibration. The formula for estimating amylose content of starch was obtained using milled rice from 27 japonica rice samples (1, Akitakomachi;2, Datemasayume; 3, Ginganoshizuku; 4, Hatsushimo; 5, Hitomebore; 6, Ichihomare; 7, Kinumusume A; 8, Kinumusume B; 9, Koshihikari A; 10, Koshihikaei B; 11, Morinokumasan; 12, Nanatsuboshi A; 13, Nanatsuboshi B; 14, Ryunohitomi; 15, Sagabiyori; 16, Sasanishiki A; 17, Sasanishiki B, 18, Seitennohekireki A; 19, Seitennohekireki B; 20, Tsuyahime A; 21, Tsuyahime B; 22, Tsuyahime C, 23, Yukiwakamaru; 24, Yumeobako; 25, Yumepirika A; 26, Yumepirika B; 27, Yumeshizuku for calibration) were as follows:
Table 6. Correlation between results of analysis iodine absorption curve of starch and those using milled rice flour from 27 japonica rice in 2018.
Figure 1. Formula for estimating the AACs of starch from japonica rice cultivars based on the colorimetric analysis using milled rice flour and application of the estimation formula to unknown samples.

Among the predictor variables, λmax showed the highest partial regression coefficient. Although AAC can be estimated by only λmax in the case of rice samples covering wide range of starch properties, for example, low-amylose to high-amylose, use of three variables, λmax, Aλmax, and λmax/Aλmax, would be more effective to estimate AAC as shown in the formula above in the case of rice samples covering a narrow range of starch properties.
Thus, it was possible to estimate with higher accuracy the AAC values of milled rice flours in the place of rice starch.
(b) shows that a multiple regression coefficient of 0.94 was obtained using the formula to evaluate 21 unknown japonica rice samples in 2017. (1, Asahi; 2, Asahinoyume; 3, Akitakomachi; 4, Genkitsukushi; 5, Haenuki; 6, Hatsushimo; 7, Hinohikari; 8, Hitomebore; 9, Koshihikari A; 10, Koshihikari B; 11, Milky-queen; 12, Morinokumasan; 13, Nanatsuboshi; 14, Oborozuki; 15, Sagabiyori; 16, Sasanishiki; 17, Seitennohekireki; 18, Tentakaku; 19, Tsugaruroman; 20, Tsuyahime; 21, Yumepirika).
Table S1 shows the analysis of iodine absorption parameters using starch or milled rice flours from 21 japonica rice samples in 2017. Thus, the validation test shows that the equation is applicable to unknown samples. Furthermore, Table S2 shows the pasting properties of 21 japonica rice samples in 2017 and Table S3 shows the correlation between pasting properties and AACs using starch or milled rice flour from 21 japonica rice samples in 2017. As shown in , the estimated AAC values using milled rice flours from 27 japonica rice samples showed higher correlation with pasting properties of BD (1.6 -times), SB (1.2 -times), Pt (2.2 -times), Max/Min ratio (1.1 -times) and SB/Cons ratio (1.1 -times), physical properties of balance of H1(S1/H1) (1.3 -times), balance of A1(A3/A1) (1.1 -times) and balance of A2(A6/A4) (1.4 -times), sensory evaluation of hardness (1.3 -times) than those using milled rice flour. Furthermore, the estimated AAC values using milled rice flour from the 21 japonica rice samples showed higher correlation with BD (1.5 -times), SB (1.2 -times), Max/Fin ratios (1.1 -times), Max/Min ratios (1.1 – times), and SB/Cons ratios (1.1 -times) than those using milled rice flour (Table S3).
This analytical method will likely lead to the development of an easy, rapid, and accurate method for characterizing AACs using milled rice flour instead of rice starch.
Conclusions
Amylose is an unbranched 1,4 glucan and is one of the components of rice starch that greatly affects the quality and gelatinization properties of cooked rice.
We characterized 27 premium japonica rice samples and investigated the relationship among AACs (measured using starch or milled rice flour), pasting properties, and sensory evaluation. In general, starch granules are prepared from milled rice flours using the cold alkaline method, which needs 2–7 days and is labor-intensive. Here, we developed a novel estimation formula for the AACs of japonica rice cultivars according to the iodine absorption curves using milled rice flours as samples.
The AAC values measured using starch of 48 japonica rice samples were 1.2–1.3-times higher than those measured using milled rice flours, and the λmax and Aλmax were similar.
The AAC values using starch from 48 japonica rice samples correlated much better with pasting properties such as BD, SB, Max/Fin, Max/Min, and SB/Con ratios, than AAC values using milled rice flours.
The AAC values using starch from 27 japonica rice samples in 2018 significantly correlated with pasting properties, physical properties, and sensory evaluation better than AACs measured using milled rice flours.
By the use of our novel estimation formula, the determination coefficients (R) were 0.89 for calibration and 0.94 for validation of the estimation formula for AAC values of japonica rice cultivars.
The formula will likely make it possible to characterize the AAC easily, rapidly, and accurately using milled rice flours instead of rice starches.
Author contributions
S. Nakamura and K. Ohtsubo designed this research; S. Nakamura, H. Yamaguchi, and Y. Benitani did experiments; and S. Nakamura and K. Ohtsubo wrote the manuscript.
Supplemental_tableNakamura.pdf
Download PDF (296.2 KB)Disclosure statement
No potential conflict of interest was reported by the authors.
Supplementary material
Supplemental data for this article can be accessed here.
Additional information
Funding
References
- Ohtsubo K. Quality control rice post-harvest technology. Japan: The Food Agency MAFF; 1995.
- Juliano BO, Onate LU, Mundo AM. Relation of starch composition, protein content, and gelatinization temperature to cooking and eating qualities of milled rice. Food Technol. 1965;19:1006–1011.
- Okadome H, Kurihara M, Kusuda O, et al. Multiple measurements of physical properties of cooked rice grains with different nitrogenous fertilizers. Jpn J Crop Sci. 1999;68:211–216.
- Takeda Y, Hizukuri S, Juliano BO. Purification and structure of amylose from rice starch. Carbohydr Res. 1986;148:299–308.
- Takeda Y, Hizukuri S, Juliano BO. Structures of rice amylopectins with low and high affinity for iodine. Carbohydr Res. 1987;168:79–88.
- Inouchi N, Hibiu H, Li T, et al. Structure and properties of endosperm starches from cultivated rice of Asia and other countries. J Appl Glycosci. 2005;52:239–246.
- Asaoka M, Okuno K. Effect of environmental temperature at the milky stage on amylose content and fine structure of amylopectin of waxy and nonwaxy endosperm starches of rice. Agric Biol Chem. 1985;49:373–379.
- Inouchi N, Ando H, Asaoka M, et al. The effect of environmental temperature on distribution of unit chains of rice amylopectin. Starch/Strake. 2000;52:8–12.
- Adam A, Karen AKM, Anna MM, et al. Effect of growth location in the United States on amylose content, amylopectin fine structure, and thermal properties of starches of long grain rice cultivars. Cereal Chem. 2006;83:93–98.
- Umemoto T, Nakamura Y, Satoh H, et al. Differences in amylopectin structure between two rice varieties in relation to the effects of temperature during grain-filling. Starch/Starke. 1999;51:58–62.
- Okuda M, Hashizume K, Mumata K, et al. Changes in mean air temperature after heading and starch characteristics of rice grains for sake making among harvest years and areas. J Brew Soc Jpn. 2010;105:97–105.
- Williams VR, W -t W, Tsai HY, et al. Varietal differences in amylose content of rice starch. J Agr Food Chem. 1958;6:47–48.
- Juliani BO. A simplified assay for milled-rice amylose. Cereal Sci Today. 1971;12:334360.
- Inatsu O. Improvement of the quality of rice grown in Hokkaido. J Jpn Starch Sci. 1979;26:191–197.
- Sowbhagya CM, Bhattacharya KR. A simplified colorimetric method for determination of amylose content in rice. Staerke. 1971;23:53–56.
- Igarashi T, Yanagihara T, Kanda H, et al. Development of new eating quality evaluation method based on iodine adsorption multispectral analysis of rice flour. Jpn J Crop Sci. 2009;78:66–73.
- Nakamura S, Satoh H, Ohtsubo K. Development of formulae for estimating amylose content, amylopectin chain length distribution, and resistant starch content based on the iodine absorption curve of rice starch. Biosci Biotechnol Biochem. 2015;79:443–455.
- Yamamoto K, Sawada S, Onogaki I. Properties of rice starch prepared by alkali method with various conditions. J Jpn Soc Starch Sci. 1973;20:99–104.
- Yamamoto K, Sawada S, Onogaki I. Effects of quality and quantity of alkali solution on the properties of rice starch. Denpun Kagaku. 1981;28:241–244.
- Landers PS, Gbur EE, Sharp RN. Comparison of two methods to predict amylose concentration in rice flours as determined by spectrophotometric assay. Cereal Chem. 1991;68:545–548.
- Toyoshima H, Okadome H, Ohtsubo K. Cooperative test on the small-scale rapid method for the gelatinization properties test of rice flours with a rapid-visco-analyser (RVA). Nippon Shokuhin Kogakukaishi. 1997;44:579–584.
- Nakamura S, Katsura J, Kato K, et al. Development of formulae for estimating amylose content and resistant starch content based on the pasting properties measured by RVA of Japonica polished rice and starch. Biosci Biotechnol Biochem. 2016;80:329–340.
- Okadome H, Toyoshima H, Ohtsubo K. Multiple measurements of physical properties of individual cooked rice grains with a single apparatus. Cereal Chem. 1999;76:855–860.
- Nakamura S, Suzuki D, Kitazume R, et al. Quality evaluation of rice crackers based on physicochemical measurements. Biosci Biotechnol Biochem. 2012;76:794–804.
- Nakamura Y, Sakurai A, Inaba Y, et al. The fine structure of amylopectin in endosperm from Asian cultivated rice can be largely classified into two classes. Starch/Starke. 2002;54:117–131.
- Hizukuri S. Polymodal distribution of the chain lengths of amylopectins and its significance. Carbohydr Res. 1986;147:342–347.
- Taira H, Nakagahra M, Nagamine T. Fatty acid composition of indica, sinica, javanica, and japonica groups of nonglutinous brown rice. J Agr Food Chem. 1988;36:45–47.
- Juliano BO. Rice chemistry and quality. Munõs: Philippine Rice Reserch Institute (PhilRice) issuance publication; 2007. p. 112–129.
- Yamasaki M. Application of conjugated fatty acids to functional foods. Nippon Eiyo Shokuryo Gakkaishi. 2013;66:241–247.
- Mano Y, Kawaminami K, Kojima M, et al. Comparative composition of brown rice lipids (lipid fractions) of indica and japonica rice. Biosci Biotechnol Biochem. 1999;63:619–626.
- Bolling H, EI Baya AW. Effect of lipids on the determination of amylose content in rice and wheat. (In German, with English summary). CMTL Chem Mikrobiol Technol Lebensmi. 1975;3:61–163.
- Nakamura S, Katsura J, Maruyama Y, et al. Relationship between fatty acid composition and starch properties of 30 japonica rice cultivars. Cereal Chem. 2019;96:228–242.
- Morrison WR, Nasir AM. Variation in the amylose and lipid contents and some physical properties of rice starches. J Cereal Sci. 1987;5:35–44.
- Ohtsubo K, Toyoshima H, Okadome H. Quality assay of rice using traditional and novel tools. Cereal Foods World. 1998;43:203–206.
- Bhattacharya M, Zee SY, Corke H. Physicochemical properties related to quality of rice noodles. Cereal Chem. 1999;76:861–867.
- Yamada H, Sasagawa N, Kitazawa K. Relationship between gelatinization properties by an amylograph and expansion of rice crackers from new-characteristic rice (in Japanese). Nippon Shokuhin Kogakukaishi. 1993;40:278–286.
- Nakamura S, Cui J, Zhang X, et al. Comparison of eating quality and physicochemical properties between Japanese and Chinese rice cultivars. Biosci Biotechnol Biochem. 2016;80:2437–2449.
- Inouchi N, Ikeuchi N, Takami T, et al. Investigation of simple method measuring apparent amylose content of rice grains. Oyo Toshitsu Kagaku. J Appl Glycosci. 1996;43(1):1–5.