
 ?Mathematical formulae have been encoded as MathML and are displayed in this HTML version using MathJax in order to improve their display. Uncheck the box to turn MathJax off. This feature requires Javascript. Click on a formula to zoom.
ABSTRACT
Short chain fatty acids (SCFAs), the microbial metabolites of fermentable dietary fibers exert multiple beneficial effects on mammals including humans. We examined the effects of fermentable dietary fibers on suppressor of cytokine signaling 1 (SOCS1), a negative regulator of inflammatory signaling, on the intestinal epithelial cells of the mouse colon and human intestinal Caco-2 cells, specifically focusing on the role of SCFAs. Feeding fermentable fibers, guar gum (GG) and partially hydrolyzed GG (PHGG) increased SOCS1 expression in the colon and the cecal pool of some SCFAs including acetate, propionate, and butyrate. The antibiotic administration abolished the GG-mediated SOCS1 expression in the colon. In Caco-2 cells, butyrate, but not other SCFAs, increased SOCS1 expression. Taken together, fermentable fibers such as GG and PHGG upregulate the colonic SOCS1 expression, possibly through the increased production of butyrate in mice and can be a potential tool in the fight against inflammatory diseases.
Abbreviations: GG: Guar gum; GPR: G protein-coupled receptor; IL: Interleukin; JAK: Janus kinase; NF- κB: Nuclear factor-kappa B; PHGG: Partially hydrolyzed guar gum; SCFA: Short chain fatty acid; SOCS: Suppressor of cytokine signaling; STAT: Signal transducer and activator of transcription; TLR: Toll-like receptor.
Graphical abstract
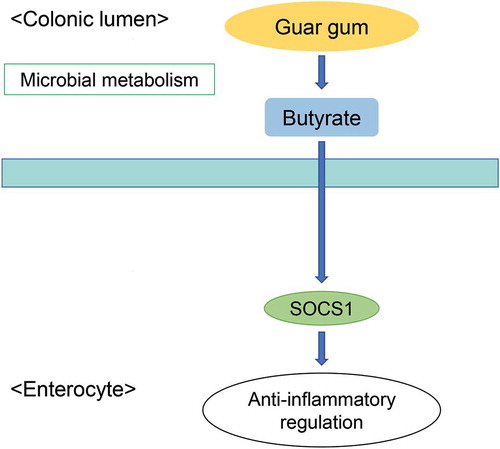
Butyrate produced from microbial metabolism of GG increases the SOCS1 protein in the colon.
Short chain fatty acids (SCFAs) are the main end products of intestinal microbial fermentation of non-digestible carbohydrates that escape enzymatic digestion in the small intestine. Most common ones are acetate, propionate, and butyrate which are found in abundance in the large intestine where bacteria are densely populated. These SCFAs modify several cellular processes, such as gene expression, differentiation, proliferation, chemotaxis, and apoptosis through different mechanisms including inhibition of histone deacetylase and activation of G protein-coupled receptors (GPRs). Butyrate is the preferred source of energy for colonocytes and is crucial for maintaining homeostasis of intestinal epithelium as it affects proliferation, apoptosis, and differentiation of these cells [Citation1]. On the other hand, acetate and propionate are mostly transported to the liver and peripheral tissues via the portal vein where they act as signaling molecules and regulate various biological processes [Citation2]. Several studies have documented the influence of SCFAs in intestinal homeostatic regulation. Macia et al. [Citation3] demonstrated that SCFAs through GPR43 and GPR109a activated an epithelial inflammasome which promoted conversion of pro-interleukin (IL)-18 to IL-18 thereby regulating inflammation. Butyrate through the GPR109a signaling facilitated anti-inflammation properties in macrophages and dendritic cells of the mouse colon and enabled them to induce differentiation of regulatory T cells and IL-10-producing T cells [Citation4]. In another study, oral supplementation of butyrate exhibited potency in attenuating colitis in vivo whereas in vitro, butyrate decreased proinflammatory cytokines tumor necrosis factor- α, IL-6 and IL-12 while upregulating IL-10 through reversal of histone acetylation and blocking nuclear factor-kappaB (NF-κB) pathway [Citation5]. However, the roles of SCFAs in the regulation of intestinal homeostasis are not fully understood.
Suppressor of cytokine signaling1 (SOCS1) is a member of a large superfamily of intracellular proteins that regulate cytokine signal transduction as negative feedback molecules. SOCS1 exerts its effect on Janus kinase (JAK)/signal transducers and activators of transcription (STAT) signaling pathway by directly inhibiting catalytic activity of JAK tyrosine kinase. The SOCS1 protein possesses a kinase inhibitory region, which functions as a pseudo-substrate and is essential for suppression of cytokine signaling [Citation6,Citation7]. A study reported that mice lacking SOCS1 developed a complex fatal neonatal disease and were hyperresponsive to viral infection typically induced by interferon γ [Citation8]. Kimura et al. [Citation9] showed that SOCS1 suppressed the lipopolysaccharide-induced IL-6 production by regulating the JAK/STAT pathway. In a murine model of colitis, SOCS1 is suggested to prevent the intestinal inflammation by inhibiting interferon γ/STAT1 pathway [Citation10]. Thus, SOCS1’s role as a physiological regulator of inflammation and maintenance of intestinal immune homeostasis cannot be neglected.
Accumulating evidence suggests that supplemental non-digestible carbohydrates such as dietary fibers have various beneficial effects on our health. Guar gum (GG) fiber, a water-soluble dietary fiber, is obtained from guar seeds, mainly composed of galactomannan, and characterized by high viscosity and high fermentability [Citation11]. Our previous study established that GG and partially hydrolyzed GG (PHGG) increased the luminal SCFAs production which in part may have contributed to suppression of inflammatory immune responses and reduced barrier defects in the colon of colitic mice [Citation12]. We also demonstrated that intact GG directly upregulated SOCS1 expression, regulating inflammatory responses in the small intestine through activation of toll-like receptor (TLR)-2 and dectin-1 signaling pathways [Citation13]. However, the regulation of the intestinal SOCS1 expression by GG was not validated in vivo so far. In addition, the effects of GG and the underlying mechanisms could differ between small and large intestines, because GG passes the small intestine with its intact structure but is easily metabolized by intestinal microorganisms in the colon. The present study investigated the effect of GG on SOCS1 expression in the small intestine and colon of healthy mice, specifically focusing on the role of SCFAs. PHGG was used to highlight the fermentability of fibers in the induction of SOCS1 in the colon. Furthermore, mice were administered with antibiotics to examine the role of microbial activity on SOCS1 expression in the colon. Finally, human intestinal Caco-2 cells were used to verify the impact of SCFAs on SOCS1 expression.
Methods and materials
Materials
Mouse anti-SOCS1 antibody (clone 4H1) was purchased from MERCK (Darmstadt, Germany). Horseradish peroxidase-conjugated anti-mouse IgG was purchased from SeraCare (Milford, MA, USA). Cell culture reagents and supplies were from Thermo Fisher Scientific Inc. (Waltham, MA, USA). GG and PHGG (Sunfiber®) were kindly provided by Taiyo Kagaku (Yokkaichi, Japan). PHGG (average molecular mass, 20 kDa) was prepared by treating GG fiber (average molecular mass, 300 kDa) with β-endo-galactomannase from a strain of Aspergillus niger. All other chemicals were obtained from FUJIFILM Wako Pure Chemical Corporation (Osaka, Japan).
Animals and diets
All study protocols were pre-approved by the Animal Use Committee of Hiroshima University, and all mice were maintained in accordance with the Hiroshima University guidelines for the care and use of laboratory animals (authorization no. C15-10-3). Male BALB/c mice (7-week-old, ~21 g) were obtained from Charles River Japan (Yokohama, Japan). Throughout the study, the mice were housed in cages (3 or 4 mice/cage) under the following conditions: controlled temperature of 22 ± 2°C; relative humidity of 40–60%; and light exposure from 08:00 to 20:00. The mice were allowed to acclimatize to the laboratory environment with free access to an AIN-93 G-formula control diet () and distilled water for 1 week prior to the start of the experiments.
Table 1. Composition of test diets(g/kg diet).
Experimental designs of animal studies
Three animal experiments (Expt.1, 2, and 3) were performed to examine the regulation of intestinal SOCS1 expression by GG. Expt.1 examined the effects of GG fiber on SOCS1 expression in the small intestine and colon of mice. Mice (n = 18) were randomly divided into three groups: control, 5% GG, 10% GG (n = 6 per group). The 5% and 10% GG groups were fed a diet containing 5% and 10% (w/w) GG fiber, respectively, for 14 d of the experimental period (). GG was added to the control diet by substitution for an equal amount of starch, since starch is the most abundant ingredient in the diet and the substitution does not influence the concentrations of other ingredients in the diet. The control group was fed the control diet during the experimental period.
Expt.2 examined the effects of GG and its hydrolyzate (PHGG) on SOCS1 expression in the small intestine and colon of mice. Mice (n = 18) were randomly divided into three groups: control, 10% PHGG, and 10% GG (n = 6 per group). The PHGG and GG groups were fed a diet containing 10% (w/w) PHGG and GG fibers, respectively, for 14 d of the experimental period (). PHGG and GG were added to the control diet by substitution for an equal amount of starch. The control group was fed the control diet during the experimental period.
Expt.3 examined the role of intestinal microbial activity in the GG-mediated promotion of SOCS1 in the colon. Mice (n = 24) were randomly divided into four groups: water+control, antibiotics+control, water+10% GG, and antibiotics+10% GG (n = 6 per group). The antibiotics+control and antibiotics+10% GG groups were administered with the antibiotic cocktail (vancomycin 500 mg/L, polymyxin B 200 mg/L, and neomycin 500 mg/L) via drinking water for 35 d of the experimental period. The water+control and water+10% GG groups received distilled water alone during the experimental period. After 21 d of antibiotic administration, the water+10% GG and antibiotics+10% GG groups were fed the diet with 10% GG for 14 d (), whereas, the water+control and antibiotics+control groups were fed the control diet.
At the end of experiments, mice were killed by exsanguination under isoflurane anesthesia. The small intestine (Expt. 1 and 2) and colon (all experiments) were collected and the epithelial cells were isolated as previously described [Citation14]. The isolated epithelial cells were subjected to immunoblot analysis of SOCS1 as described below. In all experiments, the cecum was collected for analyses of SCFAs as described below.
Cell culture studies
To examine roles of SCFAs on the regulation of SOCS1 expression, human intestinal Caco-2 cells (American Type Culture Collection, Manassas, VA, USA) were used. The Caco-2 cells were propagated and maintained under standard cell culture conditions in humidified incubator (atmosphere of 95% v/v air-5% CO2 at 37°C) in Dulbecco’s (high glucose) modified eagle medium supplemented with 10% fetal bovine serum. The cells were seeded in 24-well plates (Corning Coster Co., Kennebunk, ME, USA) at the density of 4.4 104 cells/cm2 and cultured for 14 d prior to experiments. Passage for cultures used were between 48 and 65 and the medium was refreshed every 3 days. The cells were incubated with or without acetate (20 and 40 mM), propionate (2.5 and 5 mM), n-butyrate (2.5 and 5 mM), iso-butyrate (0.15 and 0.3 mM), n-valerate (0.2 and 0.4 mM), and, iso-valerate (0.25 and 0.5 mM) for 24 h and subjected to the immunoblot analysis of SOCS1 as described below. The SCFA concentrations used were based on the physiological concentrations in the colon of mice and humans [Citation15,Citation16].
Immunoblotting
Isolated epithelial cells of the small intestine and colon were homogenized in appropriate volume of lysis buffer containing 1% (w/v) sodium dodecyl sulfate, 1% (v/v) Triton X-100, and 1% (w/v) sodium deoxycholate in 30 mM Tris with protease and phosphatase inhibitors (5 mg/L aprotinin, 3 mg/L leupeptin hemisulfate, 5 mM benzamidine hydrochloride, 1 mM phenylmethylsulfonyl fluoride, 25 mM glycerol-2-phosphate, 2 mM sodium orthovanadate, and 10 mM sodium fluoride, pH 7.4), by using a Polytron®-type homogenizer (KINEMATICA AG, Lucerne, Switzerland). The Caco-2 cells were lysed in 300 μL of the lysis buffer. Protein concentrations were measured using the Bicinchoninic acid assay (Pierce Biotechnology). Immunoblotting analysis of SOCS1 was performed as previously described [Citation13,Citation17] in which protein extracts were mixed with half volume of Laemmli sample buffer (3X concentrated) containing 6% (w/v) SDS, 30% (v/v) glycerol, 15% (v/v) 2-mercaptoethanol, and 0.02% (w/v) bromophenol blue in 188 mM Tris, (pH 6.8) and heated to 100°C for 5 min. Proteins (20 μg) were separated by SDS-PAGE and transferred to polyvinylidene difluoride membranes (Immobilon-P, MERCK). Blots were developed using the ECL chemiluminescence method (Amersham Imager 680, Uppsala, Sweden). The SOCS1 protein expression was normalized to total protein measurements on polyvinylidene difluoride membranes by Ponceau S [Citation18]. Quantification of protein expression was done by densitometric analysis of specific bands on the immunoblots using ImageJ software (NIH, Bethesda, MD, USA).
SCFA analysis
SCFAs in cecal contents were determined by ultra-performance liquid chromatography–mass spectrometry with minor modifications as described previously [Citation19]. Briefly, cecal contents were homogenized in 9X volumes of distilled water and centrifuged at 13, 000 g for 10 min at 4°C. The resulting supernatant was deproteinized with 50% (v/v) acetonitrile and incubated with 50 mM 3-nitrophenylhydrazine, 30 mM water-soluble carbodiimide, and 6% pyridine. The chemical derivatives of SCFAs were quantified by ultra-performance liquid chromatography–mass spectrometry (Waters, Milford, MA, USA).
Calculations and statistical analyses
Body weight gains of mice were calculated using the formula: body weight gain (mg/d) = (final body weight – initial body weight) (mg)/experimental period (d). Cecal tissue weights were shown as values standardized by body weight. All data are presented as the means and standard error of the means (SEM). Statistical analyses were performed by one-way ANOVA (Expt.1, Expt.2, and cell culture studies) or two-way ANOVA (Expt.3) followed by the Tukey-Kramer post-hoc test. Pearson correlation coefficients were calculated to assess the relationship between cecal SCFAs and colonic SOCS1 expression (Expt.1, 2, and 3). All statistical analyses were conducted with a significance level of α = 0.05 (P < 0.05) using Statcel 3 program (OMS Publishing, Saitama, Japan).
Results
Body parameters of mice in Expt.1
Feeding 5% and 10% GG for 14 d did not have an impact on body weight gain of mice (). However, the weights of cecal tissue and contents in the 5% and 10% GG groups were higher than those in the control group.
Table 2. Body weight gain, cecal tissue weight, and cecal content weight of mice in Expt.1.
Intestinal SOCS1 expression and cecal SCFAs pool of mice in Expt.1
Our previous study demonstrated that GG fiber increases the SOCS1 expression in the intestinal epithelial Caco-2 cells [Citation13], however, the regulation was not validated in vivo. In addition, GG is easily metabolized to mainly SCFAs by intestinal microbiota [Citation12]. We examined the effect of GG fiber in expression of intestinal SOCS1 and SCFAs production in healthy mice. GG fiber diet increased SOCS1 protein expression in epithelial cells of both the small intestine and colon (). In the small intestine, SOCS1 expression of 10% GG group was significantly higher than that in the control group, 1.26 0.09 and 1.00
0.03, respectively. In the colon, the SOCS1 expression of 5% and 10% GG groups was higher compared to the control group 1.34
0.05, 1.42
0.09, and 1.00
0.04, respectively. Cecal SCFAs pool of acetate, propionate, n-butyrate, and iso-valerate in the 5% and 10% GG groups were higher than those in the control group (). These changes were also observed on iso-butyrate in the 5% GG group compared to the control group.
Figure 1. SOCS1 expression in the small intestine and colon of mice fed the control, 5% GG, and 10% GG diets for 14 d. Protein expression of SOCS1 levels in the epithelial cells of small intestine (a) and colon (b) was determined by immunoblot analysis. The values are means ± SEM (n = 6). Means without a common letter differ (Tukey-Kramer post-hoc test, P < 0.05). AU, arbitrary unit.

Figure 2. SCFAs pool in the cecum of mice fed the control, 5% GG, and 10% GG diets for 14 d. The cecal SCFA was determined by ultra-performance liquid chromatography–mass spectrometry. The values are means ±SEM (n = 6). Means without a common letter differ (Tukey-Kramer post-hoc test, P < 0.05).

Body parameters of mice in Expt.2
PHGG is produced through the controlled partial enzymatic hydrolysis of GG. In Expt. 2, mice were fed the diets containing 10% PHGG and GG fiber for 14 d. Feeding the GG diet increased the weights of cecal tissue and contents in a manner similar to Expt.1 (). These values in the PHGG group were also higher than those in the control group, but there was no difference in the body weight gains among groups.
Table 3. Body weight gain, cecal tissue weight, and cecal content weight of mice in Expt.2.
Intestinal SOCS1 expression and cecal SCFAs pool of mice in Expt.2
Although PHGG is lower in molecular weight than GG, it is as fermentable as GG by the intestinal microbiota [Citation20]. In the small intestine, SOCS1 expression in the GG group, but not PHGG group, was higher than that in the control group ()), whereas, in the colon, the SOCS1 expression in both GG and PHGG groups was higher than that in the control group ()). Feeding PHGG as well as GG increased cecal pool of major SCFAs, acetate, propionate, and n-butyrate (), but the increment of propionate by PHGG was not statistically significant.
Figure 3. SOCS1 expression in the small intestine and colon of mice fed the control, 10% PHGG, and 10% GG diets for 14 d. Protein expression of SOCS1 levels in the epithelial cells of small intestine (a) and colon (b) was determined by immunoblot analysis. The values are means ± SEM (n = 6). Means without a common letter differ (Tukey-Kramer post-hoc test, P < 0.05). AU, arbitrary unit.

Figure 4. SCFAs pool in the cecum of mice fed the control, 10% PHGG, and 10% GG diets for 14 d. The cecal SCFA was determined by ultra-performance liquid chromatography–mass spectrometry. The values are means ±SEM (n = 6). Means without a common letter differ (Tukey-Kramer post-hoc test, P < 0.05).

Body parameters of mice in Expt.3
To examine the role of intestinal microbial activity in the GG-mediated effect, mice were administered the antibiotics in Expt. 3. According to the results of 2-way ANOVA, the antibiotic administration negatively influenced the body weight gain of mice (). However, no pathological sign, in terms of abnormal depilation and general behavioral changes in activity was observed in these mice throughout the experimental period. The weights of cecal contents and cecal tissue in the antibiotics+10% GG group were higher than those in the water+control group although the effect of GG was insignificant on weight of cecal tissue (P = 0.07, 2-way ANOVA). It was also noted that there was no interaction effect between the GG feeding and antibiotic administration in these parameters.
Table 4. Body weight gain, cecal tissue weight, and cecal content weight of mice in Expt.3.
Colonic SOCS1 expression and cecal SCFAs pool of mice in Expt. 3
The antibiotic administration and 10% GG feeding negatively and positively influenced the colonic SOCS1 expression, respectively, based on the 2-way ANOVA (). Upregulation of the colonic SOCS1 expression by 10% GG was observed in mice without antibiotic administration in a similar manner to Expt. 1 and 2. The antibiotic administration completely abolished the upregulation by GG and the SOCS1 expression in the antibiotics+10% GG group was lower than that in the water+10% GG group. In the absence of antibiotic administration, feeding 10% GG increased the cecal pool of SCFAs in a manner similar to Expt.1 and 2: the SCFA pool of acetate, propionate, n-butyrate, and iso-valerate in the water+10% GG group were higher than those in the water+control group (). The 2-way ANOVA detected the significant effect of antibiotics on the pool of all SCFAs, indicating that the antibiotic administration suppressed the cecal microbial activity and SCFA production in both the antibiotics+water and antibiotics+10% GG groups. The significant interaction between the antibiotic administration and GG feeding were observed in acetate, propionate, and n-butyrate, because the antibiotic administration depleted these SCFAs irrespective of diets provided.
Figure 5. SOCS1 expression in the colon of mice administered water or antibiotics and supplemented with or without GG for 14 d. Expression of SOCS1 levels in the colon was determined by immunoblot analysis. The values are means ± SEM (n = 6). Means without a common letter differ (Tukey-Kramer post-hoc test, P < 0.05). AU, arbitrary unit.

Figure 6. SCFAs pool in the cecum of mice administered water or antibiotics and supplemented with or without GG for 14 d. The cecal SCFA was determined by ultra-performance liquid chromatography–mass spectrometry. The values are means ±SEM (n = 6). Means without a common letter differ (Tukey-Kramer post-hoc test, P < 0.05).

Correlation between colonic SOCS1 expression and cecal SCFA production in Expt. 1, 2, and 3
To consider the role of SCFAs production in the regulation of the colonic SOCS1 expression, Pearson correlation coefficients between cecal SCFAs pool and colonic SOCS1 expression of all mice were calculated in Expt.1, 2, and 3 (). The three major SCFAs significantly and positively correlated with SOCS1 expression in Expt. 1; acetate (r = 0.71, P < 0.01), propionate (r = 0.88, P < 0.01), n-butyrate (r = 0.67, P < 0.01) and Expt. 3; acetate (r = 0.76, P < 0.01), propionate (r = 0.76, P < 0.01), n-butyrate (r = 0.9, P < 0.01). In Expt. 2, only acetate (r = 0.0.55, P < 0.05), and n-butyrate (r = 0.51, P < 0.05) showed significant positive correlation with SOCS1 expression. These observations suggest that aforementioned SCFAs could be involved in the upregulation of SOCS1 protein. Although iso-valerate positively correlated with SOCS1 protein expression in Expt. 1 and 3, it negatively correlated with the protein expression in Expt. 2. The reason for this result is not clear, but minor variations in condition of animals in the three experiments may have contributed to the inconsistent results.
Table 5. Correlation between colonic SOCS1 expression and cecal SCFAs pool in mice.
Effect of organic acids on SOCS1 expression in Caco-2 cells
Because of the correlations between colonic SOCS1 expression and some SCFAs production, we examined the effect of individual SCFAs on SOCS1 expression in intestinal Caco-2 cells. The SOCS1 expression of cells incubated with 5 mM n-butyrate was higher than that in the control cells, whereas, effects of other SCFAs were not evident as far as SOCS1 expression was concerned ().
Figure 7. SOCS1 expression of in Caco-2 cells treated with individual SCFAs for 24 h. Expression of SOCS1 levels were determined by immunoblot analysis. The values are means ± SEM (n = 4). Means without a common letter differ (Tukey-Kramer post-hoc test, P < 0.05). AU, arbitrary unit.

Discussion
An interplay between dietary fibers and intestinal microflora has been accorded particular attention in recent years. In particular, physiological roles of SCFAs, the major metabolites of dietary fibers, have been actively investigated due to their purported roles in host-microbiota communication involving modulation of host immune system and metabolism [Citation1,Citation2,Citation21,Citation22]. Our research group previously reported that GG fiber could induce anti-inflammatory response and enhance barrier integrity in the colon of colitic mice with the effect being attributed to SCFAs [Citation12]. Although intact GG has been shown to regulate inflammation in the small intestine in which SOCS1 takes part [Citation13], information about the influence of dietary fibers on the colonic SOCS1 expression was totally unknown. Our results in mice and intestinal Caco-2 cells demonstrate that butyrate, one of the major SCFAs, produced from microbial metabolism of fermentable fibers, has the potential to induce the SOCS1 expression in the colon.
An important result of this study is the increased expression of SOCS1 in the colon by both PHGG and GG diets. The molecular weight of PHGG is reduced in size by one-tenth through the enzymatic hydrolysis of GG using β-endo-galactomannanase but are both highly fermentable by intestinal microorganisms [Citation20]. Furthermore, the antibiotic administration abolished the GG-mediated SOCS1 expression in the colon (). This evidence strongly suggests that the microbial fermentation is involved in the increased colonic SOCS1 expression by GG. Consumption of fiber-rich diets modifies gut microbiota composition and metabolism by stimulating the growth and activity of beneficial protective bacteria and subsequently host physiology. The physiological effects of the fiber-rich diets are often associated with the increased production of SCFAs through microbial fermentation. Acetate, propionate, and butyrate dominate the SCFAs pool in the colon [Citation23]. Indeed, feeding fermentable fibers, GG and PHGG, increased the growth and activity of intestinal bacteria, leading to increase in SCFAs production, expansion of cecal contents, and cecal tissue. We also found a positive correlation between the three individual SCFAs and the colonic SOCS1 expression in the animal experiments (). However, only butyrate successfully induced the SOCS1 expression in the Caco-2 cells (). Although butyrate is known to exert various physiological effects in the colonic epithelium, such as enhancement of barrier integrity, regulation of cell growth and death, and induction of mucous production [Citation5,Citation24], our result shed a new light on the physiological functions of butyrate.
In agreement with our previous study using intestinal Caco-2 cells, supplemental GG, but not its hydrolyzate, PHGG, induced SOCS1 expression in the small intestine of mice ()). The intestinal Caco-2 cells can directly recognize the specific structure of GG, but not PHGG, through TLR-2 and dectin-1 and induce SOCS1 expression [Citation13]. It is likely that the GG-mediated SOCS1 expression in the small intestine of mice occurs through such mechanism. However, the luminal concentration of the intact GG may matter, hence no effect on SOCS1 expression was evident in mice fed 5% GG diet. On the contrary, both 5% and 10% GG diets increased the SOCS1 expression in a similar manner in the colon (). This evidence may suggest that supplemental GG can induce SOCS1 expression more effectively in the colon than the small intestine even at low dietary levels.
A healthy gut microbiota is prime for maturation and development of the immune system [Citation25]. A study showed that a low-fiber diet reduced microbial diversity and subsequently SCFAs yield as microbial metabolism shifted toward utilization of dietary and endogenously supplied proteins and mucins thereby damaging colonic mucus barrier and increasing pathogen susceptibility [Citation26]. Although microbial composition and production of SCFAs rely on diet as a major determinant, host genetic background and other environmental factors influence microbial community [Citation27]. Our study showed that the antibiotic administration suppressed the SOCS1 expression in the colon of mice fed the control diet as well as the GG diet. However, it should be noted that the substantial SOCS1 expression in the colon was still observed when the antibiotic administration depleted the cecal SCFAs pool (). This indicates that the intestinal microbial activity and possibly butyrate in part contributed to maintaining the basal SOCS1 expression in mice fed the control diet. It seems the colonic SOCS1 expression is regulated by endogenous mechanisms as well as intestinal microbial activity.
Intestinal epithelium continuously faces the luminal noxious molecules, including microbes and antigens that could trigger inflammatory response [Citation28]. For instance, lipopolysaccharides stimulate the TLR4-mediated proinflammatory cascade which activates a transcription factor, NF-κB, leading to the mucosal inflammation orchestrated by cytokines [Citation29]. SOCS1 functions as the negative regulator of cellular inflammatory reaction and its deficiency leads to hyperactivation of transcriptional factors such as STAT1, STAT3, and NF-κB [Citation30]. In a murine model of colitis, the SOCS1 heterozygous mice had more severe colitis compared to wild-type mice [Citation10], indicating the preventive roles of SOCS1 in the intestinal inflammation. Moreover, in a clinical study, low SOCS1 expression is considered a poor prognostic indicator in gastric cancer [Citation31]. Although butyrate often exerts its physiological effects through inhibition of histone deacetylase and activation of G protein-coupled receptors, it is not fully known which mechanism is employed by butyrate in upregulating SOCS1 in the colon [Citation3–Citation5]. As such, there is a need for more studies to fully elucidate the mechanism of the butyrate-mediated upregulation of SOCS1. However, it is indisputable that the regulation of intestinal SOCS1 by dietary components such as GG could be a novel preventive approach for the intestinal inflammation.
Feeding GG slightly increased the SOCS1 expression in the colon of mice administered antibiotics although the increment was not statistically significant according to the Tukey-Kramer post-hoc test. We speculate that this increment occurred by intact GG, because the antibiotics reduced the microbial activity, resulting in the increased intact GG in the colon. In addition, we did not examine the other isoforms of SOCSs such as SOCS2 and SOCS3. Although only a few studies provide a direct insight into roles of other SOCS isoforms in the intestinal inflammation, SOCS3 seems to function in intestinal epithelial cells. Yong et al. [Citation32] demonstrated that SOCS3, but not SOCS4, negatively regulated the activity of NF-κB via degradation of MyD88-adapter-like protein in porcine intestinal cells. SOCS3 also influenced the proliferation of intestinal epithelial cells [Citation33]. Further studies are required to understand the roles of SCFAs in the regulation of other SOCS isoforms.
Our study demonstrated that feeding mice with GG fiber increased SCFAs production, consequently increasing SOCS1 expression in the colon. Using human intestinal Caco-2 cells revealed butyrate as a possible candidate involved in the upregulation of SOCS1. Furthermore, the dysbiosis of intestinal microflora by antibiotic administration, which decreased SCFAs production, induced a suppression of SOCS1 in the colon. Since SOCS1 targets proinflammatory cytokines that lead to inflammatory diseases, dietary interventions that increase intracellular levels of SOCS1 protein may be an alternative approach in the fight against inflammatory diseases.
Author contributions
Gertrude Cynthia Sitolo, Aya Mitarai, and Takuya Suzuki designed the research, conducted the study, and performed statistical analyses. Gertrude Cynthia Sitolo, Aya Mitarai., Yoshinari Yamamoto, Precious Adedayo Adesina, and Takuya Suzuki analyzed the data. Gertrude Cynthia Sitolo and Takuya Suzuki wrote the manuscript. Takuya Suzuki has primary responsibility for the final content. All authors have read and approved the final manuscript.
Disclosure statement
No potential conflict of interest was reported by the authors.
Additional information
Funding
References
- Koh A, De Vadder F, Kovatcheva-Datchary P, et al. From dietary fiber to host physiology: short-chain fatty acids as key bacterial metabolites. Cell. 2016;165(6):1332–1345.
- Corrêa‐Oliveira R, Fachi J, Vieira A, et al. Regulation of immune cell function by short‐chain fatty acids. Clin Transl Immunology. 2016;5(4):e73.
- Macia L, Tan J, Vieira AT, et al. Metabolite-sensing receptors GPR43 and GPR109A facilitate dietary fibre-induced gut homeostasis through regulation of the inflammasome. Nat Commun. 2015;6:6734.
- Singh N, Gurav A, Sivaprakasam S, et al. Activation of Gpr109a, receptor for niacin and the commensal metabolite butyrate, suppresses colonic inflammation and carcinogenesis. Immunity. 2014;40(1):128–139.
- Lee C, Kim B, Kim J, et al. Sodium butyrate inhibits the NF-kappa B signaling pathway and histone deacetylation and attenuates experimental colitis in an IL-10 independent manner. Int Immunopharmacol. 2017;51:47–56.
- Krebs D, Hilton D. SOCS: physiological suppressors of cytokine signaling. J Cell Sci. 2000;113(16):2813–2819.
- Yoshimura A, Suzuki M, Sakaguchi R, et al. SOCS, inflammation, and autoimmunity. Front Immunol. 2012;3:20–31.
- Alexander W, Starr R, Fenner J, et al. SOCS1 is a critical inhibitor of interferon γ signaling and prevents the potentially fatal neonatal actions of this cytokine. Cell. 1999;98(5):597–608.
- Kimura A, Naka T, Muta T, et al. Suppressor of cytokine signaling-1 selectively inhibits LPS-induced IL-6 production by regulating JAK–STAT. Proc Nat Acad Sci. 2005;102(47):17089–17094.
- Horino J, Fujimoto M, Terabe F, et al. Suppressor of cytokine signaling-1 ameliorates dextran sulfate sodium-induced colitis in mice. Int Immunol. 2008;20(6):753–762.
- Yoon S, Chu D, Juneja L. Chemical and physical properties, safety and application of partially hydrolized guar gum as dietary fiber. J Clin Biochem Nutr. 2008;42(1):1–7.
- Hung T, Suzuki T. Dietary fermentable fiber reduces intestinal barrier defects and inflammation in colitic mice. J Nutr. 2016;146(10):1970–1979.
- Hung T, Suzuki T. Guar gum fiber increases suppressor of cytokine signaling‐1 expression via toll‐like receptor 2 and dectin‐1 pathways, regulating inflammatory response in small intestinal epithelial cells. Mol Nutr Food Res. 2017;61(10):1700048.
- Hung TV, Suzuki T. Dietary fermentable fibers attenuate chronic kidney disease in mice by protecting the intestinal barrier. J Nutr. 2018;148(4):552–561.
- Hu J, Nie S, Min F, et al. Polysaccharide from seeds of Plantago asiatica L. increases short-chain fatty acid production and fecal moisture along with lowering pH in mouse colon. J Agric Food Chem. 2012;60(46):11525–11532.
- Cummings J, Pomare EW, Branch WJ, et al. Short chain fatty acids in human large intestine, portal, hepatic and venous blood. Gut. 1987;28(10):1221–1227.
- Azuma T, Shigeshiro M, Kodama M, et al. Supplemental naringenin prevents intestinal barrier defects and inflammation in colitic mice. J Nutr. 2013;143(6):827–834.
- Gilda JE, Gomes AV. Stain-Free total protein staining is a superior loading control to β-actin for Western blots. Anal Biochem. 2013;440(2):186–188.
- Kurose Y, Minami J, Sen A, et al. Bioactive factors secreted by Bifidobacterium breve B-3 enhance barrier function in human intestinal Caco-2 cells. Benef Microbes. 2019;10(1):89–100.
- Stewart ML, Slavin JL. Molecular weight of guar gum affects short‐chain fatty acid profile in model intestinal fermentation. Mol Nutr Food Res. 2006;50(10):971–976.
- Deehan E, Duar R, Armet A, et al. Modulation of the gastrointestinal microbiome with nondigestible fermentable carbohydrates to improve human health. Microbial Spec. 2017;5(5):BAD–0019.
- Suzuki T. Regulation of the intestinal barrier by nutrients: the role of tight junctions. Animal Sci J. 2020;91(1):e13357.
- Makki K, Deehan EC, Walter J, et al. The impact of dietary fiber on gut microbiota in host health and disease. Cell Host Microbe. 2018;23(6):705–715.
- Fachi JL, de Souza Felipe J, Pral LP, et al. Butyrate protects mice from Clostridium difficile-induced colitis through an HIF-1-dependent mechanism. Cell Rep. 2019;27(3):750–761.
- Smith P, Garrett W. The gut microbiota and mucosal T cells. Front Microbiol. 2011;2:111.
- Desai M, Seekatz A, Koropatkin N, et al. A dietary fiber-deprived gut microbiota degrades the colonic mucus barrier and enhances pathogen susceptibility. Cell. 2016;167(5):1339–1353.
- Holscher H. Dietary fiber and prebiotics and the gastrointestinal microbiota. Gut Microbes. 2017;8(2):172–184.
- Suzuki T. Regulation of intestinal epithelial permeability by tight junctions. Cell Mol Life Sci. 2013;70(4):631–659.
- Manco M, Putignani L, Bottazzo G. Gut microbiota, lipopolysaccharides, and innate immunity in the pathogenesis of obesity and cardiovascular risk. Endocr Rev. 2010;31(6):817–844.
- Takahashi R, Nishimoto S, Muto G, et al. SOCS1 is essential for regulatory T cell functions by preventing loss of Foxp3 expression as well as IFN-γ and IL-17A production. J Exp Med. 2011;208(10):2055–2067.
- Li G, Xu J, Wang Z, et al. Low expression of SOCS-1 and SOCS-3 is a poor prognostic indicator for gastric cancer patients. J Cancer Res Clin Oncol. 2015;141(3):443–452.
- Yong YH, Wang P, Jia RM, et al. SOCS3 control the activity of NF-κB induced by HSP70 via degradation of MyD88-adapter-like protein (Mal) in IPEC-J2 cells. Int J Hyperthermia. 2019;36(1):151–159.
- Thagia I, Shaw EJ, Smith E, et al. Intestinal epithelial suppressor of cytokine signaling 3 enhances microbial-induced inflammatory tumor necrosis factor-α, contributing to epithelial barrier dysfunction. Am J Physiol Gastrointest Liver Physiol. 2015;308(1):G25–31.