
ABSTRACT
The pancreatic β-cell death or dysfunction induced by oxidative stress plays an important effect on the development and progression of diabetes mellitus. Based on our previous findings, a natural proteoglycan extracted from Ganoderma Lucidum, named FYGL, could treat T2DM in vivo. In this study, we investigated the effects of FYGL on STZ‐induced apoptosis of INS-1 cells and its underlying mechanisms. The results showed that FYGL significantly improved the cell viability and alleviated the apoptosis in STZ‐treated INS‐1 cells. Moreover, FYGL markedly decreased the intracellular ROS accumulation and NO release, and deactivated NF-κB, JNK, and p38 MAPK signaling pathways in STZ-induced INS-1 cells. Furthermore, FYGL improved the insulin secretion through inhibiting the activation of JNK and improving the expression of Pdx-1 in INS-1 cells damaged by STZ. These results indicated that FYGL could protect pancreatic β-cells against apoptosis and dysfunction, and be used as a promising pharmacological medicine for diabetes management.
Abbreviations: T2DM: type 2 diabetes mellitus; FYGL: Fudan-Yueyang G. lucidum; ROS: reactive oxygen species; NO: reactive oxygen species; NF-κB: nuclear factor kappa beta; JNK: c-jun N-terminal kinase; MAPK: mitogen-activated protein kinase; Pdx-1: Pancreatic duodenal homeobox 1
Graphical abstract
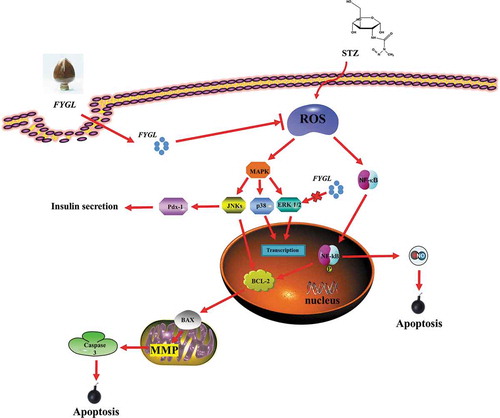
The protection mechanism of FYGL in STZ-induced INS-1 cells. Briefly, FYGL could protect INS-1 cells via inhibiting oxidative stress and regulating NF-κB/MAPK pathways.
Diabetes mellitus (DM) is a metabolic disorder which has become a major health problem in the world [Citation1,Citation2]. Type 2 diabetes mellitus (T2DM), characterized by dysfunction of pancreatic β-cells and chronic insulin resistance, is the most common type of DM [Citation1]. It is well known that pancreatic β-cells play an important role in insulin secretion for control of blood glucose levels. The apoptosis of pancreatic β‐cells results in the dysfunction of pancreatic islet, and thus lead to the increased level of blood glucose [Citation3]. Studies have demonstrated that hyperglycemia can reversely induce beta cell apoptosis through oxidative stress [Citation4], which damages the pancreatic β-cells easily. Hyperglycemia can induce the production of ROS through various mechanisms [Citation5]. Persistent high level of ROS results in the oxidative stress, causing the critical damage of beta cells [Citation5,Citation6]. Based on these studies, finding an efficient antioxidant agent to reduce oxidative stress, and thus preserve β-cell function is very important.
Ganoderma lucidum (G. lucidum) is one of the herbals widely used for immunomodulation, antitumor, and antioxidant [Citation7], and has also been reported to prevent T2DM and human metabolism dysregulations [Citation8]. Previously, we have successfully extracted a hypoglycemic ingredient, named FYGL (Fudan-Yueyang G. lucidum), from G. lucidum fruit body [Citation9] and demonstrated that FYGL contain dominantly a macromolecular hyperbranched proteoglycan with molecular weight of 2.6 × 10⁵, its main sequence characterized by NMR is shown in [Citation10]. FYGL, consisting of hydrophilic polysaccharides and lipophilic protein moieties with ratio of 77:17, is an amphiphilic compound [Citation10]. Previous studies have shown that FYGL can decrease the plasma glucose value and serum insulin concentration in vivo [Citation11,Citation12], indicating that FYGL could be absorbed in the blood. However, whether FYGL can protect pancreatic β‐cells in diabetes remains unclear.
Figure 1. The dominant sequence of FYGL characterized by NMR. Rs represent the carbohydrate residues of →2,4)-α-L-Rhap-(1→, →6)-β-D-Galp-1→, Araf-(1→ or →3,6)-β-D-Galp-(1→. Protein motifs are covalently bonded with carbohydrate motifs by Ser and Thr residues in -O- linkage [Citation10]
![Figure 1. The dominant sequence of FYGL characterized by NMR. Rs represent the carbohydrate residues of →2,4)-α-L-Rhap-(1→, →6)-β-D-Galp-1→, Araf-(1→ or →3,6)-β-D-Galp-(1→. Protein motifs are covalently bonded with carbohydrate motifs by Ser and Thr residues in -O- linkage [Citation10]](/cms/asset/29d37ef3-3179-4a5f-b7ab-dec351a1e81d/tbbb_a_1805718_f0001_b.gif)
In this study, we tried to figure out the effect of FYGL on pancreatic beta cells. We used streptozotocin (STZ), a chemical agent used for building DM model both in vivo and in vitro, to induce pancreatic beta cell apoptosis and dysfunction. In order to explore whether the apoptosis and dysfunction of pancreatic beta-cells induced by STZ could be attenuated by FYGL, we used CCK-8 assay to evaluate the cell viability, and flow cytometry to analyze the cell apoptosis for STZ-induced INS-1 cells. Furthermore, we investigated the underlying mechanisms of FYGL. We demonstrated that FYGL could protect the INS-1 cells against the oxidative stress caused by reactive oxygen species (ROS) through the pathways of p38 MAPK (mitogen-activated protein kinase), JNK (c-jun N-terminal kinase), NF-κB (nuclear factor kappa beta), and Pdx-1 (pancreatic duodenal homeobox 1).
Materials and methods
Materials
Fetal bovine serum (FBS), Roswell Park Memorial Institute-1640 (RPMI-1640), 0.05% trypsin, L-glutamine, and penicillin/streptomycin antibiotics, sodium pyruvate and 4-(2-hydroxyethyl)-1-piperazineethanesulfonic acid (HEPES) were purchased from Gibco (Grand Island, NY, USA). β-mercaptoethanol was purchased from Sigma (USA). Fluorescein isothiocyanate (FITC) was obtained from Aladdin Co. Ltd (Shanghai, China). Radio immunoprecipitation assay (RIPA) buffer, 0.01% poly-L-lysine, paraformaldehyde, Triton X-100, DCFH-DA, Rat Insulin ELISA Kit (Ultrasensitive), Nitric oxide detection kit were purchased from Beyotime Co. Ltd. (Shanghai, China). 4ʹ,6-Diamidino-2-phenylindole (DAPI), rhodamine-labeled phalloidin, streptozotocin (STZ), Cell Counting Kit-8 (CCK-8) were provided by Yeasen Co. Ltd. (Shanghai, China). The antibodies of p65, p-p65(S536), p38, p-p38(T180/T182), cleaved caspase-3, Bax, GAPDH, anti-rabbit IgG (H + L), horseradish peroxidase (HRP) labeled secondary antibody were purchased from Cell Signaling Technology (CST, Beverly, MA, USA). The antibodies of ERK1/2 (ERK1 and ERK2), p-ERK1/2(T202/T185), JNK1/2/3 (JNK1, JNK2, and JNK3), p-JNK1/2/3(T183/T183/T211), Pdx-1, were purchased from Abcam (Cambridge, MA, USA). The antibodies of Bcl-2 were purchased from BOSTER Co. Ltd. (Wuhan, China). Fruiting bodies of Ganoderma lucidum grown in north-eastern China were purchased from Leiyunshang Pharmaceutical Co. Ltd. (Shanghai, China). Preparation of FYGL was described in our previous work [Citation9].
Cell culture
INS-1 rat insulinoma beta cells (FuHeng Biology Co. Ltd, Shanghai, China), were cultured in RPMI-1640 medium supplemented with 10% FBS, 2 mmol/L l-glutamine, 1 mmol/L sodium pyruvate, 10 mmol/L HEPES,50 μmol/L mercaptoethanol, 100 U/mL penicillin, and 100 g/mL streptomycin, at 37°C in a humidified (5% CO2, 95% air) atmosphere. Cells of passages 3–5 were used in experiments.
The absorption of FYGL in INS-1 cells
Dissolving 3 mg FITC in 0.3 mL DMSO to prepare a FITC solution with a concentration of 10 mg/mL, and then the solution was diluted to 1 mg/mL with sodium buffer (SB). 10 mg FYGL was dissolved in 10 mL SB to form 1 mg/mL FYGL solution, which was mixed with the diluted FITC solution at a volume ratio of 10:1. The mixture was stirred at low temperature (ice bath) overnight. After the coupling reaction, the solution was dialyzed by 1 kDa dialysis bag. INS-1 cells were seeded on microscope cover glass slides in a 12-well plates at a density of 1 × 10⁴ per well and were incubated with FITC–FYGL (200 μg/mL) for 4 h. Nuclei and F-actin of INS-1 cells were stained by DAPI and Phalloidin-TRITC. Cell images were captured with a C2+ laser scanning confocal microscope (Nikon, Japan). Moreover, INS-1 cells were also treated with indicated concentrations of FITC–FYGL (0, 25, 50, 100, 200 μg/mL) for 4 h, and then the fluorescence intensity was analyzed via flow cytometry.
Cell viability assay
Cell viability was determined by Cell Counting Kit-8 (CCK-8) assay. Briefly, INS-1 cells were plated into 96-well plates at a density of 1 × 10⁴ cells per well and incubated to near confluence. Some cells were incubated with different concentrations of FYGL (0, 50, 100, 200, 500, and 1000 μg/mL) for 24 h. Other cells were pre-treated with FYGL at 0, 50, 100, 200, 500, and 1000 μg/mL for 4 h, and then the cells were incubated with STZ (0.3 mmol/L) and FYGL for an additional 24 h. After removing the cell supernatant, added 10 μL CCK-8 into each well, and then incubated for another 1 h at 37°C. Using a microplate reader (Bio-Tek, USA) to measure the optical density (OD).
Cell apoptosis assay
INS-1 cells (1 × 10⁶ cells per well) were cultured in 6-well plates, and pre-treated with indicated concentrations FYGL for 4 h, then the cells were cultured with STZ (0.3 mM) and different concentrations of FYGL for an additional 24 h. After treatment, cells were digested with 0.05% trypsin and washed twice with pre-cooled PBS. Then, the cell suspension (500 μL), mixed with 5 µL of annexin-V and 5 µL of PI, was incubated in the dark for 15 min at low temperature (ice bath). The percentage of apoptotic cells were analyzed by flow cytometry (Gallios, Beckman Coulter, USA).
Intracellular reactive oxygen species (ROS) assay
DCFH-DA (dichlorofluorescein-diacetate) was used to detect ROS generation. This dye diffused into the cells swiftly and was cleaved by esterases to form DCFH. DCFH was oxidized by hydrogen peroxide into a fluorescent product of DCH.INS-1 cells were plated into 6-well plates at a density of 5 × 10⁵ cells per well. After different treatments (as described above), cells were incubated with DCFH-DA at 37°C for 20 min. Then, the cell suspension was analyzed by flow cytometry.
Assay to measure Nitric Oxide (NO) levels
Griess reagent (0.1% N-(1-naphthyl)-ethylenediamine and 1% sulfanilamide in 5% phosphoric acid) was usually used to detect the NO levels. INS-1 cells were seeded into 96-well plates and incubated for 24 h. After pre-incubated with FYGL for 4 h, cells were treated with STZ (0.3 mmol/L) and FYGL for an additional 24 h. Then, collected 50 µL cell culture supernatant, the mixture mixed with equal volume of Griess reagent and the cell culture supernatant was incubated at room temperature for 10 min. Using a microplate absorbance reader to measure the absorbance at 550 nm. Sodium nitrite was used as a standard to determine the nitric oxide content.
Insulin assay
Cells were incubated in 24-well plates at a density of 1 × 10⁵ cells per well. After different treatments, INS-1 cells were washed twice with PBS (pH 7.4), and then incubated with HBSS (138 mM NaCl, 5.33 mM KCl, 4.17 mM NaHCO3, 0.441 mM KH2PO4, 0.338 mM Na2HPO4, 5.60 mM D-Glucose) containing 5.6 mmol/L or 16.7 mmol/L glucose for 1 h at 37°C, respectively. Then, the cell supernatant was collected to analyze the insulin content through a rat ELISA (insulin enzyme-linked immunosorbent assay) kit.
Western blot analysis
INS-1 cells (1 × 10⁶ cells per well) were incubated in 6-well plates for 24 h. Followed by different treatments, using pre-cooled PBS to wash the cells for twice, RIPA lysis buffer with 1 mmol/L PMSF was used to lyse the cells on ice. The concentration of the extracted protein was detected by bicinchoninic acid (BCA) protein assay kit. 12% SDS-PAGE was applied for separating equal amounts of protein (20 μg), and then transferred to a polyvinylidene fluoride membrane. The membranes which had been blocked in PBST/5% nonfat dry milk powder were incubated over night at 4°C with antibodies against Bcl-2, Bax, cleaved caspase-3, Pdx-1, GAPDH, JNK, p-JNK, ERK, p-ERK, p38, p-p38, NF-κB p65, p-NF-κB p65. After washed by Tris-buffered saline (TBS)-Tween 20 (0.05%), the membranes were incubated with secondary goat antirabbit antibody (Cell Signaling, USA) at room temperature for 1 h. Finally, after treated with ECL (enhanced chemiluminescence solution), applying Image Lab camera (Bio-Rad, Germany) for visualizing and detecting the bands, then the results were analyzed with the ImageJ software. Data were collected from three independent experiments.
Statistical analysis
All data were presented as means ± S.D. Statistical significance were analyzed by One-way ANOVA test. A value of P < 0.05 was considered statistically significant.
Results
Cellular uptake of FYGL
shows the uptake of FYGL (200 μg/mL) in INS-1 cells measured by confocal laser scanning microscopy. It was observed that there was no green fluorescence in INS-1 cells without adding FITC-FYGL, while it was found that FYGL (labeled with FITC green fluorescence) was located in INS-1 cells after 4 h incubation, demonstrating that FYGL can be well absorbed by INS-1 cells. In addition, based on the fluorescence intensity of FITC–FYGL, we used the flow cytometric analysis to further demonstrate the uptake of FYGL. As shown in , the peak position along the x-axis moved to the right when the concentration of FITC–FYGL increased, indicating the increased absorption of FYGL by INS-1 cells. depicts the Geom mean analyzed by Flowjo software, indicating that absorption of FYGL by INS-1 cells was increased in a dose-dependent manner.
Figure 2. INS-1 cells were incubated with FITC–FYGL (200 μg/mL) for 4 h. (a) Laser confocal scanning microscopy images of FYGL in INS-1 cells; the blue (DAPI labeled), red (rhodamine labeled) and green (FITC labeled) colors represent cell nucleus, cell cytoskeleton and FYGL, respectively. The scale bar represents 50 μm. (b) The flow cytometry fluorescence in channel FL1. (c) Geom mean calculated by using the Flowjo software. Data are presented as means ± S.D. (n = 5). * p < 0.05, *** p < 0.001 compared with the control group

FYGL enhanced cell growth and improved viability of INS-1 cells induced by STZ
The effects of FYGL on INS-1 cell growth and cell viability were determined by CCK-8 assay. INS-1 cells were incubated with FYGL (0, 50, 100, 200, 500, and 1000 μg·mL−1) for 24 h and as shown in , the cell growth was improved with the increase of FYGL concentration, which indicated that FYGL could improve cell growth of INS-1 cells. In order to further explore the effect of FYGL in INS-1 apoptosis and dysfunction caused by STZ, we pre-incubated INS-1 cells with different concentrations of FYGL (0, 100, 200, 500 μg/mL) for 4 h, then the cells were cultured with or without STZ for an additional 24 h. As indicated in , the cell viability was significantly reduced to 59.04% when exposed to STZ for 24 h, while co-cultured with FYGL (0, 100, 200, 500 μg/mL) for 24 h resulted in a markedly improvement of cell viability. These results indicated that FYGL has great potential of protecting INS-1 cells from the damage caused by STZ. However, the effect of FYGL on STZ-induced INS-1 cells was suppressing apoptosis rather than enhancing cell proliferation should be further proved.
Figure 3. Effect of FYGL on cell growth and cell viability in STZ‐induced INS‐1 cells. (a) INS‐1 cells were incubated with various concentrations of FYGL (0, 50, 100, 200, 500 and 1000 μg·mL−1) for 24 h, and cell growth was measured by CCK-8 assay. (b) INS‐1 cells were pre-treated with FYGL (0, 100, 200, 500 μg·mL−1) for 4 h, then incubated for 24 h with or without 0.3 mM STZ. The cell viability of INS‐1 cells was determined by CCK-8 assay. All data were presented as mean ± S.D. (n = 5). ## P < 0.01 compared with STZ group; * P < 0.05, ** P < 0.01, *** P < 0.001 compared with control group. STZ: streptozotocin

Protection of INS-1 cells from STZ-induced apoptosis by FYGL
To prove the anti-apoptotic effect of FYGL, the flow cytometry analysis with annexin-V/PI staining was used to analyze the cell apoptosis in STZ‐induced INS‐1 cells. As shown in , when INS-1 pancreatic β cells were treated with 0.3 mM STZ for 24 h, the ratio of early apoptotic cells was markedly higher than that of control group, while cells co-incubated with 100, 200 and 500 μg/mL of FYGL for 24 h resulted in a markedly reduction in cell apoptosis, which was consistent with the CCK-8 assay results, suggesting that FYGL could protect INS-1 cells against apoptosis induced by STZ.
Figure 4. Effect of FYGL on cell apoptosis in STZ‐induced INS‐1 cells. INS-1 cells were pretreated with FYGL (0, 100, 200, 500 μg/mL) for 4 h, followed by exposure to 0.3 mM STZ for 24 h. (a) Cell apoptosis was analyzed using flow cytometric assay with annexin V-FITC and PI-staining. (b) Quantitative analysis of cell apoptosis determined by flow cytometric assay. All data were presented as mean ± S.D. for three independent experiments. ## P < 0.01, ### P < 0.001 compared with STZ group; *** P < 0.001 compared with control group

Effect of FYGL on intracellular reactive oxygen species and nitric oxide
As shown in , the level of ROS in INS-1 cells was significantly increased after cells were induced by STZ for 24 h. However, the co-cultured cells with different concentrations of FYGL and STZ for 24 h resulted in a significant decrease in ROS generation. Furthermore, we detected the level of NO in STZ‐induced INS-1 cells. As indicated in , cells exposed to STZ for 24 h significantly elevated the level of NO, while the NO levels in FYGL-treated cells were reduced in a dose-dependent manner. Collectively, these findings indicated that FYGL attenuated the oxidative stress induced by STZ through decreasing ROS level and NO release in INS-1 cells.
Figure 5. Effect of FYGL on levels of intracellular reactive oxygen species (ROS) and the level of nitric oxide (NO). After preincubation with FYGL for 4 h, INS-1 cells were treated with the indicated concentrations of FYGL and STZ (0.3 mM) for 24 h. (a) Levels of intracellular reactive oxygen species were analyzed by flow cytometry using DCFH-DA as a reactive oxygen species sensitive probe. (b) Geom mean calculated by the Flowjo software. (c) Level of nitric oxide (NO). All data were presented as mean ± S.D. for three independent experiments. ## P < 0.01, ### P < 0.001 compared with STZ group; *** P < 0.001 compared with control group

Effects of FYGL on NF-κB activation and protein level of cleaved caspase-3, Bax and Bcl-2
To investigate the underlying mechanisms of FYGL protecting the cells from apoptosis, western blot analysis was used to determine the expressions of NF-κB, p-NF-κB, cleaved caspase-3, Bax, and Bcl-2. As shown in , NF-κB was significantly activated after the exposure to STZ, whereas the treatment with FYGL markedly suppressed the phosphorylation of NF-κB. Furthermore, the protein levels of Bax and cleaved caspase-3 were both significantly up-regulated, and Bcl-2 protein expression was decreased after exposure to STZ for 24 h, while the co-incubation with FYGL evidently reversed the progress induced by STZ. In a word, these results suggested that FYGL suppressed STZ-induced beta cell apoptosis via preventing NF-κB from the activation and regulating the expressions of cleaved caspase-3, Bax, and Bcl-2.
Figure 6. Effect of FYGL on NF-κB activation and protein expressions of cleaved caspase-3, Bax and Bcl-2. Following pre-incubation with FYGL for 4 h, the cells were treated with the indicated concentrations of FYGL and STZ (0.3 mM) for 24 h, and analyzed by Western blot to determine the levels of proteins. (a) The level of p65, p‐p65, cleaved caspase-3, Bax and Bcl-2 were measured by Western blot analysis. (b) Quantification of p‐p65/p65. (c) Quantification of cleaved caspase-3/GAPDH. (d) Quantification of Bax/GAPDH. (e) Quantification of Bcl-2/GAPDH. All data were presented as mean ± S.D. for three independent experiments. #P < 0.05, ##P < 0.01 compared with STZ group; ** P < 0.01, *** P < 0.001 compared with control group

Effect of FYGL on the activation of MAPK pathway in STZ-induced INS-1 cells
To further investigate whether MAPK pathway was involved in the protective effect of FYGL on STZ-induced INS-1 cells, Western blot analysis was used to determine the levels of p38, p-p38, ERK, p-ERK, JNK, and p-JNK. The results shown in suggested that the levels of p-p38 and p-JNK were significantly improved by STZ in INS-1 cells, while the phosphorylation of those proteins induced by STZ were significantly reduced by FYGL (500 μg/mL) treatment. However, the phosphorylation of ERK, i.e. p-ERK, was not affected by FYGL. The results suggested that FYGL protected INS-1 cells against apoptosis and oxidative stress caused by STZ through inhibiting the activation of p38 MAPK and JNK pathways in STZ-induced INS-1 cells.
Figure 7. Effects of FYGL on the activation of p38 MAPK, ERK and JNK. Following pre-incubation with FYGL for 4 h, the cells were treated with the indicated concentrations of FYGL and STZ (0.3 mM) for 24 h, and analyzed by Western blot to determine the levels of proteins. (a) The levels of p38, p-p38, ERK, p-ERK, JNK and p-JNK were measured by Western blot analysis. (b) Quantification of p-p38/p38. (c) Quantification of p-ERK/ERK. (d) Quantification of p-JNK/JNK. All data were presented as mean ± S.D. for three independent experiments. #P < 0.05 compared with STZ group; * P < 0.05, ** P < 0.01 compared with control group

Effects of FYGL on insulin secretion and protein expression of Pdx-1 in INS-1 cells
The insulin is extreme deficient in STZ-induced diabetes model cells, which was caused by a direct toxicity of STZ for the β cells. To determine the effect of FYGL on insulin secretion in STZ-induced INS-1 cells, the cells were pre-incubated with FYGL for 4 h, and then incubated with or without STZ for 24 h. As depicted in , when cells were induced by STZ for 24 h, there was a significant reduction of insulin secretion under both 5.6 mM and 16.7 mM glucose stimulation, whereas the treated with FYGL resulted in a marked improvement of insulin secretion, which indicated that FYGL was able to improve the insulin secretion in STZ-induced INS-1 cells. Furthermore, it has been reported that the pancreatic duodenal homeobox 1 (Pdx1) plays an important role in insulin expression [Citation13]. We investigated the expression of Pdx-1 in STZ-treated INS-1 cells using Western blot analysis. As shown in , the exposure with 0.3 mM STZ significantly decreased the expression of Pdx-1 in INS-1 cells, however, FYGL dose-dependently improved the Pdx-1 expression. Collectively, these results indicated that FYGL could improve the insulin secretion through increasing Pdx-1 expression in the INS-1 cells damaged by STZ.
Figure 8. Effects of FYGL on insulin secretion and Pdx-1 protein expression of in STZ-induced INS-1 cells. Cells were pre-treated with the indicated concentrations of FYGL for 4 h, then incubated with or without STZ (0.3 mM) for another 24 h. (a) Insulin secretion analysis. After treatments by STZ and FYGL, the cells were stimulated with Hanks balanced salt solution (HBSS) containing 5.6 mmol/L and 16.7 mmol/L glucose for 1 h, respectively, the insulin contents in culture medium were detected by ELISA. (b) The level of Pdx-1 was measured by Western blot analysis. (c) Quantification of Pdx-1/GAPDH. All data were presented as mean ± S.D., # P < 0.05, ## P < 0.01, ### P < 0.001 compared with STZ group; ** P < 0.01, *** P < 0.001 compared with control group

Discussion
During diabetes mellitus, the preservation of β cells is very important. The growing evidences have suggested that oxidative stress can be induced by hyperglycemia and some other risk factors for diabetes [Citation14,Citation15]. Oxidative stress is considered to be one of the critical pathological events that induce β-cell damage, and impair the ability of insulin secretion [Citation5]. To alleviate this damage, reducing the oxidative stress is important. Currently, many studies have focused on investigating the anti-oxidative agents to treat DM [Citation16,Citation17]. Streptozotocin, a widely used chemical, is toxic for the pancreatic β‐cells, which can trigger β-cell apoptosis through inducing the production of ROS [Citation15]. Therefore, STZ is widely applied for the establishment of diabetes model [Citation18]. Saini et al. demonstrated that STZ at low concentrations (10–20 mM) can cause β-cells apoptosis, while at high doses (30 mM), induce β cells necrosis [Citation19]. In this study, very low concentration of STZ (0.3 mmol/L) was used to induce apoptosis of INS-1 cells.
As a natural proteoglycan isolated from a traditional Chinese herb Ganoderma lucidum, FYGL (Fudan-Yueyang-G. lucidum) have been proven to be beneficial in the prevention of T2D and its complications previously by our group [Citation11,Citation12]. In addition, FYGL could protect INS-1 pancreatic beta cells against IAPP-induced apoptosis through attenuating endoplasmic reticulum stress and modulating CHOP/JNK pathways [Citation20]. In this study, we investigated the effects of FYGL on STZ‐induced β cell damage, and the results have shown that FYGL could improve β cell viability, promote cell survival and functions via inhibiting excess oxidative stress and regulating NF-κB/MAPK pathways, which indicated that FYGL played the action of antidiabetics through protecting β cells from damage.
Seo et al. have proved that STZ induces pancreatic beta cell apoptosis mainly by inducing the production of reactive oxygen species (ROS) and nitric oxide (NO) [Citation21]. Excess ROS can result in the biochemical and physiological damage [Citation22], and high level of NO also cause the β-cell damage and dysfunction, both ROS and NO lead to the diabetes [Citation23]. Consistent with those studies, our results showed that when INS-1 cells were exposed to 0.3 mM STZ for 24 h, ROS and NO were markedly increased. However, in FYGL-treated cells groups, ROS and NO were reduced significantly in a dose-dependent manner.
Moreover, Karin et al. have demonstrated that excessive amount of ROS can induce activation of NF-κB, which is a protein complex involved in immunity, inflammation, and cell apoptosis [Citation24]. Under physiological condition. For response to the stimuli of ROS, the IκB, the inhibitor of NF-κB, is phosphorylated and degraded, then leading to the NF-κB activation [Citation24]. Our results indicated that the cells exposure to STZ significantly increased the phosphorylation level of NF-κB, while treatment with FYGL resulted in a markedly inhibition for NF‐κB phosphorylation in STZ‐treated INS‐1 cells.
Furthermore, it has been reported that Bcl-2 protein family, regulated by NF-κB, plays an important role in apoptosis [Citation25]. Caspase-3 is one of the key executioners of apoptosis. Studies have demonstrated that caspase-3 activation, mediated by Bcl-2 family, was responsible for ROS-induced apoptosis [Citation26]. Zheng et al. have demonstrated that Sesamin, a main lignan constituent in sesame seeds, could suppress STZ-induced INS-1 cells apoptosis partly through the inhibition of NF-κB activation and regulation of Bcl-2 family protein expression [Citation15]. The present study demonstrated that STZ significantly induced the up-regulations of the cleaved caspase-3 and Bax, and the downregulation of Bcl-2 protein in INS-1 cells, while treatment with FYGL markedly reversed the progress of the cleaved caspase-3, Bax, and Bcl-2 protein expressions. These findings indicated that the antioxidative activity of FYGL might be an alternative functional mechanism. Moreover, the suppressions of NF-κB activation, Bcl-2 family regulation, and the cleaved caspase-3 protein expression could be mediated by FYGL antioxidant capacity.
In order to further investigate the signaling pathway involved in regulating STZ-induced apoptosis and ROS generation, we investigated the mitogen-activated protein kinase signaling pathway including p38 MAPK, ERK, and JNK. MAPK signaling pathway can be triggered by multiple factors including toxic chemicals, oxidative stress, and environmental stress. Studies have showed that STZ can cause the aggressive activation of MAPK in β-cells, which is harmful for the cell survival [Citation27,Citation28]. Liu et al. have demonstrated that Paeoniflorin, extracted from the root of Paeonia lactiflora Pall, could alleviate oxidative stress and cell apoptosis through inhibiting the activation of MAPK pathway [Citation29]. In this study, cells exposure to STZ significantly resulted in the phosphorylation of JNK, p38 MAPK, and ERK while FYGL inhibited the activations of p38 MAPK and JNK pathways in FYGL-treated INS-1 cells. However, FYGL did not affect the activation of ERK. Briefly, these findings indicated that the activation of the MAPK pathway was involved in the ROS-induced apoptosis, FYGL protected the β cells partially through inhibiting the activations of JNK and p38 MAPK.
One of the most important functions of β cells is insulin secretion. STZ can cause insulin-secreting defects in INS-1 cells [Citation15,Citation29]. In the present study, insulin secretion was notably decreased when INS-1 β cells were exposed to STZ for 24 h. As expected, FYGL significantly increased insulin secretion in a dose-dependent manner. We further explored the mechanism of FYGL regulating insulin secretion in STZ-treated INS-1 cells.
Pancreatic duodenal homeobox 1 (Pdx1), expressed in the pancreas and duodenum, plays an important role in β-cell development and functions by regulating many important β-cell genes [Citation30,Citation31]. Kajimoto et al. has demonstrated that Pdx-1 is a key transcription factor that binds to the insulin promoter and induces insulin expression [Citation13]. In this study, the expression of Pdx-1 was significantly reduced in STZ-treated INS-1 cells, whereas FYGL improved the expression of Pdx-1 after 24 h treatment for the cells. Importantly, JNK activation by oxidative stress could reduce the Pdx-1 DNA binding activity and insulin gene transcription [Citation32], FYGL did inhibit this progress. Taken together, these findings suggest that FYGL regulated the insulin secretion based on the mechanism of inhibition of the JNK activation and then improvement of the Pdx-1 level in STZ-induced INS-1 cells.
Conclusion
In conclusion, this study firstly proved that FYGL can improve β cells viability and protect β cells against STZ-induced cell apoptosis and dysfunction. Furthermore, the mechanism of FYGL protecting the cells from apoptosis induced by STZ might be partially attributed to its prevention effect on oxidative stress through inhibiting the activation of NF-κB, JNK, and p38 MAPK. Meantime, FYGL can improve the insulin secretion by decreasing the activation of JNK, and then increasing the level of Pdx-1. These findings help ones understanding the mechanisms of FYGL against pancreatic beta cell damage in diabetes, and suggest that FYGL could be used as a promising agent for management of diabetes mellitus. Further investigation in vivo is under progress for FYGL clinical application.
Author contributions
H. L. designed the experiments, interpreted the data, drafted the article. Y.P., Y.T., S.Y., X.W. contributed to data collection. P.Z. revised the manuscript, H.Y. and P.Z. provided the funds.
Disclosure statement
The authors declare that there are no conflicts of interest.
Additional information
Funding
References
- Alberti K, Zimmet PZ, Consultation WHO. Definition, diagnosis and classification of diabetes mellitus and its complications part 1: diagnosis and classification of diabetes mellitus - Provisional report of a WHO consultation [Article]. Diabetic Med. 1998 Jul;15(7):539–553.
- Duong M, Cohen JI, Convit A. High cortisol levels are associated with low quality food choice in type 2 diabetes [Article]. Endocrine. 2012 Feb;41(1):76–81.
- Ashcroft FM, Rorsman P. Diabetes mellitus and the beta cell: the last ten years [Review]. Cell. 2012 Mar;148(6):1160–1171.
- Zhang ZY, Liew CW, Handy DE, et al. High glucose inhibits glucose-6-phosphate dehydrogenase, leading to increased oxidative stress and beta-cell apoptosis [Article]. Faseb J. 2010 May;24(5):1497–1505.
- Gerber PA, Rutter GA. The role of oxidative stress and hypoxia in pancreatic beta-cell dysfunction in diabetes mellitus [Review]. Antioxid Redox Signal. 2017 Apr;26(10):501-+.
- Pi JB, Zhang Q, Fu JQ, et al. ROS signaling, oxidative stress and Nrf2 in pancreatic beta-cell function [Review]. Toxicol Appl Pharmacol. 2010 Apr;244(1):77–83.
- Russell R, Paterson M. Ganoderma - A therapeutic fungal biofactory [Review]. Phytochemistry. 2006 Sep;67(18):1985–2001.
- Chang CJ, Lin CS, Lu CC, et al. Ganoderma lucidum reduces obesity in mice by modulating the composition of the gut microbiota [Article]. Nat Commun. 2015 6;Jun:17.
- Teng BS, Wang CD, Yang HJ, et al. A protein tyrosine phosphatase 1B activity inhibitor from the fruiting bodies of ganoderma lucidum (Fr.) Karst and its hypoglycemic potency on streptozotocin-induced type 2 diabetic mice [Article]. J Agric Food Chem. 2011 Jun;59(12):6492–6500.
- Pan D, Wang L, Chen C, et al. Isolation and characterization of a hyperbranched proteoglycan from Ganoderma lucidum for anti-diabetes. Carbohydr Polym. 2015;117:106–114.
- Teng BS, Wang CD, Zhang D, et al. Hypoglycemic effect and mechanism of a proteoglycan from Ganoderma lucidum on streptozotocin-induced type 2 diabetic rats. Eur Rev Med Pharmacol Sci. 2012;16(2):166–175.
- Wang CD, Teng BS, He YM, et al. Effect of a novel proteoglycan PTP1B inhibitor from Ganoderma lucidum on the amelioration of hyperglycaemia and dyslipidaemia in db/db mice. Br J Nutr. 2012;108(11):2014–2025.
- Kajimoto Y, Kaneto H Role of oxidative stress in pancreatic β-cell dysfunction. Mitochondrial Pathogenesis. Springer; 2004. p. 168–176.
- Shen GX. Oxidative stress and diabetic cardiovascular disorders: roles of mitochondria and NADPH oxidase. Can J Physiol Pharmacol. 2010;88(3):241–248.
- Zheng S, Zhao M, Ren Y, et al. Sesamin suppresses STZ induced INS-1 cell apoptosis through inhibition of NF-kappa B activation and regulation of Bcl-2 family protein expression. Eur J Pharmacol. 2015 Mar 5;750:52–58.
- Kim J, Shin SH, Kang JK, et al. HX-1171 attenuates pancreatic β-cell apoptosis and hyperglycemia-mediated oxidative stress via Nrf2 activation in streptozotocin-induced diabetic model. Oncotarget. 2018;9(36):24260.
- Zhang Y, Mei H, Shan W, et al. Lentinan protects pancreatic β cells from STZ‐induced damage. J Cell Mol Med. 2016;20(10):1803–1812.
- Zhao TX, Luo D, Sun Y, et al. Human urine-derived stem cells play a novel role in the treatment of STZ-induced diabetic mice [Article]. J Mol Histol. 2018 Aug;49(4):419–428.
- Saini KS, Thompson C, Winterford CM, et al. Streptozotocin at low doses induces apoptosis and at high doses causes necrosis in a murine pancreatic ß cell line, INS‐1. IUBMB Life. 1996;39(6):1229–1236.
- He YM, Zhang Q, Zheng M, et al. Protective effects of a G. lucidum proteoglycan on INS-1 cells against IAPP-induced apoptosis via attenuating endoplasmic reticulum stress and modulating CHOP/JNK pathways. Int J Biol Macromol. 2018;106:893–900.
- Seo E, Lee EK, Lee CS, et al. Psoralea corylifolia L. seed extract ameliorates streptozotocin-induced diabetes in mice by inhibition of oxidative stress. Oxid Med Cell Longev. 2014;2014:897296.
- Raza H, John A. Streptozotocin-induced cytotoxicity, oxidative stress and mitochondrial dysfunction in human hepatoma HepG2 cells. Int J Mol Sci. 2012;13(5):5751–5767.
- Thomas HE, Darwiche R, Corbett JA, et al. Interleukin-1 plus γ-interferon-induced pancreatic β-cell dysfunction is mediated by β-cell nitric oxide production. Diabetes. 2002;51(2):311–316.
- Karin M, Yamamoto Y, Wang QM. The IKK NF-κB system: a treasure trove for drug development. Nat Rev Drug Discov. 2004;3(1):17.
- Burlacu A. Regulation of apoptosis by Bcl‐2 family proteins. J Cell Mol Med. 2003;7(3):249–257.
- Chen KC, Chang LS. Arachidonic acid-induced apoptosis of human neuroblastoma SK-N-SH cells is mediated through mitochondrial alteration elicited by ROS and Ca2+-evoked activation of p38α MAPK and JNK1. Toxicology. 2009;262(3):199–206.
- Shen H, Liu J, Wang Y, et al. Aflatoxin G1-induced oxidative stress causes DNA damage and triggers apoptosis through MAPK signaling pathway in A549 cells. Food Chem Toxicol. 2013;62:661–669.
- Ravindran J, Gupta N, Agrawal M, et al. Modulation of ROS/MAPK signaling pathways by okadaic acid leads to cell death via, mitochondrial mediated caspase-dependent mechanism. Apoptosis. 2011;16(2):145–161.
- Liu Y, Han J, Zhou Z, et al. Tangeretin inhibits streptozotocin‐induced cell apoptosis via regulating NF‐κB pathway in INS‐1 cells. J Cell Biochem. 2019;120(3):3286–3293.
- Offield MF, Jetton TL, Labosky PA, et al. PDX-1 is required for pancreatic outgrowth and differentiation of the rostral duodenum. Development. 1996;122(3):983–995.
- Wang H, Maechler P, Ritz-Laser B, et al. Pdx1 level defines pancreatic gene expression pattern and cell lineage differentiation. J Biol Chem. 2001;276(27):25279–25286.
- Kaneto H, Xu G, Fujii N, et al. Involvement of c-Jun N-terminal kinase in oxidative stress-mediated suppression of insulin gene expression. J Biol Chem. 2002;277(33):30010–30018.