
ABSTRACT
Arabidopsis thaliana FLL2, a member of the FLO2 gene family, is expressed specifically in green leaves. The fll2 mutant showed significantly large rosette leaves and reduced the chlorophyll content. The sucrose content was significantly reduced. The glucose content was higher during the vegetative growth stage but decreased during the early reproductive growth stage. The amount of assimilated starch was lower than that in the wild type plant. The expression levels of genes involved in biosynthesis of sucrose and starch were largely altered. These results suggest that, in the fll2 mutant, a small amount of photosynthetic products was used for the biosynthesis of starch, and the products were supplied to promote intracellular growth of the source organs or for transport to the sink organs. These findings suggest that FLL2 is a factor affecting the expression level of genes involved in sugar metabolism, whose mutation caused a change in the assimilated products.
Abbreviations : DAS: days after sowing
Graphical Abstract
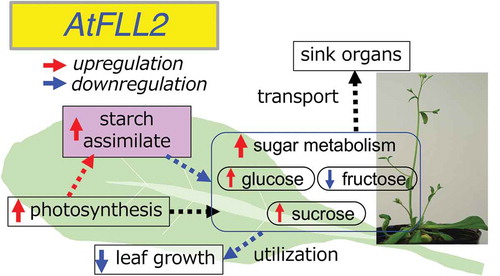
Arabidopsis thaliana FLL2 affects to the sugar metabolism and flow, causing enlarged rosette leaves and reduced chlorophyll content.
Plants require the balance between carbon assimilation, storage, and growth, but little is known about how this is achieved [Citation1]. Rice flo2 mutant shows a shortage of storage substances accumulation, resulting in dwarf, milky, and floury endosperm with significantly reduced grain quality. This mutant, exhibits the largely reduced expression levels of the genes for storage starch biosynthesis and storage proteins [Citation2,Citation3]. We have identified the rice FLO2 (FLOURY ENDOSPERM2) gene, which is the gene responsible for the flo2 mutant. Rice FLO2 encodes a protein comprising 1720 amino acid residues including the TPR motif involved in interactions with various proteins. Therefore, FLO2 is considered as a global regulator of the biosynthesis of seed storage materials, although its molecular function is still unclear.
Rice FLO2 is expressed not only in developing seeds but also in green leaves, but no obvious phenotypic differences in leaves of rice flo2 mutants have been observed [Citation3]. A homologous gene of rice FLO2 is also found in Arabidopsis thaliana. This gene is expressed both in green leaves and in developing seeds. Studies using the A. thaliana flo2 mutants suggest that this gene is involved in regulation of vegetative growth, not only of yield and quality of seed storage substances [Citation4].
FLO2 and two homologs, FLL1 and FLL2, compose a gene family, and are highly conserved in the plant species. No homologous gene to these genes has been found in fungal or animal genomes, suggesting that their functions are considered to be plant specific [Citation3]. Among them, FLO2 and FLL1 are found only in higher plant species, but FLL2 is also contained in a species of moss, Physcomitrella patens, suggesting that FLL2 may be an evolutionarily old molecular species [Citation3]. Rice FLL1 and FLL2 are expressed specifically in green leaves, and no expression is detected in developing seeds [Citation3]. Therefore, they are presumed to have some functions in vegetative growth stage, although these functions have not been clarified [Citation4]. In this study, we analyzed the physiological function of the FLL2 gene of A. thaliana.
Materials and methods
Plant materials and growth conditions
Arabidopsis thaliana seeds were sterilized by sequential washing in 70% ethanol for 1 min with continual inversion in a solution containing 5% sodium hypochlorite (v/v) and 0.1% Tween-20 (v/v), after which they were rinsed in deionized water three times. The seeds were kept in the dark at 4°C for 3 d and then spread on an MS agar plate consisting of 0.8% (w/v) Type-M agar (WAKO Pure Chemicals, Tokyo, Japan) supplemented with 1% (w/v) sucrose, 0.05% MES (pH 5.8) and 0.1% B5 vitamin mixture (0.3% thiamine hydrochloride, 0.05% pyridoxine hydrochloride and 0.5% nicotinic acid) [Citation5]. The plants were subsequently grown in a growth chamber (Tomy Seiko, Tokyo, Japan) under long-day conditions (16 h light and 8 h darkness) at 22°C. To provide high light intensity to the plants, an additional light-emitting diode (LED) was placed in the growth chamber.
Establishment of a homozygous mutant line
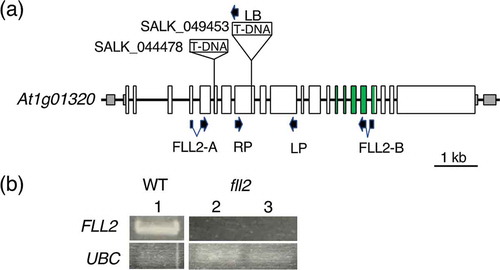
Mutant lines were screened from T-DNA tag lines using T-DNA express (http://signal.salk.edu/cgi-bin/tdnaexpress). Seeds of the T-DNA insertion line SALK_049453, which harbors an insertion in the 10th exon of the At1g01320 gene, which was designated AtFLL2, were obtained from the Arabidopsis Biological Resource Center, Ohio University (http://www.arabidopsis.org/). A homozygous AtFLL2 mutant plant was selected from among the progeny that were obtained by backcrosses between the SALK_049453 and the wild-type (Col-0) plants, resulting in an fll2 mutant line.
Analysis of genotypes
The genotypes of the progeny of the mutant plant line were determined by PCR using several different primer sets. Primers RP (5′–TTCGCCTTTATCGCATCTATG–3′) and LP (5′–GCTATTGAGGGACTTAAGCGG–3′) were used for the detection of the wild-type AtFLL2 gene. Another primer set, RP and LB (5′ – ATTTTGCCGATTTCGGAAC–3′), was used for determination of the insertion of T-DNA in the AtFLL2 gene. These primers corresponded to the nucleotide sequences in the region of the 10th exon and 12th exon, respectively, of the At1g01320 gene, and LB corresponded to the left border regions of the T-DNA. The positions of these primers are shown in . Genomic DNA was prepared by the cetyltrimethylammonium bromide (CTAB) method [Citation6], and PCR was performed using Blend Taq DNA polymerase (Toyobo, Osaka, Japan).
Figure 1. Isolation of the fll2 mutant. (a) Schematic representation of the structure of the AtFLL2 gene, positions of T-DNA insertions in the SALK_049453 and SALK_044478 mutants, and sites of PCR primers. Exons are shown by boxes, in which the coding regions and untranslated regions are indicated by large open boxes and small shaded boxes, respectively. Regions corresponding to the TPR motifs are shown by open green boxes. (b) Detection of the transcripts in the mutant lines. FLL2 and UBC indicate the results of RT-PCR for the WT and mutant lines using the primers for the AtFLL2 and UBC genes, respectively. Numbers 1 to 3 indicate WT, SALK_049453, and SALK_044478, respectively. The UBC gene (At5g25760) was used as a control
Bioinformatic analysis
Homologs of rice FLL2 were queried via BLASTN and BLASTP using the website of The Arabidopsis Information Resource (TAIR) (http://wwwarabidopsis.org). Amino acid sequences were obtained from the NCBI (National Center for Biotechnology Information) database, and amino acid sequence alignment was performed GENETYX ver. 14 software (Genetyx, Tokyo, Japan) using the ClustalW program (http://www.clustal.org/download/current/).
Morphological observations
The date when bolting started was recorded. Flowers were collected and placed on 1% agarose gels. Their morphologies were observed using a VH-Z450 digital microscope (Keyence Corp., Osaka, Japan), and features of the petals, stamens and pistils of Col-0 plants and the fll2 mutants were determined. The number of siliques and seed numbers in each silique were counted. The seed size of Col-0 and the fll2 mutant plants was measured using images taken with the digital microscope. Each image was analyzed by the ImageJ program to calculate the seed area.
Measurement of chlorophyll contents
Rosette leaves were harvested from 21-day-old fll2 mutant and WT plants, and round sections were prepared by removing discs with a diameter of 6 mm with a leaf punch (Kokuyo Co., Ltd., Osaka, Japan). The pieces were soaked in 1 mL of N,N-dimethylformaldehyde and then incubated overnight in the dark at 4°C to extract the chlorophyll-containing fractions from the leaves. The resulting fractions were subjected to measurements at 646.8 nm, 663.8 nm, and 750 nm using a U-5100 spectrophotometer (Hitachi, Ltd., Tokyo, Japan). Values at 750 nm were used as blanks. The amount of chlorophyll (Chl) (μg Chl mL-1) was estimated according to the formulas of Porra et al. as follows [Citation7]: Chl a = 12.00 × A663.8 − 3.11 × A646.8, Chl b = 20.78 × A646.8–4.88 × A663.8 and Chl a + b = 17.67 × A646.8 + 7.12 × A663.8. The amount of chlorophyll per leaf area (μg Chl mL−1 cm−2) was calculated by dividing these values by the leaf area.
Measurement of sugar and starch contents
Rosette leaves were prepared at 14, 21, 28, and 38 DAS from the fll2 mutant and WT plants and then crushed in liquid nitrogen using a mortar and pestle. One hundred milligrams of each powder was combined with 1 mL of 80% ethanol and subsequently incubated overnight at 4°C. They were then centrifuged at 18000 g for 20 min, and the supernatant was further centrifuged at 18000 g for 20 min. The pellet obtained after collection of the supernatant was used to analyze the starch contents. The supernatant solution was filtered using Captiva ND (0.45 μm) (Agilent Technologies, Santa Clara, CA, U.S.A.) and then evaporated to remove the remaining 80% ethanol. The resultant dried powder was used for the analysis of the sugar content.
The dried powder was dissolved in 1 mL of deionized water. Soluble sugars in this sample were analyzed by high-performance liquid chromatography (HPLC). The sugars were separated using 250 mm Sucrebead I columns packed with anion exchange particles (Osaka Soda Co., Ltd., Osaka, Japan) in conjunction with a 200 mM NaOH mobile phase and measured by a pulsed amperometric detector PAD (Nanospace SI-2) (Shiseido Co., Ltd., Tokyo, Japan). Glucose, fructose and sucrose were quantified as the main sugar components. Standard solutions of these sugars were prepared for use as controls. A calibration curve was generated for the standard sugars via the peak areas according to the HPLC analysis. The sugar content was subsequently estimated using the calibration curve.
For the analysis of starch content, the pellet was washed twice with 80% ethanol and then subjected to extraction of the starch-containing fraction. For this process, we used a Total Starch Assay Kit (Amyloglucosidase α-amylase method) (Megazyme, Ltd., Wicklow, Ireland). The method consisted of solubilization and hydrolysis of starch to glucose by an enzymatic procedure according to Official AOAC Method 996.11 [Citation8]. The amount of starch was estimated by the absorbance at 510 nm using a UV-1800 spectrophotometer (Shimadzu Co., Ltd., Kyoto, Japan). A calibration curve was produced using a standard starch solution, and the starch content was ultimately estimated using the calibration curve.
RNA preparation and real-time quantitative RT-PCR (reverse transcription-PCR)
For RNA preparation, we prepared leaves from 14-day-old fll2 mutant and WT plants. Leaves were harvested 8 h after the light period started and 6 h after the dark period ended. The total RNA was extracted from each tissue using an RNeasy Plant Mini kit (QIAGEN, Hilden, Germany). First-strand cDNA was synthesized from 0.5 µg of total RNA using a ReverTra-Ace cDNA Synthesis Kit (Toyobo) with oligo dT(20) primers. RT-PCR was performed to measure the transcript abundance for the At1g01320 gene using FLL2-A and FLL2-B primers (5ʹ–GTTCTCACGTTAACGGAAGAGG–3ʹ and 5ʹ–CTTAACATACTTGAGAGCCAGCCTCTG–3ʹ). Real-time quantitative PCR was performed using QuantStudio3 (Thermo Fisher Scientific Inc., Waltham, MA, U.S.A.) in conjunction with a SYBR Green Real-time PCR mix (Toyobo) using the following primer sets: 5ʹ–GGATTCTCGGTACTTGCCAC–3ʹ and 5ʹ–GATGACCTTGAGGTGTCTGTGC–3ʹ for the Vacuolar invertase 2 gene (VI2; At1g12240), 5ʹ–CGGCTAAGAACCGGAGAATC–3ʹ and 5ʹ–CCTTGGAATCGTCTGAATACCG–3ʹ for the Cell wall invertase 1 gene (CWI1; At3g13790), 5ʹ–CTATGATACTTGCCCTTGCGAG–3ʹ and 5ʹ–CCATAATAAGTGCCAGGTTAGC–3ʹ for the Sucrose phosphate synthase 1 F gene (SPS1F; At5g20280), 5ʹ–GAATACTCGTGAACGCAGTAAC–3ʹ and 5ʹ–CGTCATCCCACACAATCTGC–3ʹ for the Sucrose phosphate synthase 4 F gene (SPS4F; At4g10120), 5ʹ–GAATTGAATGGCAAGCCTGACC–3ʹ and 5ʹ–GCATGAGCAATGGTACACTGAG–3ʹ for the Sucrose synthase 1 gene (SUS1; At5g20830), 5ʹ–CGAACAAGAAACGGTGAACT–3ʹ and 5ʹ–TTCGTTTATGCGTTGTAGCC–3ʹ for the Sucrose synthase 5 gene (SUS5; At5g37180), 5ʹ–GGTGCCACTTCCCTTGGACTGAG–3ʹ and 5ʹ–CGGAGCAGAACGGTCATAGAAAC–3ʹ for the ADP-glucose pyrophosphorylase (AGPase) small subunit 1 gene (ADG1; At5g48300), 5ʹ–ATAGATGACAGACGTGCCTC–3ʹ and 5ʹ–GTTGTGTCTACTGCCATTGC–3ʹ for the AGPase large subunit 1 gene (ADG2; At5g19220), 5ʹ–CCGAGAAGATCAAATGCAAGATGGCAC–3ʹ and 5ʹ–TGCCCTTCTGGTAATCAAGTCT–3ʹ for the Starch synthase 1 gene (SS1; At5g24300), 5ʹ–AGGTGGCCTTGGAGATGTAG–3ʹ and 5ʹ–CTTCAGCATACTCGGCATACC–3ʹ for the Starch synthase 2 gene (SS2; At3g01180), 5ʹ–ACAACGTGGTTTCGACTCTAG–3ʹ and 5ʹ–CATTGTTGCTCTGAAGACCTG–3ʹ for the Starch synthase 4 gene (SS4; At4g18240), 5ʹ–ATCTGATGTTATGGCTCGGAACG–3ʹ and 5ʹ – GGTATCCATGCGGATCTTCA–3ʹ for the Starch branching enzyme 2.1 gene (BE3; At2g36390), 5ʹ–GCAATGAGATATGGAACCGTC–3ʹ and 5ʹ–GATCCACAACTTCACACTTGAC–3ʹ for the Granule-bound starch synthase 1 gene (GBSS1; At1g32900), 5ʹ–TATCCAGACTTGCTTCGTTTCG–3ʹ and 5ʹ–CGAGCTTCAAGCAAACCCTC–3ʹ for the Chloroplastic α-glucan water dikinase 1 gene (GWD1; At1g10760), 5ʹ–GGACATTAGTTCAGGTTGAGAGC–3ʹ and 5ʹ–CAGCACTTACCTCTTCATCGC–3ʹ for the Chloroplastic α-glucan water dikinase 3 gene (GWD3; At5g26570), 5ʹ–CGTTATGCTTCCGTTGGGAG–3ʹ and 5ʹ–GACCATAACGCCATCAACGC–3ʹ for the β-amylase 1 gene (BMY1; At4g15210), 5ʹ–GCGGAAATTCAAGTAGGAATGG–3ʹ and 5ʹ–CTTGTCGTAGCACTGGAACTC–3ʹ for the β-amylase 3 gene (BAM3; At4g17090), 5ʹ–GTATGAGTTCAAGGAGGACTGC–3ʹ and 5ʹ–CATCACGTCGAACTTTGTCC–3ʹ for the 4-α-glucanotransferase DPE2 gene (DPE2; At2g40840), and 5ʹ–GGCGATACAGTCCCATCTAAGC–3ʹ and 5ʹ–GAAGTGTCGTTGTGCATAGC–3ʹ for the Hexokinase-1 gene (HXK1; At4g29130). The ubiquitin-conjugating enzyme 21 gene (UBC, At5g25760) was used as a positive control for normalization of the data. PCR for this gene was performed using the primers 5ʹ–CTGCGACTCAGGGAATCTTCTA–3ʹ and 5ʹ–TTGTGCCATTGAATTGAACCC–3ʹ.
Results
Isolation of A. thaliana fll2 mutants
We found that a protein encoded by the At1g01320 gene in A. thaliana showed 80.6% similarity with rice FLL2 and named this gene AtFLL2, which was an A. thaliana ortholog of rice FLL2 (Supplementary Figure 1). AtFLL2 was predicted to encode a protein composed of 1,794 amino acid residues consisting of 25 exons, in which three TPR motif sequences were present in the region between the 16th exon and the 20th exon ()). The expression profile of AtFLL2 showed that the transcript of this gene was abundantly present in rosette leaves and cauline leaves but was rarely detected in developing seeds and roots (Supplementary Figure 2).
To determine the function of AtFLL2, A. thaliana T-DNA insertion mutants were sought. We found two mutant lines, SALK_049453 and SALK_044478, that had a T-DNA insertion in the 10th exon and in the 7th intron of the At1g01320 gene, respectively ()). These mutant lines showed defective expression of the At1g01320 gene, suggesting that these lines were considered mutants of this gene ()).
SALK_049453 homozygotes were then crossed with wild-type (WT) plants, and homozygous mutants of the At1g01320 gene were isolated from the F2 progeny. They also exhibited large rosette leaves, as observed in the parent line. These results strongly suggested that the trait of enlarged rosette leaves is due to the mutation of the At1g01320 gene. This line was used as the A. thaliana fll2 mutant strain in subsequent studies.
Morphology of A. thaliana fll2 mutants at the vegetative stage
Like the WT seeds, seeds of the fll2 mutants germinated normally, and the morphology of their leaves was similar to that of the WT leaves. However, the individual rosette leaves of the fll2 mutant were significantly larger than the WT leaves (). We measured the fresh weights of individual leaves prepared from the fll2 mutants and WT plants at 9–21 DAS and generated a growth curve based on the data. As shown in ), compared with the WT, the fll2 mutant showed significantly greater fresh weight during the vegetative and early reproductive stages. These observations indicate that this mutation causes enlargement of leaves and promotes postgerminative growth.
Figure 2. Characteristics of the fll2 mutant during the vegetative growth stage. (a) Features of wild-type (WT) and fll2 mutant plants (fll2) at 25 DAS. The left panels show whole plants. The right panels show the individual leaves and stems of plants. Scale bar = 1 cm. (b) Size of leaves of the fll2 mutant and WT at 21 DAS (n = 20). An asterisk indicates the value with significant differences (P < 0.05). The error bars represent the means ± SDs. (c) Time course analysis of the total weight of fresh leaves between 9 and 21 DAS. (d) The amount of chlorophyll a + b in green leaves at 21 DAS (n = 17 (WT) and 20 (fll2)). WT, wild type; fll2, fll2 mutant. The single and double asterisks indicate mean values with significant differences (P < 0.05 and P < 0.01, respectively). The error bars represent the means ± SDs
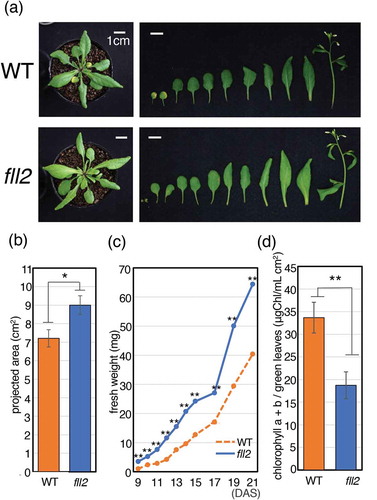
The fll2 mutant leaves showed a pale green color compared to those of the WT. We analyzed the chlorophyll content that was extracted from green leaves of plants at 21 DAS and determined the amount of chlorophyll a + b. We found that the chlorophyll content in the green leaves of the fll2 mutant was approximately 40% lower than that in the WT leaves ()). These observations indicated that the fll2 mutation reduced the amount of chlorophyll that had decreased in the green leaves.
Features of A. thaliana fll2 mutants during reproductive development
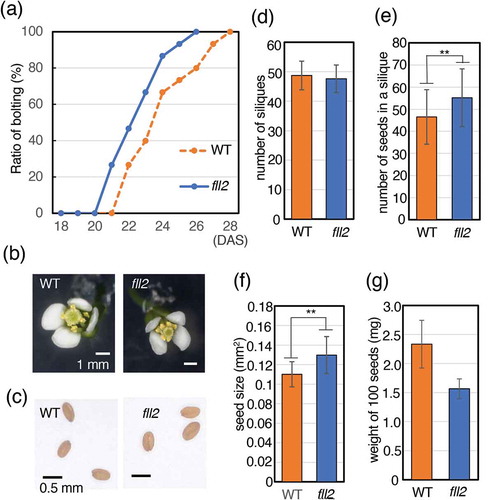
Timing of bolting was determined for the fll2 mutant. The fll2 mutant flowered one day before the WT until half the number of individual plants had bolted, and it was two days shorter until 90% of the plants bolted. The bolting of the fll2 mutant was complete at 26 DAS ()). We observed the morphology of the flowers and analyzed the number of petals, stamens and pistils of the fll2 mutant and WT plants. The fll2 mutant showed normal flower features, with four petals, six stamens, and one pistil ()). No significant change was observed in seed morphology ()). The number of siliques was approximately the same as that of the WT ()). However, the number of seeds per silique of the fll2 mutant was 19% higher than that of the WT ()), and the size of individual seeds of the fll2 mutant was 18% larger than that of the WT ()). The fll2 mutant seeds weight looked smaller than those of WT, but there was no significant difference between them ()).
Figure 3. Features of the fll2 mutant and the wild-type plants after bolting. (a) Timing of bolting for the fll2 mutant and wild-type plants. The ratio of plants for which a bolting event occurred is shown (n = 15). (b) Morphology of a representative flower. Scale bar = 0.1 cm. WT, wild-type plant; fll2, fll2 mutant. (c) Features of seeds of the wild-type plants and the fll2 mutant. Scale bars = 0.5 mm. (d) Number of siliques of the fll2 mutant (fll2) and wild-type (WT) plants (n = 10 and 7, respectively). (e) Number of seeds in a silique. Mean values of the siliques of the fll2 mutant (fll2) and the wild-type (WT) plants are shown (n = 125 and 70, respectively). (f) Seed sizes of the fll2 mutant and the wild-type plants. Each seed size was estimated as the mean value obtained by measuring the areas of seeds in the images. For this analysis, 109 and 100 seeds of the fll2 mutant and the wild-type plants were used, respectively. Means that differed significantly are indicated by double asterisks (P < 0.01). The error bars represent the means ± SDs. (g) Weight of 100 seeds of the fll2 mutant and WT (n = 3). The error bars represent the means ± SDs
Analysis of sugar and starch contents in green leaves
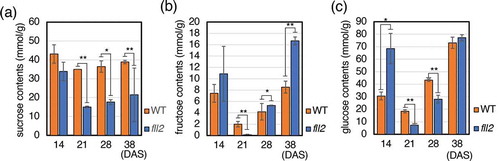
We analyzed the sugars in the rosette leaves of the fll2 mutants at 14 DAS (vegetative growth stage), 21 DAS (timing of bolting), 28 DAS (early reproductive growth stage), and 38 DAS (late reproductive growth stage) and compared them with those of WT. In the fll2 mutant, the sucrose content was greatly reduced in the period from the vegetative growth stage to the reproductive growth stage ()). Fructose content was largely fluctuated during the plant growth. In the vegetative stage, at 14 DAS, a large amount of fructose was contained, and at 21 DAS the fructose content was greatly decreased, then it was increased again in the reproductive growth stage. Although both the fll2 mutant and WT plant showed similar alteration, the fll2 mutant showed a larger magnitude of fluctuation than those of WT ()). The glucose content increased 2.2-fold during the vegetative growth period, significantly decreased to 0.4-fold in the early reproductive stage, and increased to the same level as that of the WT in the late reproductive stage in the fll2 mutant ()).
Figure 4. Sugar contents in leaves of the fll2 mutant. Leaves were harvested in the daytime. (a) Sucrose contents, (b) fructose contents, and (c) glucose contents in the leaves at 14, 21, 28, and 38 DAS of the fll2 mutant (fll2) and wild-type (WT) plants (n = 3). Means that differed significantly are indicated by asterisks (P < 0.05) or double asterisks (P < 0.01). The error bars represent the means ± SDs
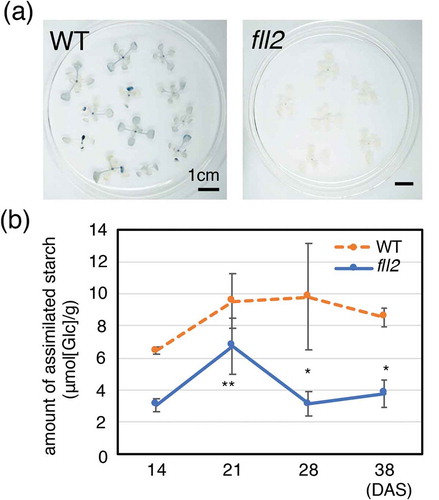
We analyzed the accumulation of starch in the green leaves of the fll2 mutants during their vegetative growth. While the WT showed displayed staining mainly in the rosette leaves with relatively large sizes by iodine-starch staining, few green leaves of the fll2 mutant were stained by iodine staining ()). We determined the amount of starch content in the leaves of the fll2 mutants and WT plants at 14 DAS, 21 DAS, 28 DAS and 38 DAS. As shown in ), the fll2 mutant presented significantly decreased leaf starch content between 14 and 38 DAS. These results showed that the fll2 mutant presented decreased amounts of assimilated starch in the leaves during the vegetative and reproductive growth stages, whereas a sufficient amount of starch continued to accumulate in the WT ()).
Figure 5. Accumulation of assimilated starch. (a) Iodine staining of the leaves of the fll2 mutant (fll2) and the wild-type (WT) plants at 14 DAS 8 h after the light period started. Scale bars = 1 cm. (b) Time course representation of the amount of assimilated starch in the leaves of the fll2 mutant (fll2) and the wild-type (WT) plants (n = 3) at 14, 21, 28, and 38 DAS. The leaves were harvested at 7 h after the light period started. Means that differed significantly are indicated by asterisks (P < 0.05) or double asterisks (P < 0.01). The error bars represent the means ± SDs
Altered expression of genes involved in sucrose and starch biosynthesis
Since both the sucrose content and the starch content were decreased in the green leaves of the fll2 mutant, we investigated differences in the expression of gene involved in sucrose biosynthesis and starch biosynthesis in the leaves during light and dark periods between the fll2 mutant and WT plants.
Sucrose phosphate synthase (SPS) and sucrose synthase are involved in sucrose biosynthesis. On the other hand, sucrose synthase and invertase are involved in sucrose degradation [Citation9]. Among invertase genes, acid invertase genes, the vacuolar invertase 2 gene (VI2) and the cell wall invertase 1 gene (CWI1) are expressed in the leaves [Citation10]. Among the SPS genes, SPS1F and SPS4F are strongly expressed in the leaves [Citation11]. Sucrose synthase reversibly catalyzes the reaction of sucrose degradation and sucrose synthesis, and the sucrose synthase genes SUS1 and SUS5 are mainly expressed in the leaves [Citation12]. We analyzed the expression levels of these genes in the leaves harvested during the light and dark periods. Real-time RT-PCR analysis indicated that the amount of transcripts of CWI1, SPS4F, and SUS5 significantly decreased in the fll2 mutant in both the light and dark periods compared with those in WT plants. In addition, the transcripts of SPS1F significantly increased (). The transcripts of VI2 and SUS1 significantly increased in the light period but significantly decreased in the dark period ().
Figure 6. Real-time RT-PCR analysis of the expression of the representative genes involved in the production of sugars and starch. Total RNA prepared from leaves, which were harvested at 8 h after the light period started (left panel) and at 6 h after the dark period started (right panel), was used for real-time RT-PCR analysis. The expression of representative genes is shown relative to that of the wild type, which is set as 1. Each gene name is indicated by a simplified representation as follows: ADG1, ADP-glucose pyrophosphorylase small subunit 1 (At5g48300); ADG2, ADP-glucose pyrophosphorylase large subunit 1 (At5g19220); SS1, starch synthase 1 (At5g24300); SS2, starch synthase 2 (At3g01180); SS4, starch synthase 4 (At4g18240); BE3, starch branching enzyme (At2g36390); GBSS1, granule-bound starch synthase 1 (At1g32900); GWD1, chloroplastic α-glucan water dikinase 1 (At1g10760); GWD3, chloroplastic phosphoglucan water dikinase (At5g26570); BMY1, β-amylase (At4g15210); BAM3, β-amylase 3 (At4g17090); DPE2, 4-α-glucanotransferase 2 (At2g40840); HXK1, hexokinase 1 (At4g29130); VI2, vacuolar invertase (At1g12240); CWI1, cell wall invertase 1 (At3g13790); SPSF1, sucrose phosphate synthase 1 F (At5g20280); SPSF4, sucrose phosphate synthase 4 F (At4g10120); SUS1, sucrose synthase 1 (At5gG20830); and SUS5, sucrose synthase 5 (At5g37180). The transcript of ubiquitin-conjugating enzyme 21 (UBC; AT5g25760) was used as a control. The error bars represent the means ± SDs (n = 3). The means that differed significantly from the wild-type plant are indicated by asterisks (P < 0.05) or double asterisks (P < 0.01)
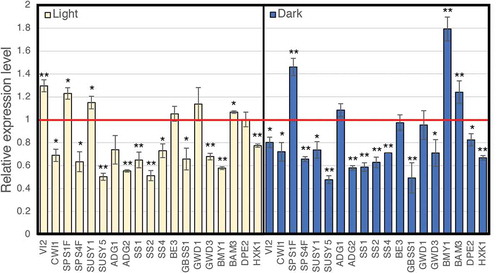
Next, we analyzed the expression level of genes involved in starch biosynthesis. The following genes are involved in starch biosynthesis: the ADP-glucose phosphate pyrophosphorylase (AGPase) large subunit gene ADG2; the starch synthase (SS) genes SS1, SS2 and SS4; and the granule-bound starch synthase (GBSS) gene GBSS1 [Citation13]. Transcripts of these genes were largely decreased in the green leaves of the fll2 mutant in the light and dark periods during the vegetative growth stage (). The amount of the transcripts of the AGPase small subunit gene ADG1 and the BE gene BE3 was similar to that of the WT ().
We analyzed the expression of genes involved in starch degradation and modification. The amount of the transcripts of the α-glucan water dikinase (GWD) gene GWD3 and the Hexokinase-1 gene HXK1 was significantly decreased in the fll2 mutant in both light and dark periods compared to those of the WT (). In addition, the amount of transcripts of the β-amylase gene BAM3 was significantly increased (). On the other hand, the amount of transcripts of the β-amylase gene BMY1 was significantly reduced in the light period but significantly increased in the dark period compared with that of the WT (). The amount of transcripts of the GWD gene GWD1 was similar to that of the WT plants in both light and dark periods (). The amount of 4-α-glucanotransferase (DPE2) transcript decreased significantly in the dark period, but it was approximately the same as that in WT plants in the light period ().
These results indicate that the expression levels of many genes are greatly altered in the fll2 mutant. It is also suggested that the production of hexokinase decreased throughout the whole day and that the production of β-amylase increased in the dark period.
Discussion
Rice FLO2 qualitatively and quantitatively regulates the biosynthesis of seed storage materials [Citation3]. Arabidopsis FLO2 is expressed in leaves and seeds and regulates the control of leaf growth, seed yield, and maintenance of the quality of stored substances [Citation4]. FLL1 and FLL2 are orthologs of FLO2. These have not been functionally analyzed, and therefore, their physiological role is unknown. In this study, we investigated Arabidopsis FLL2, which is expressed specifically in leaves, suggesting that FLL2 has a specific function in leaves.
The growth of A. thaliana can be roughly divided into a vegetative growth period and a reproductive growth period. During the vegetative stage, the fll2 mutant showed an apparent trait of enlarged rosette leaves (). In addition, the bolting time was accelerated (). These observations indicate that the fll2 mutation promotes the plant growth. The seed size was enlarged, and the number of seeds was increased, but no significant increase of each seed weight was observed (). This suggests that density of the fll2 mutant seeds is lower than those of the WT, and that a shortage of seed storage accumulation may have occurred in the fll2 mutant seeds. This also indicates that FLL2 is a factor affecting both the vegetative and reproductive growth stages.
We showed that Arabidopsis REC1 is the same gene as FLL2 [Citation4]. It has been reported that the Arabidopsis rec1 mutant has a reduced number of chloroplasts and smaller cells [Citation14]. However, this paper did not report the function of FLL2 outside of chloroplasts. In the fll2 mutant, we found that the amount of chlorophyll in the green leaves was significantly reduced (). This fact may occur because of a decrease in the amount of chlorophyll due to a decrease in chloroplasts.
In the fll2 mutant, the sucrose content significantly decreased in the green leaves during the vegetative and reproductive stages (). Low levels of glucose and fructose were observed in the green leaves at the early reproductive stage (). In the fll2 mutant, low accumulation of assimilated starch was detected during the period from the vegetative stage to the reproductive growth stags (). At the early reproductive stage, sugars, such as sucrose, are required to form the sink organs. However, it is presumed that a shortage of sugars occurred because a sufficient amount of sugars were not supplied in the fll2 mutant due to insufficient ability of photosynthesis. The results also revealed a decreased expression level of starch synthase genes in the fll2 mutant (). These findings suggest that the fll2 mutation reduces the functions associated with both carbon transport and assimilation of biosynthesized starch.
The efficiency of transport of assimilated carbon is very important for plant growth, and partitioning of photoassimilates is strictly controlled [Citation15,Citation16]. Carbon fixed by photosynthesis not only is used as an energy source for leaf cells but also is converted into sucrose in the cytoplasm and subsequently transported to sink organs via vascular tissue [Citation11,Citation17]. Excess amounts of assimilated carbon are stored in chloroplasts as assimilated starch. During the dark period, assimilated starch is degraded and supplied as substrates for sucrose synthesis and exported to sink organs [Citation9,Citation18]. In mutants showing reduced accumulation of assimilated starch, it has been reported that the products of photosynthesis are diverted to hexose phosphate-mediated sucrose synthesis in the cytosol, and sucrose accumulates in leaves along with hexose, glucose, and fructose [Citation19,Citation20]. Growth inhibition occurs when ADP-glucose, a precursor of starch biosynthesis, accumulates in the leaves [Citation20]. It is known that a large amount of sugars accumulate in leaves when a mutation causes insufficient transport of photosynthetic products from source organs to sink organs [Citation21].
It has been reported in rice and banana that SPS, which is greatly involved in sucrose biosynthesis, is a key factor controlling the translocation of sucrose [Citation22,Citation23]. A. thaliana has multiple SPS genes, of which SPS1F is important and strongly expressed in green leaves [Citation11]. In the fll2 mutant, the expression level of genes involved in biosynthesis of assimilated starch largely decreased, but the expression level of SPS1F significantly increased (). It has been shown that invertase plays an important role in cellular mechanistic processes and directs the use of carbohydrates for growth or storage; therefore, it is thought to be largely involved in the growth, development and storage of sugars in plants [Citation24]. These facts suggest that, in the fll2 mutant, a large amount of photosynthetic products was directly used for plant growth and not used for biosynthesis of assimilated starch in leaves. It is presumed that the products were allocated to intracellular carbon metabolism in the source organs or applied to plant growth. The mutation of this gene caused a change in carbon metabolism. In conclusion, we suggest that FLL2 is an important factor that strongly affects the expression level of genes involved in glucose metabolism in green leaves.
Author contributions
N.S. performed the analysis and cowrote the manuscript. M.K., H.K. and Y.-G.Y performed the analysis, and cowrote and revised the manuscript. R.M., C.K., and Y.I. performed the analyses. N.K. and H.T. revised the manuscript. H.S. conceived the idea, conducted the work, and wrote the manuscript.
Acknowledgments
A. thaliana mutant seeds were obtained from the Arabidopsis Biological Resource Center, Ohio University. We thank M. Ohnuma, K. Taniguchi, M. Hirai, N. Suzui and R. Suzuki for their valuable discussion and technical assistance.
Disclosure statement
No potential conflicts of interest are reported by the authors.
Supplementary material
Supplemental data for this article can be accessed here.
Additional information
Funding
References
- Smith AM, Stitt M. Coordination of carbon supply and plant growth. Plant Cell Environ. 2007 Sep;30(9):1126–1149.
- Kawasaki T, Mizuno K, Shimada H, et al. Coordinated regulation of the genes participating in starch biosynthesis by the rice Floury-2 locus. Plant Physiol. 1996 Jan;110(1):89–96.
- She KC, Kusano H, Koizumi K, et al. A novel factor FLOURY ENDSPERM2 is involved in regulation of rice grain size and starch quality. Plant Cell. 2010 Oct;22(10):3280–3294.
- Kihira M, Taniguchi K, Kaneko C, et al. Arabidopsis thaliana FLO2 is involved in efficiency of photoassimilate translocation, which is associated with leaf growth and aging, yield of seeds and seed quality. Plant Cell Physiol. 2017 Mar 1;58(3):440–450.
- Murashige T, Skoog F. A revised medium for rapid growth and bio assay with tobacco tissue cultures. Physiol Plant. 1962 Jul;15(3):476–497.
- Ausubel FM, Brent R, Kingston RE, et al. (in) Current protocols in molecular biology. New York: John Wiley & Sons; 1987.
- Porra RJ, Thompson WA, Kriedemann PE. Determination of accurate extinction coefficients and simultaneous equations for assaying chlorophylls α and β extracted with four different solvents: verificationof the concentration of chlorophyll standards by atomic absorption spectroscopy. Biochim Biophys Acta. 1989 Aug;975(3):384–394.
- McCleary BV, Charmier LMJ, McKie VA. Critical evaluation of current methodology. Starch. 2019 Jan;71(1–2):1800146.
- Winter H, Huber SC. Regulation of sucrose metabolism in higher plants: localization and regulation of activity of key enzymes. Plant Sci. 2000 Jan;19(1):31–67.
- Sherson SM, Alford HL, Forbes SM, et al. Roles of cell‐wall invertases and monosaccharide transporters in the growth and development of Arabidopsis. J Exp Bot. 2003 Jan;54(382):525–531.
- Volkert K, Debast S, Voll LM, et al. Loss of the two major leaf isoforms of sucrose-phosphate synthase in Arabidopsis thaliana limits sucrose synthesis and nocturnal starch degradation but does not alter carbon partitioning during photosynthesis. J Exp Bot. 2014 Oct;65(18):5217–5229.
- Fallahi H, Scofield GN, Badger MR, et al. Localization of sucrose synthase in developing seed and siliques of Arabidopsis thaliana reveals diverse roles for SUS during development. J Exp Bot. 2008 Sep;59(12):3283–3295.
- Streb S, Zeeman SC. Starch metabolism in Arabidopsis. Arabidopsis Book. 2012 Sep;10:e0160.
- Larkin RM, Stefano G, Ruckle ME, et al. REDUCED CHLOROPLAST COVERAGE genes from Arabidopsis thaliana help to establish the size of the chloroplast compartment. Proc Natl Acad Sci USA. 2016 Feb;113(8):E1116–25.
- Fisher BD. Long distance transport. American Society of Plant Physiologists, Buchanan B, Gruissem W, Jones R, editors. Biochemistry and molecular biology of plants. Chapter 15. NJ USA: John Wily & Sons, 2005:658–710.
- Gibon Y, Pyl ET, Sulpice R, et al. Adjustment of growth, starch turnover, protein content and central metabolism to a decrease of the carbon supply when Arabidopsis is grown in very short photoperiods. Plant Cell Environ. 2009 Jul;32(7):859–874.
- Dennis DT, Brankeley SD. Carbohydrate metabolism. American Society of Plant Physiologists, Buchanan B, Gruissem W, Jones R, editors. Biochemistry and molecular biology of plants. Chapter 13. NJ USA: John Wily & Sons, 2005:567–609.
- Zeeman SC, Rees T. Changes in carbohydrate metabolism and assimilate partitioning in starch-excess mutants of Arabidopsis. Plant Cell Environ. 1999 Nov;22(11):1445–1453.
- Caspar T, Huber SC, Somerville C. Alterations in growth, photosynthesis, and respiration in a starchless mutant of Arabidopsis thaliana (L.) deficient in chloroplast phosphoglucomutase activity. Plant Physiol. 1985 Sep;79(1):11–17.
- Ragel P, Streb S, Feil R, et al. Loss of starch granule initiation has a deleterious effect on the growth of Arabidopsis plants due to an accumulation of ADP-glucose. Plant Physiol. 2013 Sep;163(1):75–85.
- Chen L-Q, Qu X-Q, Hou B-H, et al. Sucrose efflux mediated by SWEET proteins as a key step for phloem transport. Science. 2012 Jan;335(6065):207–211.
- Hirano T, Ucida N, Azuma T, et al. Relationship between export rate of photoassimilates and activation state of sucrose phosphate synthase in submerged floating rice. Jpn J Crop Sci. 1997 Dec;66(4):675–681.
- Choudhury SR, Roy S, Singh SK, et al. Understanding the molecular mechanism of transcriptional regulation of banana Sucrose phosphate synthase (SPS) gene during fruit ripening: an insight into the functions of various cis-acting regulatory elements. Plant Signaling Behav. 2010 Feb;5(5):553–557.
- Ansari MI, Tadav A, Lal R. An-overview on invertase in sugarcane. Bioinformation. 2013 May;9(9):464–465.