
ABSTRACT
This study aims to discover the effects of ursolic acid (UA) on papillary thyroid carcinoma (PTC). Human PTC cells were under UA treatment, and cell viability, clone formation, and apoptosis were measured by MTT assay, clone formation assay, and flow cytometry, respectively. Expressions of apoptosis- and epithelial–mesenchymal transition (EMT)-related markers were determined via qRT-PCR and western blot. Fibronectin-1 (FN1) expression in thyroid carcinoma was analyzed by GEPIA2 and qRT-PCR. The effects of overexpressed FN1 on UA-treated cells were detected following the previous procedures. Cell viability, proliferation, and EMT-related marker expressions were inhibited, while cell apoptosis and apoptosis-related marker expressions were promoted by UA. FN1 was higher expressed in thyroid carcinoma and downregulated by UA. Effects of FN1 on cell viability, proliferation, and apoptosis- and EMT-related marker expressions were partially reversed by UA. UA inhibited human PTC cell viability, proliferation, and EMT but promoted apoptosis via suppressing FN1.
GRAPHICAL ABSTRACT

The anti-tumor effect of Ursolic acid on papillary thyroid carcinoma via suppressing Fibronectin-1
Papillary thyroid carcinoma (PTC) is the most common malignant tumor of the thyroid and accounts for about 80% of all thyroid cancers [Citation1]. PTC can occur at any age and has rarely been diagnosed as a congenital tumor [Citation2], it presents multicentricity in the thyroid and often metastasizes to regional lymph nodes, which leads to the increase of mortality and morbidity [Citation3]. The lack of therapeutic ways for PTC has prompted us to find alternative treatments, such as natural medicines, and discover their possible mechanisms.
Table 1. Primer for qRT-PCR
Ursolic acid (3 β-hydroxy-urs-12-en-28-oic acid; UA) is a natural pentacyclic triterpenoid [Citation4], which is widely found in the peel of various fruits, and in herbs and spices like thyme and rosemary [Citation5]. It possesses many biological activities, such as anti-inflammatory and anti-tumor properties [Citation6]. Specifically, Zerin and colleagues [Citation7] demonstrated that UA had the capacity of down-regulating the expression of TNF-α in RAW 267.4 and A549 cells which were infected with Mycobacterium tuberculosis and Con A-stimulated mouse splenocytes, suggesting that UA might assist in the development of anti-inflammatory drugs. Of note, Kim et al. [Citation8] discovered that UA functioned as a positive role in inducing colorectal cancer cell apoptosis partially via upregulating miR-4500 and inhibiting of STAT3 phosphorylation. Importantly, it has been reported that UA from Trailliaedoxa gracilis induces medullary thyroid carcinoma cell apoptosis, but the mechanism remains unclear [Citation9]. In our study, we were in an attempt to discover the role of UA on PTC and investigate what the mechanism was.
Fibronectin 1 (FN1) is a large adhesive glycoprotein component of the extracellular matrix composed of two nearly identical subunits [Citation10], and exists in two distinct forms: soluble plasma FN1 and low solubility cellular FN1 [Citation11]. As a member of the FN family, FN1 is one of the biomarkers of epithelial–mesenchymal transition (EMT), which is an essential step in cancer progression [Citation12]. For instance, Sun et al. [Citation13] found that expression of FN1 in gastric cancer tissues was upregulated and the FN1 protein expression was positively associated with tumor size, indicating that the FN1 may be a potential indicator of poor prognosis in gastric cancer. More importantly, it has been proved that knockdown of FN1 in thyroid carcinoma significantly reduces cell proliferation, migration, and invasion, suggesting that FN1 overexpression is an important determinant of thyroid cancer aggressiveness [Citation14]. However, whether FN1 could be regulated by UA in PTC remains elusive and that was the focus of our study. Notably, decreased collagen I and FN accumulation has been found in the fibrotic kidney after UA treatment [Citation15]. Therefore, we infer that UA affects EMT progress in PTC cells via regulating FN1.
With the hopes to find a novel breakthrough point and to discover an effective clinical treatment for curing PTC, our study focused on the role of UA and FN1 in the development of PTC.
Materials and methods
Cell culture and transfection
Human thyroid follicular epithelial cell Nthy-ori 3–1 (Catalog: 90,011,609) was purchased from European Collection of Authenticated Cell Cultures (ECACC; Salisbury, UK) and cultured in RPMI-1640 (31,800,022, Solarbio, Beijing, China) which was supplemented with 2 mM Glutamine (IG0390, Solarbio, China) and 10% Fetal Bovine Serum (FBS; 16,140,071, Thermo Fisher Scientific, Waltham, MA, USA). In addition, human PTC cell line IHH-4 and TPC-1 were offered by the Department of Endocrinology of The First Affiliated Hospital of Nanjing Medical University (Nanjing, Jiangsu). And IHH-4 cells were harvested in a 1:1 mixture of Dulbecco’s Modified Eagle Medium (DMEM; D5796, Sigma-Aldrich, St Louis, MO, USA) and RPMI-1640 applied with 10% FBS, and TPC-1 cells were maintained in RPMI-1640 medium supplemented with 10% FBS at 37°C and 5% CO2.
Ursolic acid (UA; U6753, Sigma-Aldrich, St Louis, MO, USA) was purchased with the aim to unveil its effect on human PTC cells. At 24 to 48 h after plating, when cells were at 50–60% confluence, the mediums were changed before starting the treatment with UA. Later, IHH-4 and TPC-1 cells were treated with 5 μmol/L (UA-5) or 10 μmol/L (UA-10) of UA for 4 h, respectively.
pcDNA3.1 plasmid carrying the overexpressed Fibronectin-1 (FN1) was purchased (VT1010, YouBio, Changsha, China) and subsequently transfected into the human PTC cell line (recombinant plasmid group; FN1). Besides, an empty plasmid (empty plasmid group; NC) and non-transfected human PTC cell line (blank control group; Blank) were set up as the controls. The transfection was conducted by using Lipofectamine 2000 reagent (Invitrogen, USA) strictly according to the kit instructions.
Database analysis
FN1 expression in thyroid carcinoma was identified by Gene Expression Profiling Interactive Analysis 2 (GEPIA2; http://gepia2.cancer-pku.cn/#analysis; T = 512, N = 337).
MTT assay
The cell concentration was adjusted to 6.67 × 10⁴/mL, followed by being added into 96-well plate at 96 µL per well, and the cells were incubated at 37°C, 95% humidity and 5% CO2 for 24 h, 48 h, and 72 h, respectively. Before the efficacy of UA was terminated, 20 µL MTT solution (5 mg/mL; KGA315, keyGEN BioTECH, Nanjing, China) was added and then the cells were incubated for another 4 h. After removal of the medium, 150 μL of dimethyl sulfoxide (DMSO; D8370, Solarbio, Beijing, China) was added into each well. The absorbance at 570 nm was measured with a microplate reader (PT-3502, Potenov Technology Co., Ltd., Beijing, China).
Clone formation assay
The cells with UA were digested with 0.25% trypsin and pipetted into individual cells, and then were suspended in 10% FBS in their mediums as previously introduced. Next, 2 mL of cell suspension was added into 6-well plates at the density of 500 cells per well and incubated at 37°C and 5% CO2. After macroscopic clones were shown in the plates, the culture solution was discarded, the cells were washed twice with PBS, fixed with 95% ethanol for 15 min. Later, the cells were stained by the Giemsa staining solution for 20 min at room temperature after the ethanol was discarded. When the plate was dried at the room temperature, the number of visible colonies was counted by naked eyes.
Cell apoptosis assay
Cells were seeded at the density of 6.67 × 10⁴/mL at 6-well plates and applied with UA 24 h later followed by being incubated at 37°C and 5% CO2 for 48 h. Subsequently, the cells were collected and centrifuged for 5 min at 1000 × g and then washed with PBS for twice. Later, 500 µL cell suspension was added, followed by being supplemented with 5 µL Annexin V-FITC and 5 µL Propidium Iodide (CW2574S, Cwbio Co., Ltd., Beijing, China). Finally, the cells were incubated at room temperature without light for 10 min and analyzed by a flow cytometer (NovoCyte Advanteonm, Agilent, USA).
Quantitative real-time polymerase chain reaction (qRT-PCR)
Total RNA was isolated from the cultured cells using the TRIzol reagent (15,596,026, Thermo Fisher Scientific, USA) strictly observed the manufacturer’s instruction. RNA concentration was quantified using a spectrophotometer (NanoDrop Lite, Thermo Fisher Scientific, USA). First Strand cDNA Synthesis Kit (K1612, Thermo Fisher Scientific, USA) was used to synthesize complementary DNA (cDNA) from 2 μg of total RNA. Subsequently, the relative expressions of Bcl-2, Bax, FN1, MMP-2, MMP-9, E-cadherin, N-cadherin, and α-smooth muscle actin (α-SMA) were measured through the SYBR Green PCR Master Mix (RR420A, Takara Biotechnology Co., Ltd., Dalian, China). GAPDH was used as the internal control. All RT-PCR reactions were conducted on the 7500 Real-Time PCR System (Applied Biosystems). The primers used were shown in . The 2−ΔΔCt method was used to calculate the mRNA levels [Citation16].
Western blot
Proteins of cells were prepared by lysing cells in radioimmunoprecipitation assay (RIPA) buffer (sc-24,948, Santa Cruz Biotechnology, Dallas, TX, USA) followed by ultrasonication on ice. Bicinchoninic protein assay (BCA) kit (P0011, Beyotime, China) was employed to measure protein concentration. Extracts were run on a 5% SDS-PAGE gel (PE0018, Leagene Biotechnology Co., Ltd., Beijing, China) and then transferred to polyvinylidene fluoride membranes (PVDF; Beyotime; FFP28) which were blocked by 5% nonfat milk at room temperature for 1 h. The membranes were then incubated overnight at 4ºC with the primary antibodies which include anti-Bcl-2 antibody (rabbit, ab32124, 1:1000, Abcam, UK), anti-Bax antibody (rabbit, ab32503, 1:1000, Abcam, UK), anti-Cleaved (C)-caspase-3 antibody (rabbit, ab2302, 1 µg/mL, Abcam, UK), anti-E-Cadherin antibody (rabbit, ab40772, 1:10,000, Abcam, UK), anti-MMP-2 antibody (rabbit, ab97779, 1:500, Abcam, UK), anti-N-Cadherin antibody (rabbit, ab18203, 1 µg/mL, Abcam, UK), anti-MMP-9 antibody (rabbit, ab38898, 1:1000, Abcam, UK), anti-α-SMA antibody (rabbit, ab32575, 1:1000, Abcam, UK) and anti-GAPDH antibody (mouse, ab181602, 1:10,000, Abcam, UK). GAPDH was used as the internal reference. The membranes were then incubated in the secondary horseradish peroxidase (HRP)-combined antibody: goat anti-rabbit IgG H&L (HRP) (A21020, 1:10,000, Abbkine, Wuhan, China) and goat anti-mouse IgG H&L (HRP) (A21010, 1:10,000, Abbkine, Wuhan, China) for 1 h at room temperature and washed with tris-buffer saline tween (TBST) for three times. Protein bands were identified using ImageQuant 800 ECL biomolecular Imager (GE Healthcare, Marlborough, MA, USA) [Citation14].
Statistical analysis
Standard version 18.0 (SPSS, Chicago, IL, USA) was applied to analyze the data. All data were expressed as the mean ± standard deviation (SD) and each experiment was performed in triplicate. One-way analysis of variance (ANOVA) was used following Dunnett’s post hoc test to analyze the differences among more than two groups. P < 0.05 was considered to indicate a statistically significant difference.
Results
UA inhibited papillary thyroid carcinoma cell viability and clone formation while promoted cell apoptosis
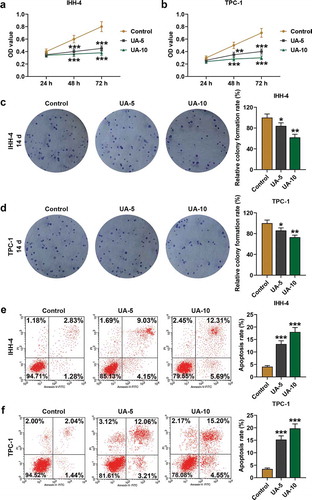
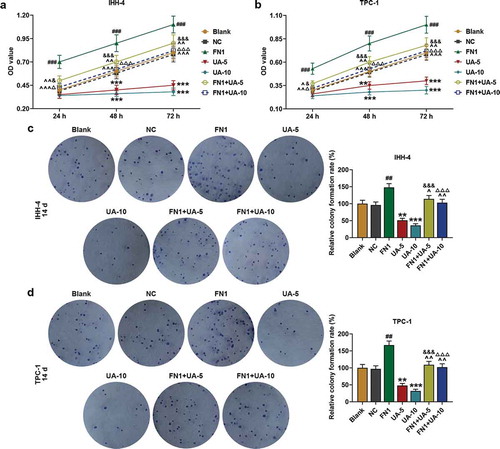
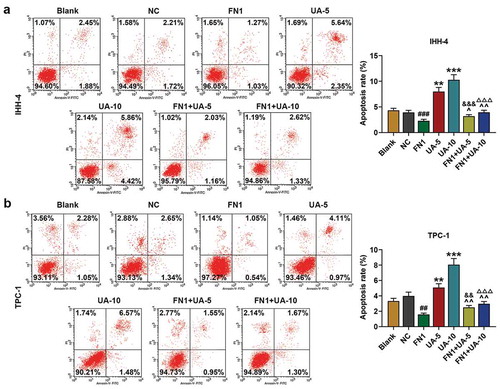
As revealed in ,), the viability of IHH-4 and TPC-1 cells was suppressed by UA treatment in a dose-dependent manner at 48 and 72 h when compared with Control (P < 0.01). In addition, 14 days later, as shown in ,) that clone formation rates of IHH-4 and TPC-1 cells were both down-regulated by UA treatment as in comparison with the Control group (P < 0.05). Meanwhile, according to the results of flow cytometry in ,), cell apoptosis rates were both promoted by UA treatment in a dose-dependent manner when compared with the Control group (P < 0.001). The results above suggested that viability and clone formation of IHH-4 and TPC-1 cells were suppressed while apoptosis was enhanced by UA.
Figure 1. UA inhibited papillary thyroid carcinoma (PTC) cells (IHH-4 and TPC-1 cell) viability and clone formation while promoted cell apoptosis and the effects were positively correlated with UA concentration. (a-b) IHH-4 and TPC-1 cell viability after UA treatment at different concentrations (5 μmol/L or 10 μmol/L) for 24 h, 48 h and 72 h was determined by MTT assay. (c-d) IHH-4 and TPC-1 cell clone formation rate after UA treatment at different concentrations (5 μmol/L or 10 μmol/L) for 14 days was investigated by plate clone formation assay. (e-f) IHH-4 and TPC-1 cell apoptosis after UA treatment at different concentrations (5 μmol/L or 10 μmol/L) for 48 h was measured by flow cytometry. All experiments have been performed in triplicate and experimental data were expressed as mean ± standard deviation (SD). (*P < 0.05, **P < 0.01, ***P < 0.001, vs. Control) UA: ursolic acid
UA promoted papillary thyroid carcinoma cell proapoptotic proteins expression but inhibited EMT progress
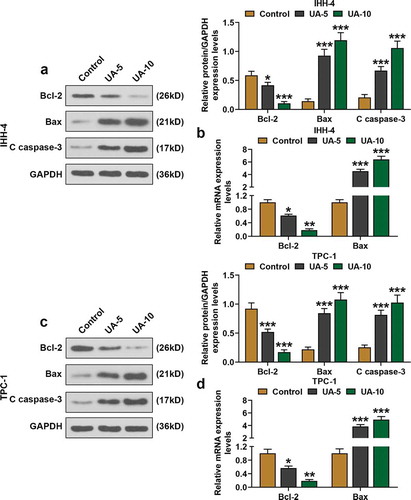
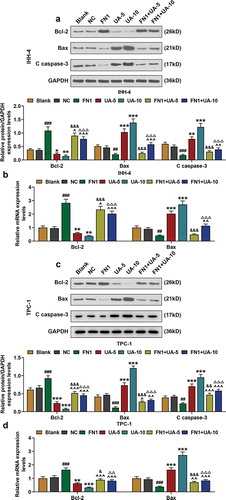
As exhibited in –), Bcl-2 expression in IHH-4 and TPC-1 cells was decreased by UA treatment in a dose-dependent manner when compared with the Control group (P < 0.05). On the contrary, expressions of Bax and C-caspase-3 of IHH-4 and TPC-1 cells were enhanced in UA-5 group and UA-10 group as in comparison with Control group, and the higher the UA concentration was, the stronger the boost effect could be, suggesting that proapoptotic protein expressions were promoted by UA (–), P < 0.001).
Figure 2. UA promoted papillary thyroid carcinoma (PTC) cells proapoptotic proteins expressions. (a) Relative protein expressions of Bcl-2, Bax, and C(cleaved)-caspase-3 expressions in IHH-4 cell after UA treatment (5 μmol/L or 10 μmol/L) were detected by western blot. GAPDH was used as an internal reference. (b) Relative mRNA expressions of Bcl-2 and Bax in IHH-4 cell after UA treatment (5 μmol/L or 10 μmol/L) were measured by quantitative real-time polymerase chain reaction (qRT-PCR). GAPDH was used as an internal reference. (c) Relative protein expressions of Bcl-2, Bax, and C(cleaved)-caspase-3 expressions in TPC-1 cell after UA treatment (5 μmol/L or 10 μmol/L) were detected by western blot. GAPDH was used as an internal reference. (d) Relative mRNA expressions of Bcl-2 and Bax in TPC-1 cell after UA treatment (5 μmol/L or 10 μmol/L) were measured by qRT-PCR. GAPDH was used as an internal reference. All experiments have been performed in triplicate and experimental data were expressed as mean ± standard deviation (SD). (*P < 0.05, **P < 0.01, ***P < 0.001, vs. Control) Bax: Bcl-2 Associated X Protein
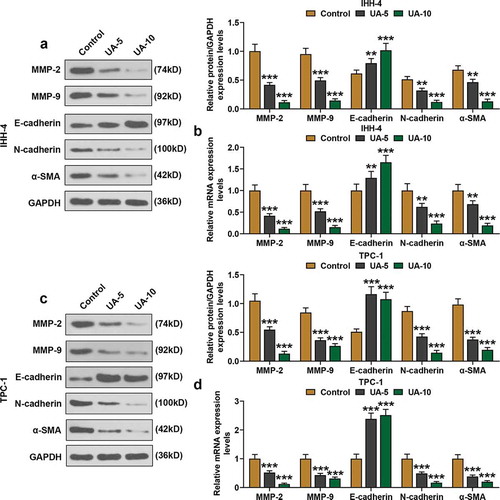
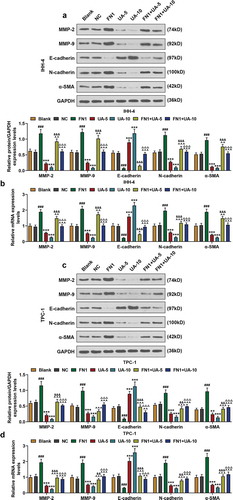
Moreover, the expressions of EMT-related proteins, MMP-2, MMP-9, E-cadherin, N-cadherin, and α-SMA were detected by qRT-PCR and western blot. As shown in –), the expressions of MMP-2, MMP-9, N-cadherin, and α-SMA of IHH-4 and TPC-1 cells were suppressed by UA treatment in a dose-dependent manner as in comparison with Control group (P < 0.01). However, E-cadherin expression of IHH-4 and TPC-1 cells in the UA-5 group and UA-10 group was increased when compared with the Control group, and the boost effect was positively correlated with UA concentration (–), P < 0.01). In line with the results above, it was clear that EMT progress of IHH-4 and TPC-1 cells was inhibited by UA.
Figure 3. UA inhibited EMT of papillary thyroid carcinoma (PTC) cells. (a-d) Expressions of EMT-related proteins (MMP-2, MMP-9, E-cadherin, N-cadherin and α-SMA) in IHH-4 and TPC-1 cell after UA treatment (5 μmol/L or 10 μmol/L) were measured by qRT-PCR and western blot. GAPDH was used as an internal reference. All experiments have been performed in triplicate and experimental data were expressed as mean ± standard deviation (SD). (**P < 0.01, ***P < 0.001, vs. Control) α-SMA: α-smooth muscle actin; MMP2: Matrix Metallopeptidase 2; MMP9: Matrix Metallopeptidase 9; EMT: epithelial-to-mesenchymal transition
UA suppressed FN1 expression in papillary thyroid carcinoma cells
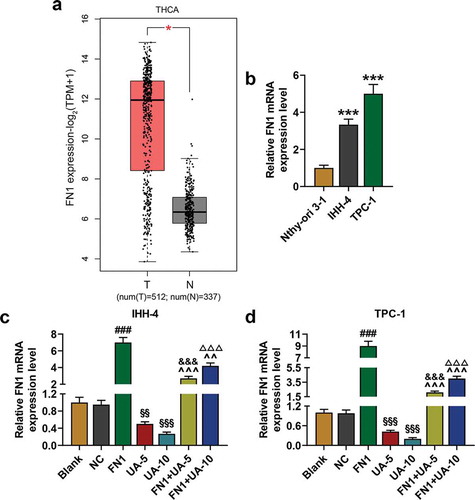
Database GEPIA2 showed that FN1 was higher expressed in thyroid carcinoma (), T = 512, N = 337). And we found that FN1 expression in IHH-4 and TPC-1 cells was higher than that of Nthy-ori 3–1 cells (), P < 0.001). Therefore, in order to further uncover the role of FN1 on human PTC, FN1 overexpression plasmid was successfully transfected into IHH-4 and TPC-1 cells (,)). The qRT-PCR analysis revealed that FN1 expression in IHH-4 and TPC-1 cells was reduced by UA treatment when compared with Blank group (,), P < 0.01). And UA-5 or UA-10 treatment reduced the expression of FN1 in the FN1+ UA-5 and FN1+ UA-10 group, which further suggested that UA suppressed FN1 expression in cells (,), P < 0.01).
Figure 4. FN1 was higher expressed in thyroid carcinoma and UA suppressed FN1 expression in IHH-4 and TPC-1 cell. (a) FN1 expression in thyroid carcinoma was identified by Gene Expression Profiling Interactive Analysis 2 (GEPIA2; T = 512, N = 337). (b) Relative mRNA expression of FN1 in IHH-4, TPC-1 and Nthy-ori 3–1 cells was detected by qRT-PCR. GAPDH was used as an internal reference. (c-d) Relative mRNA expression of FN1 in IHH-4 and TPC-1 cell after transfection and different concentrations (5 μmol/L or 10 μmol/L) of UA treatment was measured through qRT-PCR. GAPDH was used as an internal reference. All experiments have been performed in triplicate and experimental data were expressed as mean ± standard deviation (SD). (***P < 0.001, vs. Nthy-ori 3–1; ###P < 0.001, vs. NC; &&&P < 0.001, vs. UA-5; ΔΔΔP<0.001, vs. UA-10; ^^P < 0.01, ^^^P < 0.001, vs. FN1; §§P < 0.01, §§§P < 0.001, vs. Blank) FN1: Fibronectin-1
FN1 enhanced papillary thyroid carcinoma cell viability and clone formation while suppressed cell apoptosis, which was partially reversed by UA
As shown in –), after transfection of FN1 overexpression plasmid, the IHH-4 and TPC-1 cell viability and clone formation in the FN1 group were higher than that of NC group (P < 0.01). In addition, in the FN1+ UA-5 and FN1+ UA-10 group, cell viability and clone formation were lower than that of the FN1 group, but were higher than that of the UA-5 and UA-10 group (–), P < 0.05). These findings suggested that IHH-4 and TPC-1 cell viability and clone formation were promoted by overexpressed FN1, which was partially reversed by UA treatment.
Figure 5. FN1 enhanced papillary thyroid carcinoma (PTC) cells viability and clone formation, which was partially reversed by UA. (a-b) IHH-4 and TPC-1 cell viability after transfection of FN1 overexpression plasmid and treatment of UA (5 μmol/L or 10 μmol/L) for 24 h, 48 h and 72 h was measured by MTT assay. (c-d) IHH-4 and TPC-1 cell clone formation after transfection of FN1 overexpression plasmid and treatment of UA (5 μmol/L or 10 μmol/L) for 14 days was detected by plate clone formation assay. All experiments have been performed in triplicate and experimental data were expressed as mean ± standard deviation (SD). (**P < 0.01, ***P < 0.001, vs. Blank; ##P < 0.01, ###P < 0.001, vs. NC; ^P < 0.05, ^^P < 0.01, ^^^P < 0.001, vs. FN1; &P < 0.05, &&&P < 0.001, vs. UA-5; ΔP<0.05, ΔΔΔP<0.001, vs. UA-10) NC: negative control
And the results of flow cytometry are shown in ,), it was clear that apoptosis rates of IHH-4 and TPC-1 cells were decreased in FN1 group compared with NC group (P < 0.01). Furthermore, UA treatment partially reversed the inhibitory effect of FN1 on apoptosis rates of cells (,), P < 0.01). The experimental data demonstrated that IHH-4 and TPC-1 cell apoptosis was inhibited via overexpressed FN1, which was partially reversed by UA treatment.
Figure 6. FN1 suppressed papillary thyroid carcinoma (PTC) cells apoptosis, which was partially reversed by UA. (a-b) IHH-4 and TPC-1 cell apoptosis after transfection of FN1 overexpression plasmid and treatment of UA (5 μmol/L or 10 μmol/L) for 48 h was detected by flow cytometry. All experiments have been performed in triplicate and experimental data were expressed as mean ± standard deviation (SD). (**P < 0.01, ***P < 0.001, vs. Blank; ##P < 0.01, ###P < 0.001, vs. NC; ^P < 0.05, ^^P < 0.01, vs. FN1; &&P < 0.01, &&&P < 0.001, vs. UA-5; ΔΔΔP<0.001, vs. UA-10)
FN1 suppressed papillary thyroid carcinoma cell proapoptotic proteins expression, which was partially reversed by UA
In this phase, qRT-PCR and western blot were employed to detect the expressions of apoptosis proteins (Bcl-2, Bax, and C-caspase-3) in IHH-4 and TPC-1 cells after transfection of FN1 overexpression plasmid and UA treatment. As exhibited in –), Bcl-2 expression of IHH-4 and TPC-1 cells in FN1 group was obviously higher than that of NC group (P < 0.001), and when compared with Blank group, Bcl-2 expression was decreased after UA treatment in a dose-dependent manner (P < 0.05). Besides, in FN1+ UA-5 and FN1+ UA-10 group, Bcl-2 expression was reduced when compared with the FN1 group, but was increased compared with UA-5 or UA-10 group (–), P < 0.05). And in –), the expressions of Bax and C-caspase-3 showed a reduction as in comparison with FN1 group (P < 0.05), and when compared with Blank group, their expressions were obviously up-regulated after UA treatment in a dose-dependent manner (P < 0.01). Meanwhile, in FN1+ UA-5 and FN1+ UA-10 group, the expressions of Bax and C-caspase-3 were decreased when compared with UA-5 or UA-10 group, but they were increased as in comparison with the FN1 group (–), P < 0.05). The results above demonstrated that proapoptotic protein expression in IHH-4 and TPC-1 cells was reduced by overexpressed FN1, which was partially reversed by UA treatment.
Figure 7. FN1 suppressed papillary thyroid carcinoma (PTC) cells pro-apoptotic proteins expression, which was partially reversed by UA. (a) Relative protein expressions of Bcl-2, Bax, and C (cleaved)-caspase-3 expressions in IHH-4 cell after transfection of FN1 overexpression plasmid and UA treatment (5 μmol/L or 10 μmol/L) were detected by western blot. GAPDH was used as an internal reference. (b) Relative mRNA expressions of Bcl-2 and Bax in IHH-4 cell after transfection of FN1 overexpression plasmid and UA treatment (5 μmol/L or 10 μmol/L) were measured by qRT-PCR. GAPDH was used as an internal reference. (c) Relative protein expressions of Bcl-2, Bax, and C (cleaved)-caspase-3 expressions in TPC-1 cell after transfection of FN1 overexpression plasmid and UA treatment (5 μmol/L or 10 μmol/L) were detected by western blot. GAPDH was used as an internal reference. (d) Relative mRNA expressions of Bcl-2 and Bax in TPC-1 cell after transfection of FN1 overexpression plasmid and UA treatment (5 μmol/L or 10 μmol/L) were measured by qRT-PCR. GAPDH was used as an internal reference. All experiments have been performed in triplicate and experimental data were expressed as mean ± standard deviation (SD). (*P < 0.05, **P < 0.01, ***P < 0.001, vs. Blank; #P < 0.05, ##P < 0.01, ###P < 0.001, vs. NC; ^P < 0.05, ^^P < 0.01, ^^^P < 0.001, vs. FN1; &P < 0.05, &&&P < 0.001, vs. UA-5; ΔP<0.05, ΔΔP<0.01,ΔΔΔP<0.001, vs. UA-10)
FN1 promoted papillary thyroid carcinoma cell EMT, which was partially reversed by UA
With the aim to discover the role of FN1 on the EMT of PTC cells, the expressions of EMT-related proteins (MMP-2, MMP-9, E-cadherin, N-cadherin, and α-SMA) in IHH-4 and TPC-1 cells after transfection of FN1 overexpression plasmid and UA treatment were measured by qRT-PCR and western blot. As exhibited in –), expressions of MMP-2, MMP-9, N-cadherin, and α-SMA of IHH-4 and TPC-1 cells were significantly increased in FN1 group compared with NC group (P < 0.01). And in FN1+ UA-5 group, their expressions were higher than that of UA-5 group but lower than that of FN1 group, and in FN1+ UA10 group their expressions were also higher than that of UA-10 group but they showed a reduction when compared with FN1 group (–), P < 0.01). On the contrary, E-cadherin expression of IHH-4 and TPC-1 cells were obviously decreased in FN1 group compared with the NC group (–), P < 0.001). Besides, in FN1+ UA-5 group, E-cadherin expression was lower than that of UA-5 group but was higher than that of FN1 group (–), P < 0.05), and in FN1+ UA10 group, E-cadherin expression was reduced when compared with UA-10 group but was promoted as in comparison with FN1 group (–), P < 0.01). These findings above proved that EMT progress of IHH-4 and TPC-1 cells was enhanced by overexpressed FN1, which was partially reversed by UA treatment.
Figure 8. FN1 regulated EMT-related proteins in papillary thyroid carcinoma (PTC) cells, which was partially reversed by UA. (a-b) Expressions of EMT-related proteins (MMP-2, MMP-9, E-cadherin, N-cadherin and α-SMA) in IHH-4 cell after transfection of FN1 overexpression plasmid and UA treatment (5 μmol/L or 10 μmol/L) were measured through qPCR and western blot. GAPDH was used as an internal reference. (c-d) Expressions of EMT-related proteins in TPC-1 cell after transfection of FN1 overexpression plasmid and UA treatment (5 μmol/L or 10 μmol/L) were detected by qRT-PCR and western blot. GAPDH was used as an internal reference. All experiments have been performed in triplicate and experimental data were expressed as mean ± standard deviation (SD). (**P < 0.01, ***P < 0.001, vs. Blank; ###P < 0.001, vs. NC; ^P < 0.05, ^^P < 0.01, ^^^P < 0.001, vs. FN1; &&P < 0.01, &&&P < 0.001, vs. UA-5; ΔΔΔP<0.001, vs. UA-10) EMT: epithelial-to-mesenchymal transition
Discussion
Novel targeted therapies are necessary for the 20–30% of PTC patients who fail to respond to treatment based on surgery plus radioiodine therapy [Citation14]. In recent years, the attention of medicinal herbs for the identification of novel drugs has increased, and a great deal of lists of plant extracts, which are identified with health benefits, have been compiled and show an increasing trend [Citation17]. Therefore, investigating the natural medicines and discover their possible mechanisms may provide a novel treatment for PTC.
Triterpenoids have been used as ingredients of herb extracts employed in traditional medicine, and ursolic acid (UA) is a pentacyclic triterpenoid [Citation18]. Numerous studies have revealed the beneficial effects of UA that targeted cancer cell metabolism in humans [Citation19]. Data demonstrated that UA inhibited tumorigenesis and cancer cell proliferation, modulated apoptosis, and cell cycle progression and promoted autophagy [Citation20]. And in the current study, we uncovered that the viability and proliferation of PTC cells were suppressed by UA treatment in a dose-dependent manner. Moreover, in line with the findings of Lewinska et al. [Citation21], UA caused G0/G1 cell cycle arrest in breast cancer cells and induced cell apoptosis which was mediated by down-regulation phospho-ERK1/2 signals and depolarization of mitochondrial membrane potential. Moreover, the study of Yu et al. [Citation22] demonstrated that UA induced cell cycle arrest and apoptosis in the human hepatoma via activating the p53 pathway. In addition, it has been reported that UA leads to medullary thyroid carcinoma cell apoptosis [Citation9] and significantly reduced the proliferation of thyroid anaplastic carcinoma [Citation23], suggesting that UA might be a potential anti-thyroid carcinoma drug but the mechanism still needed further investigation. In the present study, we found that proapoptotic protein Bax was up-regulated while the antiapoptotic protein Bcl-2 was downregulated in PTC cell lines following treatment with UA. Meanwhile, the expression of C-caspase-3, which was known as a major mediator of apoptosis activated during cellular exposure to cytotoxic drugs, radiotherapy, or immunotherapy [Citation24], was also enhanced in PTC cells after UA treatment, indicating that UA promoted PTC cell apoptosis.
During cancer progression, the extracellular matrix (ECM) of the tissue in which the tumor grows is extensively remodeled [Citation25]. FN is a high-molecular-weight glycoprotein component of the ECM that orchestrates complex cell adhesion and signaling through cell surface integrin receptors during tissue development and remodeling [Citation26], which has been demonstrated to be involved in cell migration, differentiation, proliferation, and metastasis, as well as blood coagulation, embryogenesis, and wound healing [Citation27]. FN1 encodes FN, which functions as an important role in the soluble dimeric form in the plasma and in the dimeric or multimeric form at the cell surface and in the extracellular matrix [Citation12]. As a member of the FN family, FN1 exerts different functions during a variety of biological processes in diseases such as cancer, atherosclerosis, and arthritis [Citation28]. FN1was shown to activate specific matrix metalloproteinases to promote breast cancer invasion and metastasis [Citation29]. Importantly, Zhang et al. [Citation30] discovered that FN1 was highly expressed in PTC. Therefore, FN1 expression was an indicator of cancer cell status. The experimental data in our study uncovered that FN1 suppressed PTC cell line apoptosis but enhanced cell viability and proliferation, which was consistent with the findings of the previous study [Citation31]. Interestingly, on the basis of the further investigation of the relationship between UA and FN1, our findings unveiled that the facilitating effects of FN1 on PTC cell viability, proliferation but suppressive effects on apoptosis were partially reversed by UA.
EMT is a biological process involved in embryonic development that allows a polarized epithelial cell to lose their epithelial features that enable it to assume a mesenchymal cell phenotype [Citation32]. Importantly, EMT progress functions as an essential role in various pathological processes, including cancer progression [Citation33]. Loss of E-cadherin and the gain of N-cadherin expression are the most important features of EMT [Citation34]. MMP-2 and MMP-9 are two members of MMP family which play a vital role in tumor invasiveness and metastasis [Citation35], and the expressions of MMP2 and MMP9 were up-regulated in the EMT progress [Citation36]. Meanwhile, α-SMA was typically expressed in the vascular smooth muscle cells contributing to vascular motility and contraction [Citation37], and it had been verified that α-SMA played a dual role in promoting EMT process [Citation38]. In the present study, we found that expressions of MMP-2, MMP-9, N-cadherin, and α-SMA were down-regulated while E-cadherin expression was up-regulated via UA, and FN1 overexpression caused the opposite function. It was worth noting that the promotive effect of FN1 on EMT in PTC cells was partially reversed by UA.
Studies have shown that FN1 can regulate cell proliferation, apoptosis, senescence, and EMT by PI3K/AKT signaling pathway [Citation39,Citation40]. In addition, studies also showed that UA alleviated high glucose-mediated mesangial cell injury [Citation41] and induced apoptosis of a variety of cancer cells via PI3K/AKT signaling pathway [Citation42,Citation43]. Whether UA and FN1 could also promote apoptosis of thyroid papillary cancer cells through PI3K/AKT pathway, and inhibit proliferation and EMT needs further study. In this study, we found that UA treatment could inhibit the FN1 expression, while the regulation mechanism of UA inhibiting FN1 expression needs to be further explored. However, our study was lack of equivalent experimental verification in an animal in vivo model, and our results need to be confirmed in more cell lines. Therefore, further researches in vivo were needed.
Taken together, the investigations in our study demonstrated that UA could inhibit PTC viability, proliferation, and EMT but promoted apoptosis via suppressing FN1 expression. These discoveries may offer a promising therapeutic method for PTC.
Authors’ contributions
MC and DX designed the research study. MC and XD performed the research. DX and XD analyzed the data. MC and DX wrote the manuscript. All authors contributed to editorial changes in the manuscript. All authors read and approved the final manuscript.
Data availability statement
The analyzed data sets generated during the study are available from the corresponding author on reasonable request.
Disclosure statement
The authors declare no conflicts of interest.
Additional information
Funding
References
- Liu F, Lou K, Zhao X, et al. miR-214 regulates papillary thyroid carcinoma cell proliferation and metastasis by targeting PSMD10. Int J Mol Med. 2018;42(6):3027–3036.
- Abdullah MI, Junit SM, Ng KL, et al. Papillary thyroid cancer: genetic alterations and molecular biomarker investigations. Int J Med Sci. 2019;16(3):450–460.
- Li M, Chai H-F, Peng F, et al. Estrogen receptor β upregulated by lncRNA-H19 to promote cancer stem-like properties in papillary thyroid carcinoma. Cell Death Dis. 2018;9(11):1120.
- Mlala S, Oyedeji AO, Gondwe M, et al. Ursolic acid and its derivatives as bioactive agents. Molecules. 2019;24(15).
- Achiwa Y, Hasegawa K, Komiya T, et al. Ursolic acid induces Bax-dependent apoptosis through the caspase-3 pathway in endometrial cancer SNG-II cells. Oncol Rep. 2005;13(1):51–57.
- Sultana N. Clinically useful anticancer, antitumor, and antiwrinkle agent, ursolic acid and related derivatives as medicinally important natural product. J Enzyme Inhib Med Chem. 2011;26(5):616–642.
- Zerin T, Lee M, Jang WS, et al. Anti-inflammatory potential of ursolic acid in Mycobacterium tuberculosis-sensitized and concanavalin A-stimulated cells. Mol Med Rep. 2016;13(3):2736–2744.
- Kim K, Shin EA, Jung JH, et al. Ursolic acid induces apoptosis in colorectal cancer cells partially via upregulation of MicroRNA-4500 and inhibition of JAK2/STAT3 phosphorylation. Int J Mol Sci. 2018;20(1).
- Aguiriano-Moser V, Svejda B, Li Z-X, et al. Ursolic acid from Trailliaedoxa gracilis induces apoptosis in medullary thyroid carcinoma cells. Mol Med Rep. 2015;12(4):5003–5011.
- Goossens K, Van Soom A, Van Zeveren A, et al. Quantification of fibronectin 1 (FN1) splice variants, including two novel ones, and analysis of integrins as candidate FN1 receptors in bovine preimplantation embryos. BMC Dev Biol. 2009;9:1.
- Missirlis D, Haraszti T, Kessler H, et al. Fibronectin promotes directional persistence in fibroblast migration through interactions with both its cell-binding and heparin-binding domains. Sci Rep. 2017;7(1):3711.
- Xia S, Wang C, Postma EL, et al. Fibronectin 1 promotes migration and invasion of papillary thyroid cancer and predicts papillary thyroid cancer lymph node metastasis. Onco Targets Ther. 2017;10:1743–1755.
- Sun Y, Zhao C, Ye Y, et al. High expression of fibronectin 1 indicates poor prognosis in gastric cancer. Oncol Lett. 2020;19(1).
- Sponziello M, Rosignolo F, Celano M, et al. Fibronectin-1 expression is increased in aggressive thyroid cancer and favors the migration and invasion of cancer cells. Mol Cell Endocrinol. 2016;431:123–132.
- Xu C-G, Zhu X-L, Wang W, et al. Ursolic acid inhibits epithelial-mesenchymal transition in vitro and in vivo. Pharm Biol. 2019;57(1):169–175.
- Livak KJ, Schmittgen TD. Analysis of relative gene expression data using real-time quantitative PCR and the 2(-Delta Delta C(T)) method. Methods. 2001 Dec;25(4):402–408.
- Aggarwal BB, Shishodia S. Molecular targets of dietary agents for prevention and therapy of cancer. Biochem Pharmacol. 2006;71(10):1397–1421.
- Hill RA, Connolly JD. Triterpenoids. Nat Prod Rep. 2013;30(7):1028–1065.
- Wu -C-C, Huang Y-F, Hsieh C-P, et al. Combined use of zoledronic acid augments ursolic acid-induced apoptosis in human osteosarcoma cells through enhanced oxidative stress and autophagy. Molecules. 2016;21(12):1640.
- Kashyap D, Tuli HS, Sharma AK. Ursolic acid (UA): a metabolite with promising therapeutic potential. Life Sci. 2016;146:201–213.
- Lewinska A, Adamczyk-Grochala J, Kwasniewicz E, et al. Ursolic acid-mediated changes in glycolytic pathway promote cytotoxic autophagy and apoptosis in phenotypically different breast cancer cells. Apoptosis. 2017;22(6):800–815.
- Yu Y-X, Gu Z-L, Yin J-L, et al. Ursolic acid induces human hepatoma cell line SMMC-7721 apoptosis via p53-dependent pathway. Chin Med J. 2010;123(14):1915–1923.
- Bonaccorsi I, Altieri F, Sciamanna I, et al. Endogenous reverse transcriptase as a mediator of ursolic acid’s anti-proliferative and differentiating effects in human cancer cell lines. Cancer Lett. 2008;263(1):130–139.
- Zhou M, Liu X, Li Z, et al. Caspase-3 regulates the migration, invasion and metastasis of colon cancer cells. Int J Cancer. 2018;143(4):921–930.
- Bonnans C, Chou J, Werb Z. Remodelling the extracellular matrix in development and disease. Nat Rev Mol Cell Biol. 2014;15(12):786–801.
- Cao L, Nicosia J, Larouche J, et al. Detection of an integrin-binding mechanoswitch within fibronectin during tissue formation and fibrosis. ACS Nano. 2017;11(7):7110–7117.
- Xiao J, Yang W, Xu B, et al. Expression of fibronectin in esophageal squamous cell carcinoma and its role in migration. BMC Cancer. 2018;18(1):976.
- Chen HB, Zheng HT. MicroRNA-200c represses migration and invasion of gastric cancer SGC-7901 cells by inhibiting expression of fibronectin 1. Eur Rev Med Pharmacol Sci. 2017;21(8):1753–1758.
- Qian P, Zuo Z, Wu Z, et al. Pivotal role of reduced let-7g expression in breast cancer invasion and metastasis. Cancer Res. 2011;71(20):6463–6474.
- Zhang H, Yang L, Liu Z, et al. iTRAQ-coupled 2D LC/MS-MS analysis of CXCR7-transfected papillary thyroid carcinoma cells: A new insight into CXCR7 regulation of papillary thyroid carcinoma progression and identification of potential biomarkers. Oncol Lett. 2017;14(3):3734–3740.
- Ye Y, Zhuang J, Wang G, et al. MicroRNA-139 targets fibronectin 1 to inhibit papillary thyroid carcinoma progression. Oncol Lett. 2017;14(6):7799–7806.
- Terry S, Chouaib S. EMT in immuno-resistance. Oncoscience. 2015;2(10):841–842.
- Shibue T, Weinberg RA. EMT, CSCs, and drug resistance: the mechanistic link and clinical implications. Nat Rev Clin Oncol. 2017;14(10):611–629.
- Sun L, Fang J. Epigenetic regulation of epithelial-mesenchymal transition. Cell Mol Life Sci. 2016;73(23):4493–4515.
- Lotfi A, Mohammadi G, Tavassoli A, et al. Serum levels of MMP9 and MMP2 in patients with oral squamous cell carcinoma. Asian Pac J Cancer Prev. 2015;16(4):1327–1330.
- Sun L, Zhang Y, Lou J. ARHGAP9 siRNA inhibits gastric cancer cell proliferation and EMT via inactivating Akt, p38 signaling and inhibiting MMP2 and MMP9. Int J Clin Exp Pathol. 2017;10(12):11979–11985.
- Yuan S-M. α-smooth muscle actin and ACTA2 gene expressions in vasculopathies. Braz J Cardiovasc Surg. 2015;30(6):644–649.
- Ding L, Zhang Z, Shang D, et al. α-Smooth muscle actin-positive myofibroblasts, in association with epithelial-mesenchymal transition and lymphogenesis, is a critical prognostic parameter in patients with oral tongue squamous cell carcinoma. J Oral Pathol Med. 2014;43(5):335–343.
- Liao YX, Zhang ZP, Zhao J, et al. Effects of fibronectin 1 on Cell proliferation, senescence and apoptosis of human glioma cells through the PI3K/AKT signaling pathway. Cell Physiol Biochem. 2018;48(3):1382–1396.
- Li B, Shen W, Peng H, et al. Fibronectin 1 promotes melanoma proliferation and metastasis by inhibiting apoptosis and regulating EMT. Onco Targets Ther. 2019;12:3207–3221.
- Wang EM, Fan QL, Yue Y, et al. Ursolic acid attenuates high glucose-mediated mesangial cell injury by inhibiting the phosphatidylinositol 3-kinase/Akt/mammalian target of rapamycin (PI3K/Akt/mTOR) signaling pathway. Med Sci Monit. 2018 Feb 11;(24):846–854.
- Lee KC, Chen YL, Lin PY, et al. Ursolic acid-induced apoptosis via regulation of the PI3K/Akt and MAPK signaling pathways in Huh-7 cells. Molecules. 2018 Aug 13;23(8).
- Luo J, Hu YL, Wang H. Ursolic acid inhibits breast cancer growth by inhibiting proliferation, inducing autophagy and apoptosis, and suppressing inflammatory responses via the PI3K/AKT and NF-κB signaling pathways in vitro. Exp Ther Med. 2017 Oct;14(4):3623–3631.