
 ?Mathematical formulae have been encoded as MathML and are displayed in this HTML version using MathJax in order to improve their display. Uncheck the box to turn MathJax off. This feature requires Javascript. Click on a formula to zoom.
ABSTRACT
In this paper, the high-temperature constitutive behaviour of an additively manufactured ductile nickel-based superalloy is investigated and modelled, with application to thermomechanical fatigue, low-cycle fatigue and creep conditions at temperatures up to C. Thermomechanical fatigue tests have been performed on smooth specimens in both in-phase and out-of-phase conditions at a temperature range of
C, and creep tests at
C,
C,
C and
C. Additionally, low-cycle fatigue tests at different strain ranges and load ratios have been performed at
C, and tensile tests have been performed at
C,
C and
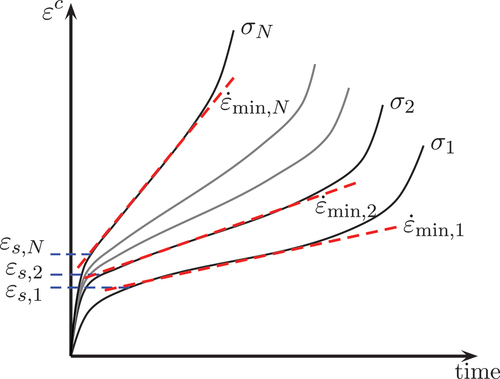
C. A clear anisotropic mechanical response is obtained in the experiments, where the anisotropic effects are larger at high stress levels in creep loadings. To capture this behaviour, a rate-dependent strain based on a double-Norton model has been adopted in the model, by which the creep and mid-life response of the thermomechanical fatigue tests can be simulated with good accuracy.
Introduction
Additive manufacturing (AM) is of great interest to the industry, since it enables for the creation of very complex geometries, with a higher flexibility to optimise components with respect to, e.g., performance, efficiency and lead-time. One application of AM is combustor components in gas turbines, where the manufacturing technique has successively been used for several years to repair burner tips [Citation1], and also to manufacture complete burners [Citation2]. Although AM has many advantages when designing complex parts, the manufacturing technique leads to anisotropic mechanical behaviour, cf. [Citation3–6], which adds complexity in the prediction and modelling of the constitutive behaviour and component life.
Combustor components in gas turbines are exposed to very complex loadings, with high- temperature gradients during start-up and shut-down of the turbine, which also induce inelastic mechanical deformations in the components. During steady-state operation, the high-temperature environment also leads to time-dependent deformations of the components.
With increasing usage of renewable energy sources, stationary gas turbines are more frequently used to stabilise the power grid, when output from intermittent energy sources such as solar and wind power is insufficient. Therefore, the cyclic thermal and mechanical loads on gas turbine components have increased. Thermomechanical fatigue (TMF), where mechanical load and temperature are varied during the start-up, steady-state and shut-down cycle, is one of the most damaging load conditions in a gas turbine. Furthermore, isothermal low-cycle fatigue (LCF) conditions can also be present in a component that is not directly exposed to the most hot gases. In order to predict the life of such components, an accurate constitutive description of the material for these loading conditions is of great importance. However, to set up such a model, accounting for more time-independent inelastic deformations at low temperature, interactions between time-dependent and time-independent deformations during intermediate temperatures and more dominating time-dependent deformations during high temperatures, is a challenging task.
Constitutive models to predict the TMF behaviour of AM alloys are at this point very limited, where one contribution was done by Lindström et al. [Citation7] describing the TMF response of a ductile nickel-based superalloy up to C. However, the temperatures in combustor components can reach even higher temperatures, and a description of the behaviour at higher temperatures is therefore needed. For other loading conditions, such as monotonic tensile, creep and LCF conditions, more work has been done on AM materials, cf. [Citation6,Citation8–12]. For conventionally manufactured materials, modelling of the constitutive behaviour for TMF conditions of both isotropic and anisotropic engineering materials is more widely studied, cf. [Citation13–16]. In general, such constitutive models are based on power law functions of the inelastic strain. Additionally, the aim is often to simulate the continuous cycle-by-cycle response, which is important for lifing assessments based on continuous damage models [Citation17]. However, for fatigue life estimations based on the stabilised material response, usually referred to as mid-life, only the material behaviour at the stabilised state is of importance, and modelling can be focused on simulating the mid-life state with reasonable accuracy. Most importantly, the parameters used in the fatigue lifing model should be sufficiently predicted. For loadings generating inelastic deformations, such as LCF and TMF conditions, the life of components can often be represented using the Coffin-Manson relation, cf. [Citation18–21], where the inelastic strain range is of importance to be accurately simulated. Other models have also been used to predict component life under LCF and TMF conditions, where also the maximum and minimum stress is of importance [Citation22,Citation23].
To accurately simulate the mid-life behaviour without extensive computational effort, cycle jumping techniques can be used. One such technique, which has previously been used with success for both LCF and TMF conditions [Citation7,Citation24,Citation25], is based on a discrete change of material parameters, where the initial virgin material properties are changed to mid-life properties, see Hasselqvist [Citation26]. With this technique, also the constitutive description can be simplified, where continuous accumulation of state variables can be directly described in a simplified manner by the change of parameters, where for instance isotropic hardening can directly be represented with the change of parameters, and only a kinematic hardening description is needed.
In this paper, a constitutive model is presented for an AM combustor material, which accounts for anisotropy and high-temperature effects. The model is based on newly performed TMF and isothermal creep tests up to C, which are the main loading types in combustor applications, and also on previously published LCF and TMF experimental data in Lindström et al. [Citation7,Citation25]. Furthermore, a main objective with the presented constitutive model is that it is going to be utilised in fatigue life predictions based on the stabilised material behaviour. Hence, instead of continuous cycle-by-cycle modelling, a cycle jumping procedure was used that enables for shorter simulation times and lower computational cost, but also a simplified constitutive description. The presented model predicts the material behaviour well for the tested conditions.
Experiments
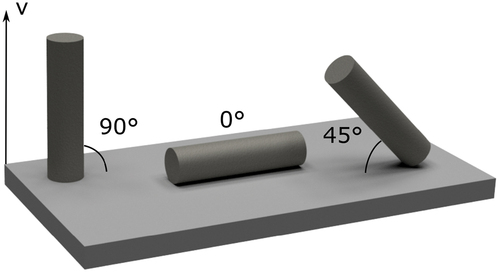
Tensile, isothermal creep, LCF and TMF tests were performed on uniaxially loaded smooth specimens to quantify the constitutive behaviour at temperatures representing the conditions in a combustion chamber during operation. These specimens were additively manufactured using the selective laser melting (SLM) technique in an EOS M400–4 machine, using a layer thickness of 40 μm. The specimens were manufactured as cylindrical bars with an initial diameter of 18 mm, and later machined and polished to final dimensions, and therefore the effect of the as-printed surface was removed and only the as-manufactured bulk material was analysed. No heat treatment or other post-processing was performed on the specimens. The same printing parameters were used for all prints, and the laser scan pattern was rotated after every built layer, generating isotropic properties in the building plane, cf [Citation27]. However, the properties in the building direction will be different due to the elongated grain structure in the building direction, and the material becomes transversely isotropic. Electron backscatter diffraction images of similar SLM materials, showing the elongated grain structure in the building direction received from the SLM process, can be seen in e.g. [Citation27–30]. The exact printing parameters cannot be presented due to confidentiality. The material used is a ductile nickel-based superalloy used in combustor application, cf. Hastelloy X, Haynes 230 and Inconel 617, see e.g. [Citation31,Citation32]. To analyse the anisotropy, specimens were built in three different directions in the AM machine, with an angle of
,
and
between the building platform and the axial direction of the specimens, as shown in . Details of each test condition are given below. It should also be noted that all stress measures in the paper have been normalised due to intellectual properties. It can also be noted that no thermal strains are considered in this work. Hence, all strain measures refer to mechanical strain.
Figure 1. Illustration of how the test specimens were printed in the AM machine, where is the building direction, i.e. the normal to the building platform.
Isothermal creep and tensile tests
The performed creep tests have been done at four different temperatures; C,
C,
C and
C. Specimens with
and
building direction were used, with three different applied engineering stress levels at each temperature, see . In total, thirty creep tests were conducted, with doubles in the
C case. The tests were performed according to the ISO 204:2018 [Citation33] standard for uniaxial creep testing. An Escher Wyss multi-sample machine with the specimen geometry as displayed in () was used for the
C creep tests, where the displacements were measured manually by a caliper, and BOFORS single-sample machines with the specimen geometry in () were utilised in the
C,
C and
C creep testing, where an extensometer and two dial-gauges were employed for strain measurement.
Figure 2. Utilised specimen geometries for a) C, b)
C,
C and
C creep, c) tensile, d) LCF and e) TMF tests.
Table 1. Summary of the performed creep tests.
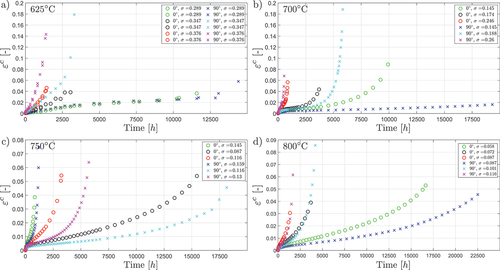
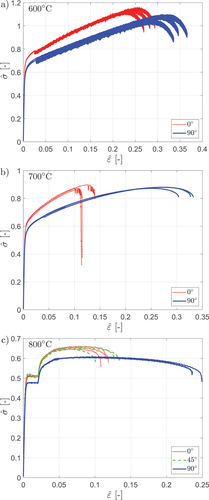
The resulting creep curves are shown for each temperature in . From the results it can be seen that the response at all temperatures shows a clear directional dependency. At C, it can also be observed that the anisotropy in creep is also stress dependent, where the anisotropy is larger at high stress levels, where the
specimens have the highest creep rate at high stresses. At high temperature and low stresses, the trend seems to be the opposite compared to the tests at
C, where higher creep rate is present for the
specimens compared to
specimens. Similar behaviour has previously also been observed for a similar AM material at
C, where
specimens show higher creep rate and lower ductility compared to
specimens [Citation28].
Figure 3. Experimental creep strain vs. time at a) C, b)
C, c)
C and d)
C.
To see if the material response is rate-dependent or rate-independent in a certain range of strain rates, monotonic tensile tests have been performed at C,
C and
C on smooth specimens with a diameter of 6 mm and building direction of
,
and
. The tests were performed in servo-hydraulic testing machines with the specimen geometry in (), which were equipped with an extensometer with gauge length of 30 mm. For these tests, the initial applied strain rate was
1/s, which gradually increased at 2% strain to a final strain rate of
1/s at 4% strain, as illustrated in . As can be seen in (), the response seems to be rate-independent at
C and
C for the tested rates, as the material response follows the same trend when the strain rate is increased. It should however be noted that a similar alloy showed a large rate-dependence at
C [Citation34], where slow strain-rate testing was performed at strain rates of
and
1/s. Also, it has been shown earlier for the same alloy as investigated in this study that a large time-dependence is observed for TMF loadings up to
C [Citation7]. One can also note from () that serrated yielding occurs at
C for the tested strain rate, which is an effect that also have been seen for similar conventionally manufactured materials, cf. [Citation35]. Serrated yielding is a phenomenon that is strongly dependent on strain rate, and is related with several effects on mechanical properties, such as decreased ductility, increased work hardening, and negative strain rate sensitivity [Citation36]. Hence, although no clear effect of the increased strain rate was seen in the tensile test at
C, it can be concluded that the material is strain rate dependent at
C. At
C, the response is however very rate-dependent, where a clear difference can be seen when the strain rate is changed (see ). Despite the fact that the true stress is plotted versus true strain, a softening behaviour can be seen at
C relatively early in the test. This behaviour has also be seen for a similar AM material at
C with a strain rate of
1/s [Citation34], which could be an effect of localization or macroscopic damage is initiated early in the test, but the softening behaviour can also be due to dynamic dislocation recovery, since as-built SLM parts have high initial dislocation density.
Figure 4. Strain rate vs. applied strain in the monotonic tensile tests.
Figure 5. Experimental true stress () vs. true strain (
) for the monotonic tensile tests at a)
C, b)
C and c)
C.
In the obtained minimum creep rates, obtained by differentiating the experimental creep strain with respect to time, from the creep tests at C are plotted against the applied stress. Additionally, a fitted Norton equation to these tests is shown in this plot for the two building directions, which clearly shows the directional dependency during the creep testing. It should be noted that the fitted Norton curve in is extrapolated up to stress levels as high as observed from the tensile tests. Additionally, the strain rate from the tensile tests at
C is also plotted versus the stress level at the stress plateaus for the
and
specimens, respectively. For the tensile tests at
C, the observed plateaus for the
specimens match very well the fitted Norton law from the creep tests on these specimens, see , where the creep rate is basically the same as the applied strain rate at these plateaus. This indicates that the observed behaviour at the monotonic tensile tests on
specimens is purely because of creep deformation. However, for the
specimens in the tensile tests, the creep rate is much lower in the creep tests following the Norton law compared to the plateaus in the tensile curve. As these specimens clearly have a rate-dependent behaviour in the tensile tests, one can argue that creep deformation is also dominant for
specimens at this temperature level, but with another parameter setting compared to the fitted Norton law from the creep tests. One can also conclude from the monotonic tensile tests that if the deformation is purely because of creep, the creep rate is higher for the
specimens compared to the
specimens, because of the lower plateaus of the
specimens. One can therefore draw the following conclusions from the tensile and creep tests:
Figure 6. The experimental minimum creep rate vs. stress from the creep tests at C, a fitted Norton expression for the
and
specimens, respectively, and the obtained strain rates and stress plateaus from the tensile tests.
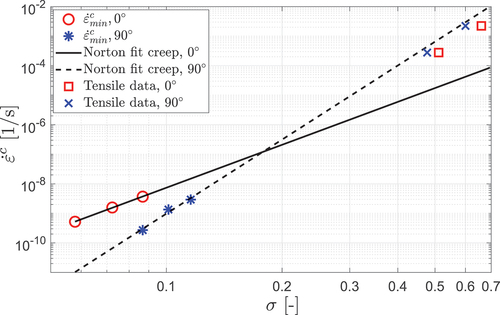
• At high stress levels, the specimens have the highest creep rate
• At low stress levels, the specimens have the highest creep rate
• The transition is smooth, since the response is basically the same for the creep tests at C with low stresses, but different for the other tests
To the authors knowledge, this stress-dependent anisotropy has not been observed earlier for AM materials, and the physical explanation to this has not been studied more in detail. But the behaviour could be explained as at higher stress levels, the deformation is dominated by dislocation motion, both for creep and plasticity. For this, as specimens have more grain boundaries perpendicular to the loading axis, hindering the dislocation motion, the creep rate is lower (and yield stress higher) for these compared to
specimens. Possibly, at low stress and low strain rates, and at relatively high temperatures, the grain boundaries weaken, and grain boundary sliding becomes the dominant deformation mechanism for
specimen. As
specimens have more weak grain boundaries perpendicular to the loading axis, the deformation rate is higher for these. This was also observed in [Citation28], where
specimens observed to have higher creep rate and lower creep ductility compared with
specimens in creep tests of as-built SLM Hastelloy-X at
C. It was discussed and shown that the grain boundaries were weakened, and cracks formed at the grain boundaries.
LCF tests
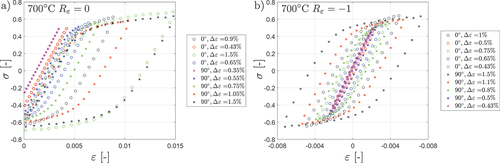
Nineteen LCF tests were performed at a temperature of C under strain control using a constant strain rate of 6%/min during loading and unloading for all tests. The testing was conducted using a servo-hydraulic uniaxial load-frame equipped with digital controllers. The load was measured using a 50 kN Instron load cell and the strain was measured using an MTS 632.50C–04 lean-on extensometer. The strain rate was controlled by the extensometer, with a gauge length of 14 mm, over the gauge section of the specimen. The tests were performed on
and
specimens exposed to different strain ranges. The tests were performed in both
and
with a triangular loading waveform, where
and
are the minimum and maximum applied mechanical strain in the cycle, respectively. A summary of the LCF tests is shown in and the used specimen geometry is shown in .
Table 2. Summary of the performed LCF tests at C.
The experimental mid-life hysteresis loops for the LCF tests at C are shown in . As can be seen, these tests show very similar trends as the LCF tests at lower temperature, as reported in [Citation25], and the monotonic tensile tests as shown in , where the
specimens exhibit higher stresses compared to the
specimens. In addition to these experiments, similar LCF tests at temperatures from room temperature to
C were available, which have previously been reported in [Citation25].
Figure 7. Experimental mid-life hysteresis loops for the LCF tests at C for a)
and b)
.
TMF tests
Four TMF tests were performed using mechanical strain control under both in-phase (IP) and out-of-phase (OP) conditions, with hold-times during peak temperature. To reach a stabilised mean stress early in the tests, the first hold-time was hours long and the subsequent hold-times were
min long [Citation7,Citation37], see for an illustration of the loading conditions during TMF cycling. During loading and unloading, a fixed temperature rate of
C/s was used that generated different strain rates depending on the applied mechanical strain range, but in the order of
1/s. The tests were performed with a minimum temperature of
C and maximum temperature of
C at different strain ranges, with
for the OP tests and
for the IP tests on specimens with
and
building direction, see for a summary of the test conditions and () for the used specimen geometry. An MTS Landmark servo-hydraulic test machine was used, and a MTS 632.53F–14 extensometer with a gauge length of
[mm]. Heating was generated using an induction coil, and compressed air was used for cooling. Before the testing of each specimen, the thermal strain was measured as a function of the temperature, and used as input to the control system to monitor the mechanical strain. The experimental response is shown in for these TMF tests, showing the first, second and mid-life cycle. It should be noted that the gap in the curve during the first cycle is due to insufficient data sampling. As can be seen from all these tests, there is a softening behaviour during the first onloading, which is due to creep dominant deformations as the temperature increases.
Figure 8. Loading sequence for the temperature and mechanical strain during a) in-phase and b) out-of-phase TMF loading.
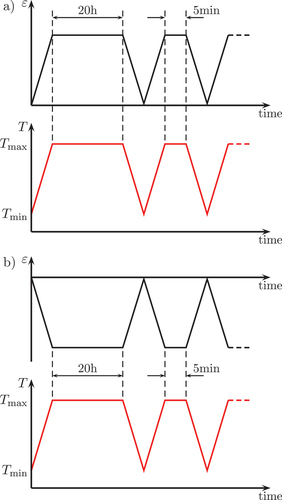
Figure 9. Experimental stress vs. mechanical strain for the TMF tests with C, showing cycle 1, 2 and the mid-life cycle for test a) IP800:0:0.4, b) OP800:0:0.6, c) IP800:90:0.3, and d) OP800:90:0.4.
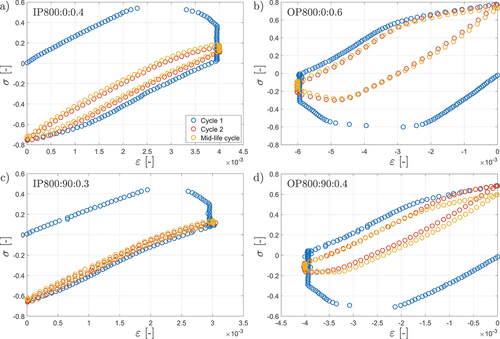
Table 3. Summary of the performed TMF tests with C.
Additionally, TMF tests at similar conditions with maximum temperatures of C and
C were also available and previously reported in [Citation7]. From the TMF tests with
C and
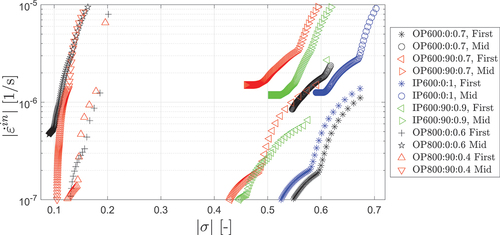
C, an interesting observation was done when analysing the inelastic strain rate during the hold-time during the first cycle and the mid-life cycle. From , where the size of the inelastic strain rate is plotted against the size of the stress, one can see that the rate-dependent behaviour is different from the first cycle compared to the mid-life cycle. During the mid-life cycle, the inelastic strain rate is higher for a given stress compared to the first cycle (or a lower stress is needed to reach a certain inelastic strain rate during mid-life). As also can be seen, this effect is significant larger for the TMF tests with
C compared to the TMF tests with
C. One should note that the inelastic strain rate in has been calculated from the stress rate during the hold-time from the tests. As no relaxation was observed during the hold-time at mid-life for one of the IP TMF tests with
C, and the raw data during the mid-life hold-time of the second IP test was relatively noisy, only the OP TMF tests for
C are plotted in the figure.
Figure 10. Experimental inelastic strain rate vs. stress from the hold-times during the first cycle and in the mid-life cycle for IP and OP TMF tests with C and OP TMF tests with
C.
Constitutive modelling
To account for both rate-dependent and rate-independent deformations in constitutive modelling, the definition of one viscoplastic flow surface that defines the rate-dependent effects and one plastic yield surface defining the rate-independent effects has previously been used to model the inelastic behaviour of Inconel 792 [Citation38] and Inconel 718 [Citation39]. Additionally, in a previous study by Lindström et al. [Citation7], such a methodology was used to model the inelastic behaviour of the same material as in this study. Using the definition of a viscoplastic flow surface bounded by a plastic yield surface, the inelastic strain can be divided into one rate-independent (plastic) and one rate-dependent (creep) part. Assuming associated flow, the inelastic strain rate is defined as
where is a temperature dependent creep coefficient,
is the creep exponent,
is a normalisation factor and
is the equivalent Hill stress, relating the rate-independent yield behaviour of the material in different directions, defined as
where is the fourth-order Hill tensor that defines the anisotropic rate-independent yield behaviour. For this AM alloy, a transversely isotropic behaviour can be assumed, cf. [Citation7,Citation25], since the grains become elongated in the building direction during manufacturing, while the grain size is relatively equiaxed in the building plane, cf. [Citation27,Citation30]. Therefore, the fourth-order tensor
is calculated based on the building direction, as
where is the structural tensor based on the building direction
, defined as
. Further,
, where
is the second-order unit tensor and the dyadic products are defined as
and
. The Hill parameters
,
and
can be calculated based on the yield stresses obtained from tests on specimens with different building directions, defined as
where ,
and
are the yield stresses obtained from tests on
,
and
specimens, respectively. In Voigt notation, where the building direction coincides with the [001] direction,
becomes
where the first term is defined to be more dominant for specimens, and the second for
specimens.
and
are equivalent stress measures of Hill type, and the creep exponent
should be larger than
, such that the creep rate in
specimens have a larger stress dependence. Additionally,
and
are strongly dependent on temperature, and
and
are normalisation constants. The equivalent Hill stresses in EquationEquation (7)
(7)
(7) are defined as
where and
are the corresponding fourth-order Hill tensor for each Norton term, and are calculated as in EquationEquation (4)
(4)
(4) , but with the corresponding Hill constants
,
,
,
,
and
. As the deformation in the tensile tests at
C most certainly is only because of creep deformation, the deformation at peak temperature in the TMF tests with
C, that have significantly lower applied strain rate, must also be due to creep. Hence, the size of the plastic yield surface at
C is of less importance compared to the creep variables. At lower temperatures, it has previously been shown that the definition of a plastic yield surface, which defines the rate-independent part of EquationEquation (1)
(1)
(1) , gives a good prediction of the LCF and TMF behaviour [Citation7]. Hence, such a plastic yield surface is also used here, and is modelled with the Hill yield criterion, as
where the first term defines the linear hardening, the second term defines the rate-independent saturation of backstress evolution, and the last term is the static recovery, defining the time-dependent recovery of backstress [Citation13,Citation42]. Further, and
are the inelastic hardening and saturation value of the backstress, respectively, and
is the Heaviside function,
is the Macaulay bracket,
, and
and
are material parameters that with the normalisation parameter
defines the power-law behaviour of the static recovery. In this study, only one backstress term is used, giving a linear kinematic hardening behaviour up to the saturation at which the response is perfectly plastic with continuous inelastic deformation for the rate-independent part. The rate-independent part, i.e. the first two terms of EquationEquation (11)
(11)
(11) , generates a closed hysteresis loop without ratcheting effects for uniaxial loadings [Citation41,Citation43].
To express the directional dependence of the kinematic hardening modulus and saturation value, these are also calculated based on the building direction and the stress state, similarly as in [Citation7], as
where and
are Hill-like fourth-order tensors, containing the kinematic hardening modulus and saturation values in different building directions, respectively. Both these tensors are calculated using the same relation as for
in EquationEquation (4)
(4)
(4) , but with the following Hill constants
where ,
,
,
,
and
are the hardening and the saturation of backstress obtained from uniaxial tests on specimens with different building directions.
In addition to the above, it has been shown that in conventionally manufactured materials the effect of high- temperature exposure on low-temperature yielding, i.e. an ageing effect, is large at high temperatures [Citation26]. This can affect nickel-based alloys, where coarsening of particles might lead to a softening behaviour, but also for nickel-based alloys experiencing hardening or softening due to carbide precipitation, or deleterious phase formation, such as
or
phase. Furthermore, it has also been observed that the yield strength of similar AM alloys decreases with the introduction of heat treatments [Citation44,Citation45]. However, this effect cannot be directly quantified based on the performed tests in this study. Thus, in an attempt to account for this aging effect, which is presumable to occur during TMF loadings when exposing the specimens at high temperature, an aging term has been introduced to the yield stress, as
where ,
and
are the yield stresses obtained from
,
and
specimens without the effect of high temperature ageing, and
,
and
are corresponding maximum temperature-dependent parameters defining the change in yield stress throughout the TMF load sequence, and are initially set to zero as no TMF cycling (ageing) has occurred.
It can be noted that residual stresses can be an issue that arises during manufacturing of SLM parts, see [Citation46,Citation47], and can affect the material response of as-built parts. However, this effect has not explicitly been modelled here. Such residual stresses will potentially only affect the material response in the initial cycles, and later relax to equilibrium after repeated load cycling.
Cycle jumping
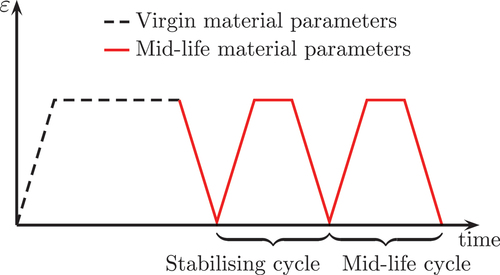
Generally, evolution laws of, for instance, isotropic hardening, damage accumulation and memory effects need to be included in the constitutive description of this kind of material exposed to cyclic loadings. This would also need a computationally expensive continuous cycle-by-cycle simulation for the complete life of a component. However, if using a fatigue lifing model based on the stabilised mid-life behaviour in the end application, only the mid-life response of the material is of importance to predict. Hence, a cycle jumping procedure, where the material parameters are changed from a virgin state to mid-life parameters, as previously described by Lindström et al. [Citation7,Citation25] was also used here. This change of material parameters represent the evolution of the material due to accumulation of inelastic strains and is therefore used when simulating LCF and TMF conditions. For example, instead of modelling the expansion/contraction of the yield surface with accumulation of inelastic strain, the yield stresses are changed from virgin parameters to mid-life parameters. The cycle jumping procedure is done by first using virgin parameters, extracted from the first onloading of the LCF tests and monotonic creep tests, for the first onloading and hold-time. Then the material parameters are changed to mid-life parameters, which are obtained from the mid-life cycle. Two complete loading cycle are then simulated, where the last cycle represents the mid-life cycle, see . For monotonic loadings, such as the creep tests, only virgin parameters are used since there are no cyclic effects. As previously done in [Citation25], all parameters for the rate-independent part are changed. Additionally, since the relaxation during the hold-time in the first unloading and mid-life are different, cf. , the parameters ,
and
in EquationEquation (7)
(7)
(7) and (Equation11
(11)
(11) ) are also changed. The aging terms
,
and
in EquationEquation (16)
(16)
(16) are also changed from the initial values to mid-life as the long repeated TMF cycling affect the material behaviour.
Figure 11. Schematic overview of the cycle jumping procedure, where the initial virgin parameters are changed after the first onloading and hold-time to mid-life parameters.
Implementation
The described constitutive model was implemented in a user-material subroutine in the finite element software Abaqus [Citation48]. To solve the constitutive equations, a Newton-Raphson iteration procedure was implemented, where a residual was set up, and iteratively minimised. A backward-Euler scheme was utilised for stability reasons. However, the hardening parameters in EquationEquation (12)(12)
(12) and (Equation13
(13)
(13) ) are for simplicity calculated based on the elastic trial stress and not updated in the Newton-Raphson procedure, as previously done in [Citation7]. A two-step procedure was used for the creep and plastic strain, as previously employed in e.g. [Citation7,Citation38,Citation49]. In the first step, the elastic trial stress is corrected with a creep corrector, i.e. solving for the stress, backstress and creep strain, involving solution of the residuals of the unknowns
which was defined as
where and
indicate the quantities in the beginning and the end of the iteration procedure, respectively. The final solution of the unknowns
can then be found by the Taylor expansion. If the stress state is located outside the plastic yield surface (
) after this creep corrector step, the stress state is corrected with a plastic corrector, such that
, by a similar solution procedure for the unknowns
, with the following residuals
where the unknown quantities can again be found by Taylor expansion. It should be noted that only the plastic strain is updated in the second step, which might give different results of how the total inelastic strain is divided between the plastic and creep part compared to if also the creep strain was updated in the second step. Slightly conservative results of the creep strain can be expected with this methodology compared to the situation if the creep strain is based on the final stress state on the plastic yield surface. However, the total inelastic strain will be the same independently of these solution procedures, see for a visualisation of this two-step procedure. For similar both conventionally and AM produced parts, the total inelastic strain is often also of interest during fatigue life calculation, cf. [Citation20,Citation50].
Figure 12. Illustration of the stress update procedure, where the elastic trial stress is updated with a creep corrector. If after the creep corrector, the stress is updated with a plastic corrector to obtain
.
Simulation and discussion
Parameter identification
The determination of the parameters for the above described constitutive model is not an easy task, especially regarding the rate-dependent parameters, and a unique set of parameters is not expected to be found. A total of twelve independent rate-dependent related virgin parameters need to be defined; ,
,
and
for the rate-dependent strain in EquationEquation (7)
(7)
(7) , the Hill parameters
,
,
,
,
,
in EquationEquation (8)
(8)
(8) and (Equation9
(9)
(9) ), and
and
for the static recovery of the backstress in EquationEquation (11)
(11)
(11) . Additionally, the mid-life parameters of
and
in EquationEquation (7)
(7)
(7) ,
from EquationEquation (11)
(11)
(11) , and
,
and
in EquationEquation (16)
(16)
(16) need to be obtained from the mid-life response. Also, as the rate-dependent response are functions of the accumulated backstress, which is unknown from the test data, this further complicates the identification process, and usually optimization routines are used to obtain the parameters for the rate-dependent part, cf. [Citation39,Citation51]. In order to simplify the identification process for the rate-dependent part, all these parameters are identified from the creep tests at all temperatures, and from the monotonic tensile test at
C. The parameters
,
,
and
are obtained from the minimum strain rates obtained from the creep tests. As the minimum strain rate is dependent on the saturated state of the accumulated backstress, which is unknown from the tests, the saturated backstress is approximated based on the accumulated creep strain at the beginning of the secondary creep stage, as illustrated in . Hence, for every test
, the saturated backstress, in a uniaxial state, can be calculated as
Figure 13. Illustration of how the saturated backstress was based on the accumulated creep strain in the beginning of the secondary creep stage and the double-Norton terms evaluated from the minimum creep strain rates.
where is the accumulated uniaxial creep strain for each test
, according to . For the Hill parameters used in the double-Norton equation, further simplification has been done. Instead of trying to find a unique set of the Hill parameters,
and
have manually been assessed so that the first Norton term is dominant for
specimens compared to
specimens, and
and
for the second Norton term. Further, as no creep tests have been performed on
specimens,
and
were chosen such that the response of tests on
specimens gives the same results as for
specimens. Hence, they have not been determined on their own based on solely
specimens respectively
specimens. In addition to this, the normalisation constants
and
were set to suitable values for virgin material parameters. With these simplifications, the parameters
,
,
and
can be obtained by the minimum creep strain rate from the secondary creep stage from the creep tests, cf. . A uniaxial representation of EquationEquation (7)
(7)
(7) can then be simplified, for a
specimen, to
and, for specimens to
where ,
and
are the minimum strain rate, applied stress and calculated saturated backstress from each test, respectively. With these equations, the parameters
,
,
and
were obtained for each tested temperature. Additionally, as the saturated state of the backstress has been calculated according to EquationEquation (19)
(19)
(19) , the parameters
and
for the static recovery can be identified using that the backstress evolution is zero when the saturated state has been reached. Again, the normalisation parameter
was set to a suitable value, just as in the case of
and
. Assuming that the dynamic recovery, i.e. the second term in the backstress evolution in EquationEquation (11)
(11)
(11) , is not activated, the following uniaxial equation can be used to find the parameters
and
Using the relationship in EquationEquation (22)(22)
(22) ,
and
can be found for each temperature using the saturated backstress as defined in EquationEquation (19)
(19)
(19) , and the minimum creep strain rate for each test. As no creep tests are available for temperatures below
C, the parameters for the double-Norton and static recovery were optimised so that the response is the same as the presented model in [Citation7] for
C and
C, where the parameters for the rate-dependent parts were determined from the TMF tests.
The parameters related to the rate-independent parts of the model, i.e. yield stresses, Young’s modulus, kinematic hardening modulus and saturation value, were =
,
,
obtained from the LCF tests. This was previously done from room temperature (RT) up to C in [Citation25], which has here also been extended by the LCF tests at
C and the monotonic tensile tests at
C. The virgin parameters were obtained from the initial onloading up to maximum load, assuming a completely rate-independent behaviour. The mid-life parameters where similarly obtained from the mid-life hysteresis loops. Since no LCF tests were available at
C, the kinematic hardening modulus and the saturation of the backstress for all building directions were taken to be the same as for
specimens at
C. The Young’s modulus in the different building directions at
C was obtained from the monotonic tensile tests, and taken to be the same at mid-life. The virgin values of the yield stresses at
C were set to a value slightly higher than the peak stress in the monotonic tensile tests, and lower than the obtained yield stresses at
C, and the mid-life values of the yield stresses were set to decrease equally much as they decrease in the LCF tests at
C. Moreover, as direct determination of the mid-life values of
,
,
,
,
and
is difficult, an optimisation procedure utilising the implemented material model was performed, and the sum of squared errors of the experimentally obtained and simulated stress was minimised to obtain values of the parameters. In , the tests from which all the parameters were obtained from are summarised.
Table 4. Summary of which tests the material parameters were extracted from.
It should be noted that for all directional dependent parameters where tests on specimens were not available, the response of a
specimen was used instead, which enables to make a full description of all fourth-order tensors that need parameters extracted from tests performed with
specimens. This was done since many experimental evidences show that
specimens behaves very similarly with regards to tensile testing, cf. (), and LCF properties, cf. [Citation25].
Temperature dependence
Similar as in Becker and Hackenberg [Citation39], no direct function for the temperature dependence of the variables ,
,
and
in EquationEquation (7)
(7)
(7) was taken in the parameter identification process. Ultimately, the parameters
and
would be represented as Arrhenius terms. However, this either complicates the parameter identification process, and/or gives less accurate results of the creep response at the different temperatures. Hence, in order to obtain the same results of the parameters as extracted for the creep tests in the different temperatures, all rate-dependent parameters, i.e.
,
,
and
, as well as
and
in EquationEquation (11)
(11)
(11) , were interpolated sequentially between the four creep test temperatures, i.e.
C,
C,
C and
C, denoted
and
, as
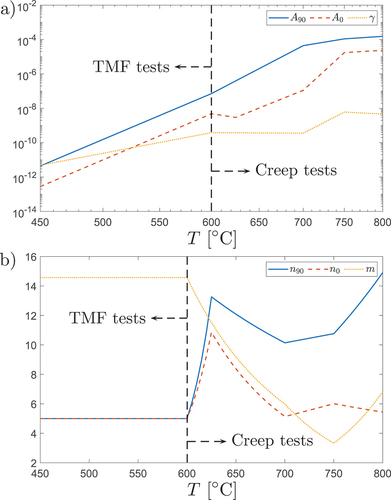
where . In the obtained temperature dependence of these parameters are shown, and one can see a clear difference and effect of the identification, where the exponents changes relatively drastically at
C, cf. (), above which the parameters are extracted from the creep tests, instead of the results from the TMF tests at and below
C. This effect can be due to different active deformation mechanisms during creep tests at relatively low stress compared to TMF tests at higher and varying stress levels.
Figure 14. The obtained parameters for the rate-dependent terms and the temperature interpolation for a) ,
and
, and b)
,
and
.
The yield stresses and Young’s modulus in the different directions are temperature dependent, and implemented as polynomials fitted to the extracted values in the temperature range between room temperature and C. Also, the kinematic hardening and the saturation value of the backstress in the different directions are fitted to polynomials, but have been set to be dependent on maximum temperature instead. In a TMF context, it means that the hardening parameters vary with temperature up to maximum temperature, after which they are constant. A similar setup was also made for a cyclic hardening parameter in [Citation14], which resulted in good agreements to TMF cycling at large temperature ranges. Hence, a temperature rate term in the backstress evolution, as discussed in e.g. [Citation52,Citation53], is not of importance [Citation7].
From the experimental relaxation curves shown in , it was concluded that the time-dependent behaviour during the hold-times are different between the initial cycle and the mid-life cycle. One can also see that the difference is larger for the TMF tests with C compared to TMF tests with
C. Hence, the mid-life values of
,
and
have also been set dependent on the maximum temperature. As data of these can only be extracted from the TMF tests, these were obtained only from the TMF tests with
C and
C. As no TMF tests with
C were available, the values of
,
and
have been set to be the same as the virgin values for
C. These parameters were then linearly interpolated between
C and
C, and between
C and
C. As thermal aging is dependent on the exposure temperature, the aging term
at mid-life should therefore also be a function of maximum temperature. As no clear thermal aging was observed from the TMF tests at
C, and as no TMF tests with
C have been performed,
was set to zero for
C and then linearly interpolated from zero to the values obtained from TMF tests with
C. A summary of the parameters that are temperature dependent and dependent on maximum temperature can be found in .
Table 5. Summary of the parameters that are dependent on instant and maximum temperature.
Simulation results
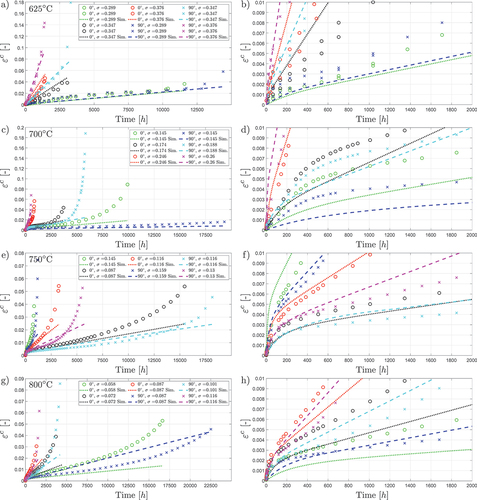
As the stress state in all experiments are uniaxial and homogeneous, a finite element model consisting of a cube with one element was used. An eight-noded element with reduced integration was used for the simulation, with an applied prescribed displacement to represent the strain controlled LCF and TMF tests. For the creep tests, a prescribed force was applied instead. Transverse contraction of the cube was unhindered to generate the uniaxial stress state. In , the experimental and simulated creep strain vs. time is shown for the different temperatures. It should be noted that only the primary and secondary creep stage has been actively modelled. Hence, a good prediction of the non-linear tertiary creep regime is not expected. As can be seen, the overall behaviour is predicted with acceptable accuracy. For the creep tests at C, the model predicts almost similar behaviour of the
and
specimens at low stress. With increased stress, the difference between the building directions increases. For the creep tests at
C, one can see that the
specimen has a higher creep rate for the lowest applied stress level, which also the model can capture. Due to the simple handling of the primary creep stage, which is modelled with the static recovery term, and also due to the simplified parameter identification of this, the primary creep stage is not fully captured by the model, as can be seen in (). However, the general behaviour is well described. As seen in (), both the primary and secondary creep behaviour at
C are predicted with relatively good accuracy. Also here, the
specimens show lower creep rate compared to the
specimens, which is captured well by the model. Furthermore, the creep behaviour at
C is well captured by the model. Some deviations between the simulated and the experimental results can be observed here compared to the tests at
C. However, also here the
specimens show much higher creep rates than the
specimens. For this temperature, more deviations are expected, since also the monotonic tensile test were used to obtain the parameters.
Figure 15. Experimental and simulated creep response for a) C, b) zoomed in to strains up to 1% and the first 2000 hours for
C, c)
C, d) zoomed in
C, e)
C, f) zoomed in
C, g)
C and h) zoomed in
C.
Without ageing term 
It was shown that the model described in [Citation7] is able to simulate the TMF behaviour well up to C without an aging term that affects the low temperature properties due to exposure at higher temperature. For the described model here, without including an aging term, the resulting simulated TMF response with
C is shown in and compared to the experimental response. As can be seen in () for the
specimen, the model is able to simulate the experimental mid-life response well. However, for the tests on the
specimen shown in (), one can see that the stress range is larger in the experiment, and the inelastic deformations are much smaller in the simulation compared to the experiment. From the OP test in (), one can clearly see that the response at high temperature, i.e. during minimum load, is simulated well, but the yield limit at lower temperature seems to be much higher for the simulation compared to the experiment, as the width of the hysteresis deviates significantly from the experimental hysteresis. One reason for this can be that thermal aging, i.e. effects of the low temperature properties due to high temperature exposure, has an impact when exposing the material to
C.
Figure 16. Experimental and simulated stress vs. mechanical strain for the TMF tests with C, showing cycle 1, 2 and the mid-life cycle for the experiments and cycle 1 and mid-life for the simulation without the aging term, for test a) IP800:0:0.4, b) OP800:0:0.6, c) IP800:90:0.3, and d) OP800:90:0.4.
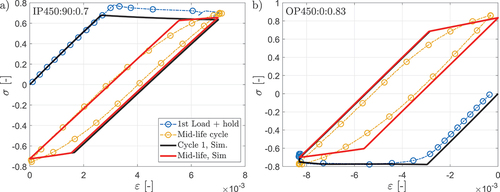
The simulated results for the TMF tests up to C, as previously reported in Lindström et al. [Citation7], are shown in . As the described model was calibrated to also be representative for these load cases, the simulated responses are similar as to the ones obtained by the model presented in [Citation7]. In contrast to the TMF tests with
C, there is not a large deviation of the inelastic strain range, i.e. the width of the hysteresis loop, when comparing simulation with experiment. This indicates that exposure at temperatures up to
C does not effect the low temperature behaviour significantly, i.e. negligible aging effects.
Figure 17. Experimental and simulated stress vs. mechanical strain for IP TMF tests with C for
specimen with
a)
, b)
, c)
and d)
and
specimen with
e)
and f)
.
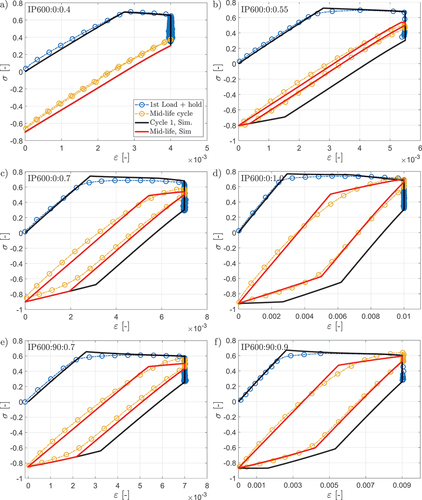
Figure 18. Experimental and simulated stress vs. mechanical strain for OP TMF tests with C for
specimen with
a)
and b)
and
specimen with
c)
and d)
.
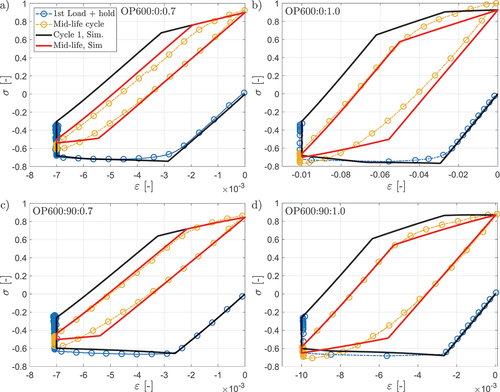
Figure 19. Experimental and simulated stress vs. mechanical strain for TMF tests with C, for a) IP TMF
specimen with
and b) OP TMF
specimen with
.
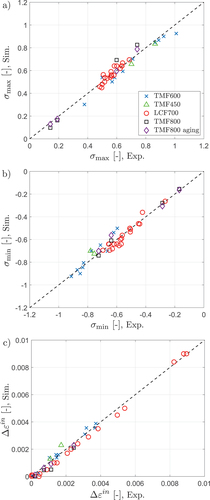
The simulated, using the developed constitutive model presented in this study, and experimental mid-life hysteresis loops for the LCF tests at C are shown in . As can be seen, the experimental response is replicated well with the model. Due to the nature of the kinematic hardening rule, the simulated responses are much more ‘linear’ compared to the very non-linear experimental response. Hence, perfect prediction of every point of the experimental data cannot be achieved. However, the maximum and minimum stress levels, as well as inelastic strain range, can be simulated with reasonable accuracy. This is one of the main aims with the presented model, i.e. to be able to represent the hysteresis response for utilisation in fatigue assessment with simplicity, as the inelastic strain range and measures of stress in the mid-life hysteresis are of importance for fatigue lifing models. The resulting simulated versus experimental maximum stress, minimum stress and inelastic strain range from the mid-life cycle is compared in , where one can see that the deviations are relatively small considering all the evaluated cases. It should be noted that the inelastic strain range was extracted as the width of the mid-life hysteresis loop at a stress level of zero [Citation37]. As can be seen, all these can be simulated with reasonable accuracy compared to the experimental response.
Figure 20. Experimental and simulated mid-life response of the LCF tests at C for
specimens with a)
and b)
and
specimens with c)
and d)
.
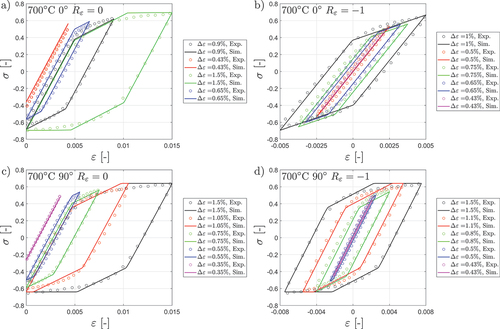
Figure 21. Simulated vs. experimental mid-life results for the TMF tests with up to
C and LCF tests at
C for a) maximum stress, b) minimum stress, and c) inelastic strain range.
With ageing term
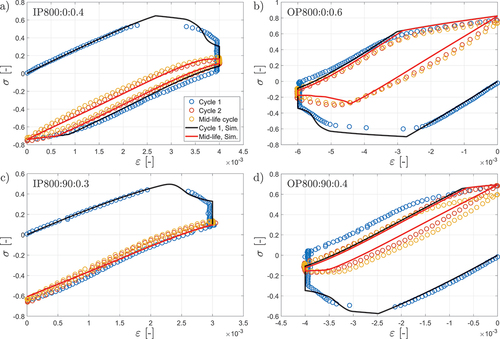
As seen in , the inelastic strain range for the TMF conditions with C was not well simulated when excluding the effects of aging on the yield stress. When this aging effect was included, the mid-life response is better captured, as can be seen in . The error between the simulated and experimental value for maximum and minimum stress and the inelastic strain range in the mid-life cycle are shown in , comparing the results with and without an aging term. The difference was calculated as
Figure 22. Experimental and simulated stress vs. mechanical strain for the TMF tests with C, showing cycle 1, 2 and the mid-life cycle for the experiments and cycle 1 and mid-life for the simulation with the aging term, for test a) IP800:0:0.4, b) OP800:0:0.6, c) IP800:90:0.3, and d) OP800:90:0.4.
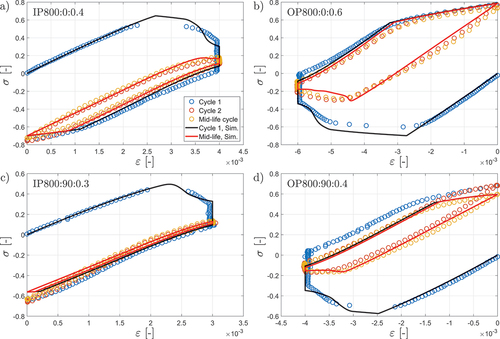
Table 6. between the experimental and simulated values of
,
and
for the TMF tests with
C with and without using an aging term
.
where and
are the experimental and simulated values of the parameters
in the mid-life cycle. Also here, the inelastic strain range was calculated as the width of the hysteresis loop at zero stress. As can be seen for
and
, the use of the aging term improves the simulation results relatively much. However, the minimum stress is somewhat less accurate to simulate with the aging term, although these differences are relatively small compared to the improvements of the results of the maximum stress and inelastic strain range, something also seen in .
As seen for the tests with the higher strain levels, the decrease in stress is very abrupt when reaching high temperature both with and without the use of the ageing term, cf. () and 22b). This is probably due to the parameter identification process, where the parameters for the double-Norton were extracted from the creep tests. If these parameters instead would be optimised for the TMF tests, the decrease in stress would probably not be as abrupt. However, this would probably be a very complicated parameter identification process, and the prediction of the creep tests would most truly be negatively affected.
Conclusions
In this paper, the constitutive behaviour of an additively manufactured ductile combustor alloy has been studied and modelled for LCF, TMF and creep conditions at temperatures up to C. The model was based on monotonic tensile, creep and TMF tests up to
C, as well as LCF tests at
C, where anisotropy was observed at all temperatures. The following conclusions can be drawn:
• The studied additively manufactured material shows very complex creep behaviour, with stress-dependent anisotropy at C-
C. At
C, the
specimens show higher creep rate at high stress levels compared to
specimens. At lower stresses, the creep rates are similar for both directions. For the creep tests at higher temperatures, the
specimens generally show higher creep rates. However, based on the tensile tests at
C, it could be seen that the
specimens had higher creep rates.
• To account for the stress-dependent anisotropy, a double-Norton term has been used for the rate-dependent part of the inelastic strain, where the anisotropy was represented using different equivalent Hill stresses for each Norton term.
• With the static recovery term in the backstress evolution, the primary creep stage could be described by the model.
• The mid-life hysteresis loop was simulated with the use of a cycle jumping procedure, where the material parameters are changed from a virgin state to mid-life parameters. This enabled for good predictions and computational efficient simulations.
• With the use of an ageing term dependent on maximum temperature, that affects the temperature-dependent yield stress, the mid-life behaviour of the TMF tests with C was simulated with good accuracy. Without this ageing term, less accurate predictions were seen, especially for the
specimen.
index_MHT.dvi
Download (347 KB)index_MHT.bbl
Download (12.5 KB)index_MHT.ps
Download (14.6 MB)Acknowledgments
This research has been funded by Linköping University and Siemens Energy AB, the support of which is gratefully acknowledged.
Disclosure statement
No potential conflict of interest was reported by the author(s).
Data availability statement
The data required to reproduce the results cannot be shared due to confidentiality with regard to the partner company intellectual properties.
Supplementary material
Supplemental data for this article can be accessed online at https://doi.org/10.1080/09603409.2024.2336279
References
- Andersson O, Graichen A, Brodin H, et al. Developing additive manufacturing technology for Burner repair. J Eng Gas Turbine Power. 2016;139(3):031506. doi: 10.1115/1.4034235
- Navrotsky V. Industrialization and current field experience of 3d printed gas turbine components. POWER-GEN Asia 2018; Jakarta (Indonesia). 2018. p. 365.
- Shi J, Zhou S, Chen H, et al. Microstructure and creep anisotropy of inconel 718 alloy processed by selective laser melting. Mater Sci Eng A. 2021 Feb;805:140583. doi: 10.1016/j.msea.2020.140583
- Yin Y, Zhang J, Gao J, et al. Laser powder bed fusion of ni-based hastelloy x superalloy: microstructure, anisotropic mechanical properties and strengthening mechanisms. Mater Sci Eng A. 2021 Oct;827:142076. doi: 10.1016/j.msea.2021.142076
- Jirandehi AP, Hajshirmohammadi B, Carrion P, et al. Strain energy-based fatigue failure analyses of LB-PBF inconel 718: effect of build orientation. Additive Manuf. 2022 Apr;52:102661. doi: 10.1016/j.addma.2022.102661
- Somlo K, Frodal B, Funch C, et al. Anisotropic yield surfaces of additively manufactured metals simulated with crystal plasticity. Eur J Mech A Solids. 2022 Jul;94:104506. doi: 10.1016/j.euromechsol.2022.104506
- Lindström T, Nilsson D, Simonsson K, et al. Constitutive model for thermomechanical fatigue conditions of an additively manufactured combustor alloy. Mech Mater. 2022 May;168:104273. doi: 10.1016/j.mechmat.2022.104273
- Wu S, Song H, Peng H, et al. A microstructure-based creep model for additively manufactured nickel-based superalloys. Acta Materialia. 2022 Feb;224:117528. doi: 10.1016/j.actamat.2021.117528
- Bronkhorst C, Mayeur J, Livescu V, et al. Structural representation of additively manufactured 316L austenitic stainless steel. Int J Plast. 2019;118:70–86. doi: 10.1016/j.ijplas.2019.01.012
- He Y, Ma Y, Zhang W, et al. Effects of build direction on thermal exposure and creep performance of SLM ti6al4v titanium alloy. Eng Fail Anal. 2022 May;135:106063. doi: 10.1016/j.engfailanal.2022.106063
- Mooney B, Agius D, Kourousis KI. Cyclic plasticity of the as-built EOS maraging steel: preliminary experimental and computational results. Appl Sci. 2020;10(4):1232. doi: 10.3390/app10041232
- Jin S, Sun J, Yuan H. Anisotropic cyclic plasticity modeling for additively manufactured nickel-based superalloys. Fatigue Fract Eng Mater Struct. 2022 Jun;45(8):2371–2387. doi: 10.1111/ffe.13752
- Ahmed R, Hassan T. Constitutive modeling for thermo-mechanical low-cycle fatigue-creep stress–strain responses of haynes 230. Int J Solids Struct. 2017;126-127:122–139. doi: 10.1016/j.ijsolstr.2017.07.031
- Ohno N, Yamamoto R, Okumura D. Thermo-mechanical cyclic hardening behavior of 304 stainless steel at large temperature ranges: experiments and simulations. Int J Mech Sci. 2018;146-147:517–526. doi: 10.1016/j.ijmecsci.2017.06.018
- Shenoy M, McDowell D, Neu R. Transversely isotropic viscoplasticity model for a directionally solidified Ni-base superalloy. Int J Plast. 2006;22(12):2301–2326. doi: 10.1016/j.ijplas.2006.03.003
- Hu XA, Yang XG, Shi DQ, et al. Constitutive modeling of a directionally solidified nickel-based superalloy DZ125 subjected to thermal mechanical creep fatigue loadings. Rare Met. 2016;38(10):922–936. doi: 10.1007/s12598-016-0713-8
- Jiang Y. A fatigue criterion for general multiaxial loading. Fatigue Fract Eng Mater Struct. 2000;23(1):19–32. doi: 10.1046/j.1460-2695.2000.00247.x
- Coffin LJ. A study of the effects of the cyclic thermal stresses on a ductile metal. Transactions of The AMSE. 1954 76;76(6):931–949. doi: 10.1115/1.4015020
- Manson S. 1953. Behavior of materials under conditions of thermal stress. National Advisory Committee For Aeronautics NACA TN-2933.
- Hasselqvist M. TMF crack initiation lifing of austenitic carbide precipitating alloys. In Proc. ASME. GT2004. Turbo Expo 2004. American Society of Mechanical Engineers; 2004. Vol. 4. p. 875–883. doi: 10.1115/GT2004-54333
- Oh YJ, Yang WJ, Jung JG, et al. Thermomechanical fatigue behavior and lifetime prediction of niobium-bearing ferritic stainless steels. Int J Fatigue. 2012 Jul;40:36–42. doi: 10.1016/j.ijfatigue.2012.01.013
- Nagesha A, Valsan M, Kannan R, et al. Thermomechanical fatigue evaluation and life prediction of 316l(n) stainless steel. Int J Fatigue. 2009 Apr;31(4):636–643.
- Mücke R, Woratat P. A cyclic life prediction approach for directionally solidified nickel superalloys. J Eng Gas Turbine Power. 2010;132(5):052401. doi: 10.1115/1.3205027
- Leidermark D, Simonsson K. Procedures for handling computationally heavy cyclic load cases with application to a disc alloy material. Mater High Temp. 2019;36(5):447–458. doi: 10.1080/09603409.2019.1631587
- Lindström T, Ewest D, Simonsson K, et al. Constitutive model of an additively manufactured ductile nickel-based superalloy undergoing cyclic plasticity. Int J Plast. 2020;132:102752. doi: 10.1016/j.ijplas.2020.102752
- Hasselqvist M. Aspects of creep-fatigue in gas turbine hot parts [ dissertation]. Linköping University; 2001.
- Keshavarzkermani A, Esmaeilizadeh R, Ali U, et al. Controlling mechanical properties of additively manufactured hastelloy X by altering solidification pattern during laser powder-bed fusion. Mater Sci Eng A. 2019;762:138081. doi: 10.1016/j.msea.2019.138081
- Banoth S, Palleda TN, Saito T, et al. Effects of yttrium and silicon contents in hastelloy-x built by selective laser melting process. J Alloys Compd. 2022 Mar;896:163050. doi: 10.1016/j.jallcom.2021.163050
- Tomus D, Tian Y, Rometsch P, et al. Influence of post heat treatments on anisotropy of mechanical behaviour and microstructure of hastelloy-x parts produced by selective laser melting. Mater Sci Eng A. 2016;667:42–53. https://www.sciencedirect.com/science/article/pii/S0921509316304804 Available from
- Pilgar C, Fernandez A, Lucarini S, et al. Effect of printing direction and thickness on the mechanical behavior of slm fabricated hastelloy-x. Int J Plast. 2022;153:103250. https://www.sciencedirect.com/science/article/pii/S0749641922000353 Available from
- Brodin H, Andersson O, Johansson S. Mechanical behaviour and microstructure correlation in a selective laser melted superalloy. In: ASME Turbo Expo 2013: Turbine Technical Conference and Exposition. ASME; 2013. Doi: 10.1115/gt2013-95878.
- Lindström T, Calmunger M, Eriksson R, et al. Fatigue behaviour of an additively manufactured ductile gas turbine superalloy. Theor Appl Fract Mech. 2020;108:102604. doi: 10.1016/j.tafmec.2020.102604
- International Organization for Standardization (ISO). Metallic materials - uniaxial creep testing in tension - method of test. ISO; 204:2018. 2018.
- Yu CH, Peng RL, Lee TL, et al. Anisotropic behaviours of LPBF hastelloy x under slow strain rate tensile testing at elevated temperature. Mater Sci Eng A. 2022 Jun;844:143174. doi: 10.1016/j.msea.2022.143174
- Sakthivel T, Laha K, Nandagopal M, et al. Effect of temperature and strain rate on serrated flow behaviour of hastelloy x. Mater Sci Eng A. 2012 Feb;534:580–587. doi: 10.1016/j.msea.2011.12.011
- Rowlands B, Rae C, Galindo-Nava E. The portevin-le chatelier effect in nickel-base superalloys: origins, consequences and comparison to strain ageing in other alloy systems. Pro Mater Sci. 2023;132:101038. https://www.sciencedirect.com/science/article/pii/S0079642522001190
- Moverare JJ, Johansson S, Reed RC. Deformation and damage mechanisms during thermal–mechanical fatigue of a single-crystal superalloy. Acta Materialia. 2009;57(7):2266–2276. doi: 10.1016/j.actamat.2009.01.027
- Almroth P, Hasselqvist M, Simonsson K, et al. Viscoplastic–plastic modelling of IN792. Comput Mater Sci. 2004;29(4):437–445. doi: 10.1016/j.commatsci.2003.12.002
- Becker M, Hackenberg HP. A constitutive model for rate dependent and rate independent inelasticity. application to IN718. Int J Plast. 2011;27(4):596–619. doi: 10.1016/j.ijplas.2010.08.005
- White PS. An investigation of the anisotropy of the secondary creep rate in CMSX-4. Materials for Advanced Power Engineering 1998, Proceedings of the 6th Liège Conference, Part II. Universite de Liege; 1998;5:1059–1068.
- Ohno N, Wang JD. Kinematic hardening rules with critical state of dynamic recovery, part I: formulation and basic features for ratchetting behavior. Int J Plast. 1993;9(3):375–390. doi: 10.1016/0749-6419(93)90042-O
- Chaboche J. A review of some plasticity and viscoplasticity constitutive theories. Int J Plast. 2008;24(10):1642–1693. doi: 10.1016/j.ijplas.2008.03.009
- Ohno N, Wang JD. Kinematic hardening rules with critical state of dynamic recovery, part II: application to experiments of ratchetting behavior. Int J Plast. 1993;9(3):391–403. doi: 10.1016/0749-6419(93)90043-P
- Montero-Sistiaga ML, Liu Z, Bautmans L, et al. Effect of temperature on the microstructure and tensile properties of micro-crack free hastelloy x produced by selective laser melting. Additive Manuf. 2020 Jan;31:100995. doi: 10.1016/j.addma.2019.100995
- Cheng X, Du Z, Chu S, et al. The effect of subsequent heating treatment on the microstructure and mechanical properties of additive manufactured hastelloy x alloy. Mater Charact. 2022 Apr;186:111799. doi: 10.1016/j.matchar.2022.111799
- Saarim/”aki J, Lundberg M, Moverare J, et al. 3d residual stresses in selective laser melted hastelloy x. In: Residual Stresses 2016: ICRS-10. Materials Research Proceedings; 2016; Vol. 2: p. 73–78. Doi: 10.21741/9781945291173-13.
- Pant P, Proper S, Luzin V, et al. Mapping of residual stresses in as-built inconel 718 fabricated by laser powder bed fusion: a neutron diffraction study of build orientation influence on residual stresses. Additive Manuf. 2020;36:101501. https://www.sciencedirect.com/science/article/pii/S2214860420308733 Available from
- ABAQUS. 6.12 documentation. Providence, Rhode Island, USA; 2014.
- Leidermark D, Segersäll M. Modelling of thermomechanical fatigue stress relaxation in a single-crystal nickel-base superalloy. Comput Mater Sci. 2014;90:61–70. doi: 10.1016/j.commatsci.2014.04.009
- Lindström T, Nilsson D, Simonsson K, et al. Accounting for anisotropic, anisothermal, and inelastic effects in crack initiation lifing of additively manufactured components. Fatigue Fract Eng Mater Struct. 2023 Nov;46(2):396–415.
- Chaboche JL, Gaubert A, Kanouté P, et al. Viscoplastic constitutive equations of combustion chamber materials including cyclic hardening and dynamic strain aging. Int J Plast. 2013;46:1–22. doi: 10.1016/j.ijplas.2012.09.011
- McDowell DL. A nonlinear kinematic hardening theory for cyclic thermoplasticity and thermoviscoplasticity. Int J Plast. 1992;8(6):695–728. doi: 10.1016/0749-6419(92)90024-7
- Mücke R, Bernhardi OE. On temperature rate terms for viscoplastic constitutive models with applications to high temperature materials. Comput Methods Appl Mech Eng. 2006;195(19–22):2411–2431. doi: 10.1016/j.cma.2005.05.021