
 ?Mathematical formulae have been encoded as MathML and are displayed in this HTML version using MathJax in order to improve their display. Uncheck the box to turn MathJax off. This feature requires Javascript. Click on a formula to zoom.
ABSTRACT
Urban land consumption negatively impacts ecosystem services such as food production, carbon regulation, and water absorption. Despite indications of densification in some large cities, evidence shows that built-up land has been increasing faster than population globally. However, existing research disproportionally focuses on large cities, overlooking intermediate and rural territories. Our study examines the trajectories of urban land consumption along the urban-rural gradient in France between 1975 and 2020. We quantify built-up land per capita (BPC) and the changes therein and compare it to a 7-level classification of territories according to their density. BPC increased 59%, combining a 95% increase in built-up land and a 23% population growth. Yet, BPC change varied considerably across the seven territory classes: very scattered rural areas experienced the largest growth (+190 m2) while large cities grew more efficiently (+11 m2). Intermediate territories, such as peri-urban areas and small cities, increased BPC by 65% and 78%, respectively. Our findings confirm the hypothesis of urban land use polarization, as rural areas were sparser than large cities in the base year, and this difference increased over time. This underlines the urgency to address the distinct land use trajectories for effective no net land take policies.
1 Introduction
The expansion of built-up land, and the associated soil sealing, threatens biodiversity, reduces the capacity of natural areas to provide crucial ecosystem services, increases the risk of floods, and the severity of heat stress (European Commission Citation2021; Foley et al. Citation2005). Dispersed settlements tend to generate higher greenhouse gasses emissions, consuming more land and energy per household (Westerink et al. Citation2013). Moreover, urbanization typically occurs on the most productive soils (Nizeyimana et al. Citation2001), endangering agriculture and food production, and leading to indirect losses in natural areas by displacing agricultural areas (van Vliet Citation2019). The expansion of built-up areas negatively impacts ecosystem services, not only within the urbanized zones themselves, but also extends to surrounding natural landscapes (Alberti Citation2005; Seto, Güneralp, and Hutyra Citation2012). Widespread human activities alter the functioning of vulnerable ecosystems and contribute to their environmental degradation (García-Ayllón and Radke Citation2021).
In recent decades, built-up land has consistently increased at a faster rate than population growth (Güneralp et al. Citation2020; Schiavina et al. Citation2022), resulting in an increase in urban land consumption, measured by Built-up land Per Capita (BPC). BPC is a measure of the efficiency of built-up land used to accommodate human activity (Li, Verburg, and van Vliet Citation2022). The concept is composed of the amount of built-up land compared to population, at a point in time. An increase in BPC indicates that built-up land change is superior to the demographic increase for the same area and suggests a less efficient use of built-up land. Over recent decades, Europe showed a less efficient use of built-up land than many other regions (Schiavina et al. Citation2022), a process primarily driven by urban sprawl (EEA-FOEN Citation2006).
As part of its 2030 Soil Strategy, the European Union reiterated its goal instituted in 2011 of a ‘no net land take’ by 2050 (European Commission Citation2011, Citation2021). The objective is to maintain the current level of urban land consumption (referred to by the European Commission as land take) by increasing density, recycling existing built-up land, and restoring degraded soils. However, nearly 18,000 km2 of built-up land was added between 2000 and 2018 in Europe, while only 1,000 km2 of existing built-up land was retrofitted (EEA Citation2006). The main drivers of urban land consumption are the expansion of diffuse urban fabric, industrial and commercial sites, and construction sites, each accounting for approximately 20% of the total urban land consumption.
Limiting urban land consumption is a pressing issue considering the forecasts on urban population growth (Seto, Güneralp, and Hutyra Citation2012). Yet, it is challenging for policymakers to address it effectively due to the complexity of the underpinning political, social, and economic factors. To develop effective policies, it is critical to fully understand how urban land consumption has developed, which types of territories contributed the most to urban land consumption, and how built-up and population influenced the increase in BPC. Furthermore, García-Ayllón and Pilz (Citation2024) reaffirm the importance of meticulous spatial analysis of territorial evolution in the study of ecosystem resilience. Extending urban/rural planning policies without considering the specificity of territories leads to an inadequacy of public action (Allen Citation2003). Yet, about 80% of existing studies on urban land change focus on cities of more than 1 million inhabitants, and 62% of existing studies use three or fewer time stamps to characterize urban land change (Reba and Seto Citation2020). Other studies typically include a rather coarse categorization of land, i.e. urban vs. rural, or large cities, small-medium cities, and rural areas (Güneralp et al. Citation2020; Li, Verburg, and van Vliet Citation2022), which does not reflect the diversity of territories and their dynamics (van Vliet et al. Citation2019). Hence, we do not know how urban land consumption varies within these territory classes, nor what their trajectories over a long period of time were. Intermediate territories are typically bundled together, though they may represent different types of urban centres (i.e. small cities, medium cities, peri-urban cities, or rural towns). For instance, peri-urban areas benefit from the attractiveness of the main urban centre they depend on, and in certain cases are administered together with this urban centre (Woltjer Citation2014). Urban land consumption dynamics of peri-urban cities may consequently differ from that of independent small cities, medium cities, or rural towns.
This study aims to characterize the BPC trajectories of different types of urban to rural territories, and how each type contributed to BPC change, using France as a case study. Combining historical data on built-up land and population with a classification of territories from urban to rural, we analyze the evolution of urban land consumption in France in five-year increments between 1975 and 2020 along the urban-rural gradient. We apply the existing classification by the French National Institute of Statistics and Economic Studies (Insee), which categorizes the nearly 35,000 French territories into seven density classes that span from urban to rural, further referred to as ‘territory classes’.
Underlying this study is the hypothesis of urban polarization, as proposed by Li, Verburg, and van Vliet (Citation2022), analogous to the process of agricultural land use polarization (García-Martín et al. Citation2021; Levers et al. Citation2018). This phenomenon would yield densifying urban centres (decrease in BPC) and sprawling peri-urban and rural areas (increase in BPC) at the same time. Earlier studies suggest that the hypothesis of urban polarization might hold for France, as these found a densification of Paris (Schiavina et al. Citation2022), in parallel with a decreased population density in French rural areas (Oliveau and Doignon Citation2019).
In addition to the main hypothesis of urban polarization, we further expect that there is a significant difference in the rates of change in (1) BPC, (2) population, and (3) built-up land between the seven territory classes. This hypothesis is not necessarily directional, as we test it based on a pairwise comparison of all types of territories. Yet, the hypothesis is based on the observation that the process of urbanization has led to population growth in larger cities mainly and sometimes also to depopulation of rural areas. Similarly, we expect that the built-up growth in territories already largely built up, such as large cities, be less than in areas where land availability is high, such as scattered rural areas. Consistently, we expect the BPC to increase strongest in rural areas, and less or even decrease in urban areas.
2 Materials and methods
We operationalized the concept of urban land consumption using built-up land per capita (BPC) as an indicator. BPC is expressed by relating built-up land and population in five-year increments between 1975 and 2020 and compared it to the 7-level classification of territories (). This procedure allowed to analyze the trajectories of urban land consumption over time for different territory classes (). Second, we performed ANOVA tests to identify potential differences between territory classes in changes in BPC, changes in built-up land, and changes in population.
Figure 1. Methodological flow chart of this study.
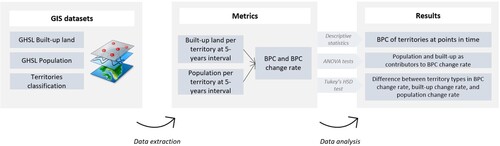
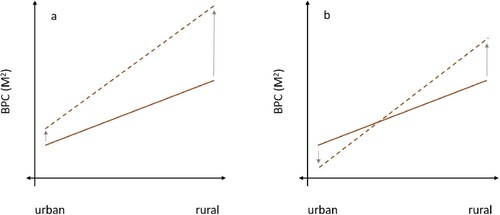
Figure 2. conceptual model of (a) relative urban land polarization, and (b) absolute urban land polarization. In both cases, in the starting year, BPC is lower on the urban side of the urban-rural gradient, and the difference increases over time (indicated by the arrows). Yet, while relative polarization is characterized by an increase in BPC in all territory classes, absolute polarization has changes in BPC in different directions of the urban-rural gradient.
2.1. Research area
France is a 68-million inhabitant country with zones of temperate, highland and Mediterranean climates. The French territory includes the mainland territory (inclusive of the island of Corsica) and overseas territories, which are excluded from the present analysis. As of 1/1/2021, the mainland French territory is divided into 13 regions, 96 departments, and 34 836 territories (‘communes’), which present a large diversity of population density, built-up land patterns, and dynamics.
2.2. Data
Our analysis combined spatial data of built-up land and population over the period from 1975 to 2020, and the territorial subdivision and classification for territories in France (). The delineation of territories and the classification of territories were sourced from local geographic and statistics institutes and are effective as of 1/1/2021.
Table 1. Overview of data sources.
The GHSL built-up data (Pesaresi and Politis Citation2023) consist of a raster depicting the total square meters of built-up surface by epoch. We utilized a 100 m resolution for this analysis, which is the finest resolution available over the different time periods analyzed. We used ten time stamps in five-year increments from 1975 to 2020.
Population data are sourced from the GHSL (Schiavina et al. Citation2023) and depict the absolute population per cell. Similar to built-up data, we selected a 100 m resolution and ten time stamps in five-year increments from 1975 to 2020.
The French National Institute of Statistics and Economic Studies (Insee) produced a classification of the ∼35,000 French territories according to the Level 2 of the degree of urbanization, which includes seven territory classes (Insee Citation2022), further referred to as ‘territory classes’. The classes are determined by clustering French territories based on population density. We analyzed urban land consumption based at the level of the territory, which allows for the highest granularity, and we included only mainland territories (inclusive of Corsica). To define administrative areas, we used the statistics produced by the French National Institute for Geographical and Forestry Information (IGN Citation2022) due to its consistency with the classification of territories. Because the number of territories fluctuates over time, consistency in the list of territories and in the effective date was important in selecting data sources. presents the distribution of territories, population, and built-up land according to the classification of territories, and shows the spatial distribution of these classes.
Figure 3. Classification of territories.
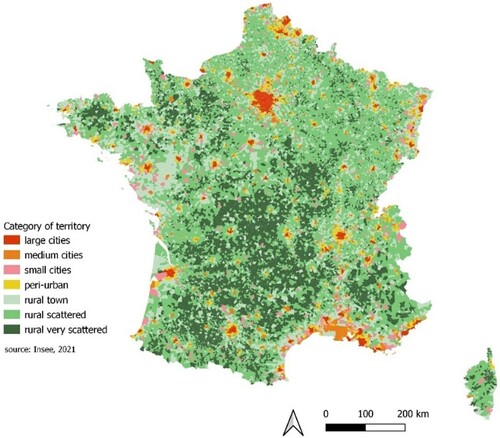
Table 2. Distribution of territories and 2020 population according to the classification of territories.
To identify possible alternative patterns of development of BPC, we also used additional categorizations of territories, including littoral, mountainous, and touristic territories. To identify littoral territories, we selected the list of territories that are subject to the 1986 so-called ‘Littoral law’ (data.gouv.fr Citation2023a). Similarly, to identify mountainous territories, we selected the list of territories that are subject to the 1985 so-called ‘Mountain law’ (data.gouv.fr Citation2023b). Data on touristic territories were obtained from the official classification from the Ministry of Economy and Finance (Ministère de l’Economie et des Finances, Citation2023). At each of the respective effective dates used for the analysis, there were 830 littoral territories, 5,525 mountainous territories, and 471 touristic territories. Due to the possible overlap of these characteristics (for instance littoral and touristic), the sum of territories, including those that present none of these characteristics, does not add up to 100%.
2.3. Data analysis
For each time stamp (from 1975 to 2020 in 5-year increments), built-up land and population for each of the nearly 35,000 territories were extracted from the raster files. BPC was calculated by dividing the built-up land by the population of that territory (Equation 1). Average BPC per territory class was calculated by relating the total built-up land for the territory class to the total population for this territory class. Total built-up land and total population for a territory class were obtained by adding the built-up land and population of all the territories categorized in each territory class. Similarly, BPC for each characteristic (mountainous, seashore, and touristic) was obtained by relating total built-up land to population for the territories which include each characteristic. BPC was analyzed as an absolute value and as a change rate between two dates. Change rates were calculated in 5-year periods, as well as for the overall study period (2020 compared to 1975) following Equation 2.
(1)
(1)
(2)
(2) Change rates are relevant to analyze trends over time. In addition, the two components of BPC, built-up land and population, were analyzed as an absolute value and as a change rate between two dates. All changes were expressed as a percentage of the starting year and expressed at the level of a territory. All data were analyzed using QGIS 3.22 and projected in RGF93 v1 / Lambert-93 – France – EPSG:2154.
We used ANOVA tests to analyze whether there is a significant difference between the territory classes in the BPC change rate, the population change rate, and the built-up land change rate. If the hypothesis of no difference between the territory classes was rejected, we ran a Tukey’s HSD test to identify the particular territory classes that are different in the dependent variables. All statistical tests were performed in R.
3. Results
This section presents the findings from our analysis of urban land consumption, detailing the evolution of BPC across the seven territory classes from 1975 to 2020 in France. We observe changes in BPC over the period and review population dynamics and expansion in built-up land. We review the contributors to BPC change rate resulting from the statistical analysis, and finally, we analyze BPC in light of specific territorial characteristics such as littoral, mountainous, and touristic.
3.1. Urban land consumption
Over the 45-year study period, BPC in France increased 59% between 1975 and 2020, from 97 m2 to 154 m2. Between 1975 and 1985, total BPC increased consistently, at a rate of +1.3 m2 annually, with a faster increase in the 1990–2000 decade (+1.7 m2).
In the year 1975, BPC was growing along the urban–rural gradient, with large cities showing the lowest BPC, and very scattered rural areas the highest ((a)). Considerable differences exist across territories and in the evolution of BPC between territories (). In 1975, large cities had an average BPC of 55 m2, while other urban areas – including medium, peri-urban, small cities, and rural towns – had a higher average BPC, ranging from 82 m2 for medium cities to 125 m2 for rural towns. In the base year, rural scattered and very scattered rural territories had the highest average BPC among all territories, of 164 and 236 m2, respectively. All types of territories increased BPC over the study period, although the intensity of the incremental BPC varied. Large cities experienced the smallest increase in average BPC over the total period (+11 m2). Further, among the ten most populated cities in 2020, which are all categorized as large cities, all but two even experienced densification, i.e. a decrease in BPC (See Table S1). Intermediate territories experienced a medium increase in BPC (+53 m2 to +82 m2). Rural areas experienced the largest increase in BPC, in particular very scattered rural areas (+190 m2).
Figure 4. (a) Change in average BPC per class of territory 1975-2020. Representation of BPC change in square metres between 1975–2020 (b) for the overall country, and detail of class of territory for territories which experienced (c) a decrease in BPC, and (c) a large increase in BPC (> 200 m2) over the period.
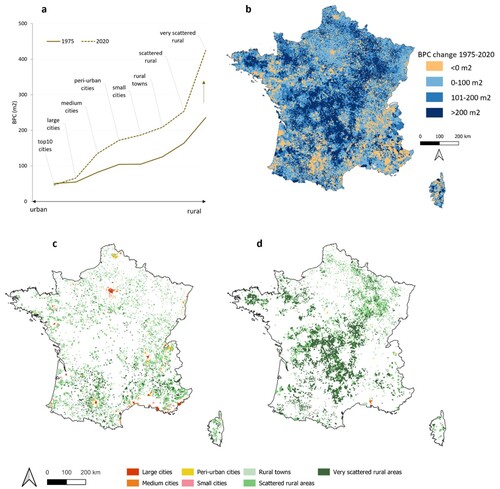
Table 3. Evolution of population, built-up land, and BPC 1975–2020 for the seven territory classes.
Throughout the study period, the average BPC is consistently larger for less urbanized territory classes ((a)). In other words, the more urbanized the class of territory is, the lower the BPC, on average. Conversely, the more rural the class of territory is, the higher the average BPC. Additionally, the difference between the most urban and most rural areas increased over time. In 1975, BPC of very scattered rural territories was four times higher than that of large cities; in 2020, it was six times higher.
Territories that densified over the study period, represented in orange on (b), are located in and around large cities such as Paris, Lille, Bordeaux, Toulouse, Nantes, and Rennes, but also on larger regions such as along the Loire and the Rhone valleys, the Mediterranean Basin, and along the Atlantic littoral. Overall, the southern half includes more regions that densified than the northern half. Territories that increased BPC the most (>200 m2 over the entire period), represented in dark blue, are also geographically consistent. These include a vast central part of the country, stretching from the Ardennes region in the Northeast towards the Charente region in the West, and along the Massif Central. BPC in specific regions in central Brittany and southern Normandy also increased considerably. The analysis of territories that densified reveals that proportionally more urban territories densified than rural ones ((c)). Additionally, the centre of several large cities densified. Interestingly, certain rural territories located in the further periphery of the largest cities also densified, as visible in (c) around Paris, Rennes, Nantes, Bordeaux, Lyon, or Toulouse. On the other hand, the territories that increased BPC the most (>200 m2), as presented in (d), are mostly very scattered rural territories.
3.2. Evolution of population and built-up land
The increase in BPC is primarily driven by built-up growth, rather than population dynamics (a). Overall, on the period, the population grew by 23% while built-up land increased 95%. This relative decoupling between population and built-up land increased in intensity over the study period.
In aggregate, all territory classes followed the trend of a larger increase in built-up land than in population. However, results show different changes along the urban-rural gradient (). Large cities were the most efficient in their trajectories, although built-up growth surpassed population growth in large cities, too. A second group includes peri-urban cities, rural towns, and scattered rural areas. These territory classes, which experienced an above-average demographic growth, increased built-up land three to four times more than population. Finally, medium cities and very scattered rural areas demonstrated the greatest relative decoupling between the two metrics due to a low demographic growth (5% and 8% between 1975 and 2020, respectively).
Figure 5. Evolution of (a) population and (b) built-up land by territory class 1975-2020.
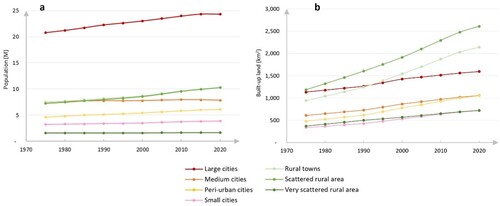
Territories experienced differentiated demographic dynamics ((a)). Between 1975 and 1990, peri-urban areas showed the highest demographic growth – nearly +1% annually – while very scattered areas showed the lowest growth (+0.1% annually). Since the mid-1990s, medium cities showed the lowest demographic growth (on average +0.1% annually), while scattered rural areas experienced the highest increase (on average +1.0% annually). Additionally, nearly one third of all territories lost population between 1975-2020. Negative population change rates occurred mainly in very scattered rural territories (43% of them lost population) and medium cities (39% lost population). Conversely, cities added the largest number of inhabitants (+3.6 million), albeit the largest proportional growth was found in scattered rural areas (+42% population), rural towns (+36%) and peri-urban cities (+33%).
Between 1975 and 2020, France added 4,800 km2 of built-up surface, or a 95% increase over the 45-year period ((b)). Most built-up land was added in scattered rural areas (+1,400 km2) and rural towns (+1,200 km2), accounting together for 54% of the added built-up surface. The largest increase in overall built-up land occurred between 1990 and 2015, at an average rate of 125 km2 annually, or close to a 2% annual increase rate. Virtually all territories added built-up land over the period. However, the territories that added the least built-up land, relative to 1975, were large cities. Among the territories that added less than 10% built-up land over 45 years, 90% are located in the greater Paris region. Conversely, territories that added the most built-up land relative to 1975 were rural.
3.3. Contributors to BPC change rate
To identify possible differences between territory classes in BPC change rate, we performed one-way ANOVA tests on three quantitative dependent variables: BPC change rate, population change rate, and built-up land change rate. The dependent variables represent change rates between 1975 and 2020. The test results (See Table S2) revealed a statistically significant difference with all three dependent variables between at least two groups.
Tukey’s HSD test for multiple comparisons found that the mean value of BPC change rate was significantly different (p < 0.05, see Table S3) between all the pairs inclusive of very scattered rural areas (differences in means ranged between 0.36 and 0.77), all those inclusive of large cities (differences in means ranged between 0.27 and 0.77), and the pair scattered rural areas – rural towns (difference in means 0.08). The difference in means between large cities and very scattered rural areas was the largest of all pairs (0.77). The differences in means between all other combinations ranged between – 0.06 and 0.14, but was not significant at p < 0.05.
For the difference in built-up land change rates between regions, Tukey’s HSD test for multiple comparisons was significantly different (p < 0.05, see Table S4) between all pairs, except for two: small cities – rural towns (p = 0.94) and scattered rural area – peri-urban cities (p = 1.00). The largest differences in means were found in pairs that included large cities (difference in means comprised between 0.24 and 0.77), in pairs that included medium cities (difference in means comprised between 0.13 and 0.53), and in pairs that included very scattered rural areas (difference in means comprised between – 0.40 and 0.37). The differences in means between all other combinations were comprised between – 0.09 and 0.09.
The difference in population change rates was significantly different in 9 out of the 21 pairs studied (Tukey’s HSD test, p < 0.05, see Table S5). The pairs that were different included four pairs with medium cities (against large cities, small cities, rural towns, and scattered rural areas), three pairs with very scattered rural areas (against small cities, rural towns, and scattered rural areas), and two pairs with peri-urban cities (against rural towns and scattered rural areas). The largest differences in means were found in the four pairs that included medium cities.
3.4. Characteristics of littoral, mountainous and touristic territories
Characteristics of territories, such as their location on the seashore, in the mountain, or their touristic nature, influenced BPC over the period (). Mountainous territories showed a 25% to 30% higher BPC than the total country throughout the period. The increase in built-up land was nearly five times that of the demographic growth, which negatively impacted BPC change rate (+80 m2 between 1975 and 2020, or a 66% increase). On the other hand, territories classified as touristic showed a lower BPC than the country average, and a lower BPC change rate over the total period (+28 m2, or a 37% increase).
Figure 6. Evolution of average BPC per characteristic.
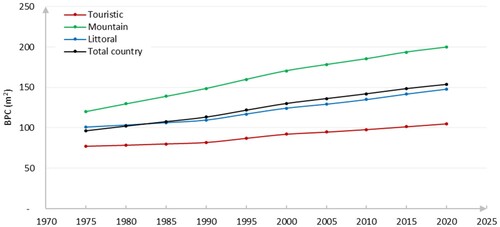
As littoral, mountainous, and touristic territories could fall under any category of territories, we compared the BPC of territories based on both their specific characteristics and the class of territories. Over the period, mountainous territories generally presented a lower BPC than for the overall type of territory. On the other hand, territories located on the littoral and those classified as touristic were generally presenting a higher BPC than the overall territory type.
The population growth in territories with a specific characteristic was slightly less than the national average, with +18% for coastal areas, + 21% for mountainous regions, and +20% for touristic territories, compared to a + 23% national average over the 1975–2020 period. Regarding built-up land, built-up land in mountainous territories increased by 101%, slightly higher than the national average of 95%. On the other hand, built-up land in seashore and touristic territories increased by 74% and 64%, respectively, significantly lower than the national average.
4. Discussion
4.1. Polarization of urban land
The main results of the study indicate a relative polarization of urban land consumption between the territory classes: BPC is higher in rural areas than in urban areas at in 1975, and this difference grows over time. These findings partially confirm our main hypothesis of increased land use polarization (Li, Verburg, and van Vliet Citation2022). However, overall, the population increased 23%, while built-up land increased 95%, leading nationally to a surge in BPC of 59%, or 57 m2 over 45 years.
A closer investigation even shows that eight of the ten largest cities in France experienced densification (i.e. a decrease in BPC), indicating that urbanization could lead to an absolute polarization of urban land consumption. This decrease in BPC was observed primarily in large cities, characterized by a greater increase in population than in built-up land, while no decrease in built-up land was observed. This finding confirms the widely observed global trend of densification of large cities, as evidenced by multiple findings across the world (Angel et al. Citation2021; Cortinovis, Geneletti, and Haase Citation2022; Novotný, Chakraborty, and Maity Citation2022; Schiavina et al. Citation2022). However, in our study results, the average trajectory of all territories characterized as large cities shows an increase in BPC, from 55 to 66 m2. Therefore, we can only partially confirm our hypothesis of absolute polarization. The difference between the ten largest cities and all territories indicated as large cities could be explained by two factors: (1) we look at a longer period than most studies by taking a 45-year period (Reba and Seto Citation2020), and (2) the definition of large cities in the classification of territories used is broader than that typically used by scholars, especially for international samples. Most studies focus on cities of 1 million and more inhabitants (Reba and Seto Citation2020), which only Paris qualifies for in France.
Another nuance to the densification trend is that the absolute level of urban land consumption should be compared. While two territories may have a similar trajectory of densification over time, the resulting BPC could be highly different. Per our results, the city of Paris achieved a reduction of BPC from 17 m2 in 1975–15 m2 in 2020 (population +14%, built-up land +2%), confirming the densification observed by Schiavina et al. (Citation2022). This is partially a result of the capital’s policy of densification and 15-minute city (Mairie de Paris Citation2022). Other cities categorized in our study as large cities, for instance Toulouse, decreased BPC by 16%, or – 12 m2 per capita, but with a significantly higher 2020 BPC of 63 m2. In this case, it is possible that the scarcity of land within the agglomeration increased the price of land within the agglomeration, pushing urban development further away from the city centre.
Additionally, while our results show that the largest urban centres have densified over the period, this densification can come in parallel with sprawl in the immediate and broader periphery. For instance in and around Toulouse where the city centre densified over the period (−13 m2 over the period). Yet, the areas directly outside the centre experienced a large increase in built-up which exceeded the population growth, resulting in an increase in BPC. Further away from the centre we observed densification again, driven by a relatively large increase in population. Our understanding is that beyond the densification of the inner-city, the first peripheric circle grew mainly non-residential built-up such as shopping centres, factories, and office buildings. This is particularly visible along highways that connect the region to the centre of Toulouse. The second circle, characterized with longer distances to the city, but more affordable land, is where population grew the most, resulting in an increase in BPC.
Finally, a limited number of territories exhibited no new built-up land. While this might suggest the phenomenon of ‘hard densification’ (Teller Citation2021), i.e. an increase in population at constant built-up land, another hypothesis is that of an oversized supply of housing at the beginning of the period, or an overpopulation of dwellings, rather than a sustainable trajectory of urban land consumption. Indeed, the vast majority of the territories that added the least built-up land are large cities in the Greater Paris region, which were built post-war to accommodate a rapidly growing population. However, the large housing complexes built in the 1960s outside of Paris and other large urban centres were soon disfavoured (Legoullon Citation2014).
This section outlines several limitations inherent to this study. The classification of territories used for the analysis is dated 2021 and the analysis is looking at the evolution of the BPC backwards, i.e. from 1975 to today. Because territories constantly evolve, especially on a multi-decade scale, this approach does not take into consideration the classification of territories at the beginning of the period (which is not an available data point). For instance, a medium city that would have lost a significant part of its population may be analyzed as a small city, as opposed to a medium city at the beginning of the period. In this example, BPC change rate is analyzed as belonging to a small city category. This limitation may somewhat distort the absolute results per category. However, it does not affect the comparability of territories’ trajectories. Similarly, the administrative delimitation of territories, in particular the area of cities, change over time, affecting the BPC per territory. Where a city expanded its administrative borders, the BPC of the earlier periods may have been underestimated by considering a later administrative classification. Furthermore, another limitation pertains to the variability in the quality of satellite imagery underlying the spatial data used in this study. Specifically, in older satellite images, the detection of buildings in rural areas presents a challenge, potentially leading to a slight overestimation of the expansion of built-up land.
4.2. Processes underlying changes in urban land consumption
The uneven evolution of population, combined with a large increase in built-up land across the territory classes, resulted in a greater increase in BPC in intermediate and rural areas than in urban ones.
First, population dynamics were unevenly distributed among the territory classes. The analysis of shrinking territories reveals this diversity. About 30% of the territories experienced a loss in population from 1975 to 2020, particularly in very scattered rural areas, in small cities, and in medium cities in the central, northeastern and eastern parts of the country. Similar to the phenomenon analyzed by Schiavina et al. (Citation2022) throughout Europe, built-up areas expanded even in regions where population declined. Döringer et al. (Citation2020) attribute Western Europe's urban shrinkage to deindustrialization (46%), out-migration (22%), and suburbanization (15%). Our findings align with these factors and illustrate three types of shrinking French urban areas (Cunningham-Sabot and Fol Citation2009). First, large urban areas in the North, East and in Normandy, declined due to deindustrialization, typically in former industrial and mining cities with economic specializations that have not successfully transitioned (Wolff et al. Citation2013). Second, small cities in the central rural part of the country grew isolated from infrastructure and networks (Bigo Citation2020), in regions already impacted by out-migration from agricultural decline and deintensification of agriculture (Levers et al. Citation2018). Wolff et al. (Citation2013) add that the majority of these shrinking areas experience outmigration, rather than a decline in birth rates. Lastly, Cunningham-Sabot and Fol (Citation2009) identify growing urban areas with declining city centres but expanding suburbs, suggesting the suburbanization process described by Döringer et al. (Citation2020) for Western Europe. Wolff et al. (Citation2013) add that suburbanization is not sufficient to explain all the migration out of city centres; instead, they argue that a general trend of migration from North to South of the country and towards the coastal areas could also be causing shrinkage.
A second explanation relates to the number of dwellings, which increased significantly over the past decades (from 23.6 million in 1982–36.2 million in 2021) due to demographic transformations and lifestyle changes (Freppel Citation2021). From 1968 to 2018, the number of primary residences grew twice as fast as population, driven by a decrease in household size, from 3.1 persons in 1968–2.2 in 2018, and a tendency for generations to no longer cohabit (Freppel Citation2021). As homes expanded in size (Insee Citation2022), older, smaller dwellings, particularly those in rural areas, were disfavoured. Vacant dwellings increased too: by 2021, they constituted 8.2% of the housing stock in France, or 2.9 million dwellings. In parallel, the increase in secondary homes, up to 3.6 million dwellings in 2021, driven by an aging population, higher income levels and an increase in tourism, contributed to the overall increase in the number of dwellings.
Finally, the increase in built-up land in shrinking territories can be partially explained by their touristic characteristics, where applicable. Castilla-Polo et al. (Citation2023) define tourism migration as the ‘residential mobilities linked to leisure patterns or long-stay tourist displacements related to private dwellings’. The increase in built-up land in touristic territories reflects an increase in secondary housing and touristic amenities. In parallel, gentrification of touristic areas leads to displacement of the local communities and population loss, as evidenced in touristic areas in different parts of the world (Glorioso and Moss Citation2007; Herrera, Smith, and Vera Citation2007; Thompson, Johnson, and Hanes Citation2016), which causes population loss. In mountainous regions, most ski stations were built or renovated in the 1960s and 1970s, partially explaining the larger increase in BPC of +80 m2, compared to the national average of +57 m2. The population loss in certain mountainous territories suggests the phenomenon of amenity migration described by Glorioso and Moss (Citation2007), where local residents are no longer able to afford living in their own community upon an increase in touristic activity. In the Tarentaise Valley as an illustration, high-altitude territories such as Brides-Les-Bains (scattered rural area; – 33%) and Moûtiers (rural town; – 34%) lost population over the study period, while urban centres further down the valley, such as Albertville, gained population (medium city; + 32%). Seashore territories were also impacted by tourism-related migration. The increase in population along the seashores, in particular the Mediterranean, can be explained by an increase in amenity tourism due to the natural capital of these territories, an overall income growth (Gosnell and Abrams Citation2011), and an increase in retirement tourism driven by an aging population (King, Warnes, and Williams Citation1998). These phenomena lead to an increase in secondary homes. Indeed, 40% of today’s secondary homes are located on the littoral and two thirds of secondary residence owners are 60 years old or more (Châtel, Nicolas Cochez, and de Bellefon Citation2021).
4.3. Land use policies driving changes in BPC
Observed trajectories in built-up land, population, and BPC can to some extent be explained by the different spatial planning policies in France during the study period. In the 1950s and 1960s, large high-density peri-urban housing complexes were constructed on former rural land to address the challenge of demographic growth and post-war reconstruction (Legoullon Citation2014). However, these then-modern complexes soon became less favoured by the middle class (Legoullon Citation2014). In the late 1960s, the French Government acted on both the supply and demand sides to encourage new construction, following a neo-liberal pattern (Blanc Citation2004). On the supply side, it encouraged the industrialized delivery of ‘cheap one-family houses on large and remote suburban estates’ (Blanc Citation2004). On the demand side, financial assistance programmes directly targeting new construction were implemented since the late 1970s and further enhanced in the 1990s and 2000s. It is only in the late 2010s that public policy started shifting gears and implementing policies to curb sprawl, through the revitalization of centres of small and medium cities including programmes such as Action coeur de ville and Petites villes de demain, but without rolling back existing incentives in favour of new construction.
The 1982 decentralization of urban planning indirectly contributed to the increase in built-up land. First, intensification in agriculture (Levers et al. Citation2018) made underutilized land accessible for development (Brueckner Citation2000). Second, given that territories primarily rely on taxation based on the population to secure financing (budget.gouv.fr Citation2024) and that no regulation exists on the transformation of abandoned agricultural land, a supply-driven construction market developed (Vergriete Citation2013). Finally, decades of policies encouraging new construction unintendedly favoured the rise of a powerful real estate industry since the years 2000s, creating a ‘co-dependence’ between public and private actors (Pollard Citation2023). Research conducted by Vergriete (Citation2013) reveals that real estate development activity from the years 2000s was largely due to tax benefits and particularly occurred in small and medium cities in rural areas with a lower negotiating power and level of expertise. Our results show indeed that each territory contributed a small amount of incremental built-up land (0.6 hectares in median for 1975-2020), but their large number led to substantial growth over the period (+4,800 km2). This expansion resulted in certain local rental markets becoming oversupplied, specifically of smaller dwellings, in line with the observation that small dwellings in rural areas and in small cities present an above-average vacancy rate (Insee Citation2022).
4.4. Implications for no net land take
In 2021, as part of the French Climate and Resilience law, an objective of zero net artificialization by 2050 was set in law. This reflects the implementation of the EU’s objective of no net land take by 2050 adopted in 2011. The objective of such goals is to balance urbanization with land preservation. Although there is no consensus in the scientific literature on the sustainability of dense urban forms (Berghauser Pont et al. Citation2021), densification is currently the preferred urban development pathway. Theévelopcation of habitat has widely been promoted as a more sustainable urban development pathway (Cavicchia and Cucca Citation2022), reducing energy consumption and pollution stemming from transportation, (Westerink et al. Citation2013). However, the large increase of built-up land over our study period (+4,800 km2) shows the ambition of achieving no zero net artificialization. Decades of incentives, decentralized urbanism to dozens of thousands of local territories, and powerful economic interests in favour of further construction, are challenging to reverse. Indeed, strong resistance against the law arose from the nearly 35,000 mayors who are keen on maintaining autonomy over territorial development decisions, a trend also present in other countries (e.g. Gradinaru et al. Citation2023). In summer 2023, the Senate granted each territory classified as rural (or nearly 31,000) a 1-hectare reserve for incremental built-up land. This negotiation is at odds with this study’s findings, which indicate that the median increase in built-up was only 0.6 ha per territory over 45 years, but that the large number of territories made the overall built-up land almost double.
Altogether, the zero net artificialization goal is the first major effort to curb decades of urban sprawl, although its implementation promises to be challenging given the variety of interests at play. With the dual objective to reduce urban land consumption and comply with the zero net artificialization by 2050, it is crucial for policy makers to reassess the approach to construction and urban planning. The following strategies could be implemented.
First, it requires halting new construction and associated infrastructure development. New construction on agricultural land has multiple negative impacts, including ecological, socio-economic, and threatens food security. In addition, residential built-up land comes with a requirement to build additional transport and telecommunications infrastructure, services and recreation. Thus, housing projects on vacant agricultural land should urgently be halted. The law amendment of granting additional flexibility to rural territories for construction should also be reverted.
Second, improvements to existing built-up areas should be encouraged. This includes the renovation and rehabilitation of existing housing stock, including the 3.0 million vacant dwellings where applicable, the revitalization of small and medium cities and rural towns, and the targeted densification of existing neighbourhoods. Mass renovation and rehabilitation projects could be prioritized to standards of energy efficiency, safety, and livability. These ‘no regret’ measures would participate in reducing energy consumption and total greenhouse gasses emissions, and in improving socio-economic conditions in established neighbourhoods.
Finally, national policies could encourage the expansion of natural (protected) areas and eliminate perverse subsidies for new construction. This could include land-use regulation of former agricultural land, discontinuation of tax benefits for new construction, or the implementation of incentives connected to natural capital preservation for rural territories. These measures ultimately require a shift in the decades-old economic model of territories to align their interests with halting uncontrolled built-up land and preserving natural areas.
5. Conclusion
This study reveals a polarization in the trajectories of urban land consumption between urban and rural territories in France from 1975 to 2020, confirming the hypothesis of a relative polarization. More specifically, while average BPC has increased substantially (+59%), this increase is not equally distributed over the territory classes: BPC in the most rural territories rose from 236 to 425 m2, whereas large cities contained the BPC increase from 55 to 66 m2. Both spatial and statistical analysis revealed that the increase in BPC was driven by an increase in built-up land (+95%) rather than population (+23%). Our assumption is that the increase in built-up land at least partially results from decades of public policies and financial incentives encouraging newly built residential housing in a decentralized urbanism model.
As European policies call for a drastic reduction in urban land consumption, until reaching no net land take by 2050, it is urgent for policymakers to halt urban land consumption, in particular in the most rural areas. The implementation of such an ambition should be accompanied by a review of the current incentives and fiscal policies that may be counterproductive to the objective, and by the identification of new revenue streams for territories that would align with the preservation of the environmental heritage.
Supplemental Material
Download MS Word (26.9 KB)Disclosure statement
No potential conflict of interest was reported by the author(s).
Additional information
Funding
References
- Alberti, M. 2005. “The Effects of Urban Patterns on Ecosystem Function.” International Regional Science Review 28 (2): 168–192. doi:10.1177/0160017605275160
- Allen, A. 2003. “Environmental Planning and Management of the Peri-Urban Interface: Perspectives on an Emerging Field.” Environment and Urbanization 15 (1): 135–148. doi:10.1177/095624780301500103.
- Angel, S., P. Lamson-Hall, A. Blei, S. Shingade, and S. Kumar. 2021. “Densify and Expand: A Global Analysis of Recent Urban Growth.” Sustainability (Switzerland 13: 7. doi:10.3390/su13073835.
- Berghauser Pont, M., P. Haupt, P. Berg, V. Alstäde, and A. Heyman. 2021. “Systematic Review and Comparison of Densification Effects and Planning Motivations.” Buildings and Cities 2 (1): 378–401. doi:10.5334/bc.125.
- Bigo, A. 2020. Les transports face au défi de la transition énergétique. Explorations entre passé et avenir, technologie et sobriété, accélération et ralentissement (Doctoral dissertation, Institut polytechnique de Paris). https://hal.archives-ouvertes.fr/tel-03082127v1.
- Blanc, M. 2004. “The Changing Role of the State in French Housing Policies: A Roll-out Without Roll-Back?” European Journal of Housing Policy 4 (3): 283–302. doi:10.1080/1461671042000307260.
- Brueckner, J. K. 2000. “Urban Sprawl: Diagnosis and Remedies.” International Regional Science Review 23 (2): 160–171.
- budget.gouv.fr. 2024. Un dynamisme des recettes porté par la fiscalité directe et les transferts financiers de l’Etat | budget.gouv.fr. January 29, 2020. https://www.budget.gouv.fr/reperes/finances_publiques/articles/un-dynamisme-des-recettes-porte-par-la-fiscalite-directe-et-les.
- Castilla-Polo, A., R. Huete-Nieves, A. Mantecón, and C. Rosa-Jiménez. 2023. “Explaining the Complexity in the Tourism-Migration Conceptual Framework.” Current Issues in Tourism 26 (3): 358–379. doi:10.1080/13683500.2022.2084717.
- Cavicchia, R., and R. Cucca. 2022. “Urban Densification and Its Social Sustainability.” In The Palgrave Encyclopedia of Urban and Regional Futures, edited by R. C. Brears, 1–14. Cham: Palgrave Macmillan. https://doi.org/10.1007/978-3-030-87745-3_156
- Châtel, F., N. Nicolas Cochez, and M. de Bellefon. 2021. “Deux résidences secondaires sur trois sont détenues par un ménage de 60 ans ou plus.” https://www.insee.fr/fr/statistiques/5416748#titre-bloc-19
- Cortinovis, C., D. Geneletti, and D. Haase. 2022. “Higher Immigration and Lower Land Take Rates are Driving a new Densification Wave in European Cities.” Npj Urban Sustainability 2: 1. doi:10.1038/s42949-022-00062-0.
- Cunningham-Sabot, E., and S. Fol. 2009. "Shrinking Cities in France and Great Britain Shrinking Cities in France and Great Britain: A Silent Process?" The Future of Shrinking Cities: Problems, Patterns and Strategies of Urban Transformation in a Global Context, 17–28.
- Data.gouv.fr.. 2023a. “Communes de la loi littoral au Code Officiel Géographique (COG 2020->2022).” In data.gouv.fr. https://www.data.gouv.fr/fr/datasets/communes-de-la-loi-littoral-au-code-officiel-geographique-cog-2020-2022/
- data.gouv.fr.. 2023b. “Communes de la loi Montagne au Code Officiel Géographique (COG 2020->2022).” In data.gouv.fr. https://www.data.gouv.fr/fr/datasets/communes-de-la-loi-montagne-au-code-officiel-geographique-cog-2020-2022/
- Döringer, S., Y. Uchiyama, M. Penker, and R. Kohsaka. 2020. “A Meta-Analysis of Shrinking Cities in Europe and Japan.” Towards an Integrative Research Agenda. European Planning Studies 28 (9): 1693–1712. doi:10.1080/09654313.2019.1604635.
- EEA-FOEN. 2006. “Urban sprawl in Europe.” In Joint EEA-FOEN report.
- European Commission. 2011. “Roadmap to a Resource Efficient Europe. European Environment Agency.” https://eur-lex.europa.eu/legal-content/EN/TXT/HTML/?uri = CELEX:52011DC0571
- European Commission. 2021. “EU Soil Strategy for 2030.” https://www.eea.europa.eu/data-and-maps/dashboards/land-take-statistics#tab-based-on-data
- Foley, J., R. DeFries, G. Asner, C. Barford, G. Bonan, S. Carpenter, F. Stuart Chapin, et al. 2005. “Global Consequences of Land Use.” Science 309: 5734. doi:10.1126/science.1111772.
- Freppel, C., & Insee. (2021). “37,2 millions de logements en France au 1er janvier 2021.” Insee. https://www.insee.fr/fr/statistiques/5761272
- García-Ayllón, S., and J. Pilz. 2024. “Editorial: Territorial Spatial Evolution Process and its Ecological Resilience.” Frontiers in Environmental Science 12: 1373672. doi:10.3389/fenvs.2024.1373672.
- García-Ayllón, S., and J. Radke. 2021. “Diffuse Anthropization Impacts in Vulnerable Protected Areas: Comparative Analysis of the Spatial Correlation Between Land Transformation and Ecological Deterioration of Three Wetlands in Spain.” ISPRS International Journal Of Geo-Information 10 (9): 630. doi:10.3390/ijgi10090630.
- García-Martín, M., C. Quintas-Soriano, M. Torralba, F. Wolpert, and T. Plieninger. 2021. “Landscape Change in Europe.” In Human-Environmnent Interactions 8: 17–37. doi:10.1007/978-3-030-50841-8_2.
- Glorioso, R., and L. Moss. 2007. Amenity migration to mountain regions: Current knowledge and a strategic construct for sustainable management. In Social Change (Vol. 37, Issue 1). www.amenitymigration.org
- Gosnell, H., and J. Abrams. 2011. “Amenity Migration: Diverse Conceptualizations of Drivers, Socioeconomic Dimensions, and Emerging Challenges.” GeoJournal 76 (4): 303–322. doi:10.1007/s10708-009-9295-4.
- Gradinaru, S., M. Paraschiv, C. Iojă, and J. Van Vliet. 2023. “Conflicting Interests Between Local Governments and the European Target of no net Land Take.” Environmental Science & Policy 142: 1–11. doi:10.1016/j.envsci.2023.01.012.
- Güneralp, B., M. Reba, B. Hales, E. Wentz, and K. Seto. 2020. “Trends in Urban Land Expansion, Density, and Land Transitions from 1970 to 2010: A Global Synthesis.” Environmental Research Letters 15: 4. doi:10.1088/1748-9326/ab6669.
- Herrera, L. Smith, and M. Vera. 2007. “Gentrification, Displacement, and Tourism in Santa Cruz de Tenerife.” Urban Geography 28 (3): 276–298. doi:10.2747/0272-3638.28.3.276.
- IGN. 2022. “Contours des communes de France simplifié, avec régions et département d’outre-mer rapprochés.” In data.gouv.fr. data.gouv.fr. https://www.data.gouv.fr/fr/datasets/contours-des-communes-de-france-simplifie-avec-regions-et-departement-doutre-mer-rapproches/#/resources
- Insee. 2022. “Taille des ménages – Données annuelles de 1968 à 2019.” Insee. https://www.insee.fr/fr/statistiques/2381486#tableau-figure1_radio1
- Insee. 2023. “La grille communale de densité.” Insee. Insee. https://www.insee.fr/fr/information/6439600
- King, R., A. Warnes, and A. Williams. 1998. “International Retirement Migration in Europe.” International Journal of Population Geography 4 (2): 91–111. doi:10.1002/(SICI)1099-1220(199806)4:2<91::AID-IJPG97>3.0.CO;2-S.
- Legoullon, G. 2014. “Les grands ensembles en France. Genèse d’une politique publique (1945-1962).” (Comité des travaux historiques et scientifiques., Ed.). Comité des travaux historiques et scientifiques.
- Levers, C., D. Müller, K. Erb, H. Haberl, M. Jepsen, M. Metzger, P. Meyfroidt, et al. 2018. “Archetypical Patterns and Trajectories of Land Systems in Europe.” Regional Environmental Change 18 (3): 715–732. doi:10.1007/s10113-015-0907-x.
- Li, M., P. Verburg, and J. van Vliet. 2022. “Global Trends and Local Variations in Land Take per Person.” Landscape and Urban Planning 218: 104308. doi:10.1016/j.landurbplan.2021.104308.
- Mairie de Paris. 2022. “Paris ville du quart d’heure, ou le pari de la proximité. Paris.Fr.” https://www.paris.fr/dossiers/paris-ville-du-quart-d-heure-ou-le-pari-de-la-proximite-37
- Ministere de l'Economie et des Finances - Stations classées et communes touristiques | entreprises.gouv.fr. 2023. entreprises.gouv.fr. https://www.entreprises.gouv.fr/fr/tourisme/developpement-et-competitivite-du-secteur/stations-classees-et-communes-touristiques
- Nizeyimana, E., G. Petersen, M. Imhoff, H. Sinclair, S. Waltman, D. Reed-Margetan, E. Levine, and J. Russo. 2001. “Assessing the Impact of Land Conversion to Urban Use on Soils with Different Productivity Levels in the USA.” Soil Science Society of America Journal 65 (2): 391–402. doi:10.2136/sssaj2001.652391x.
- Novotný, J., S. Chakraborty, and I. Maity. 2022. “Urban Expansion of the 43 Worlds’ Largest Megacities: A Search for Unified Macro-Patterns.” Habitat International 129: 102676. doi:10.1016/j.habitatint.2022.102676.
- Oliveau, S., and Y. Doignon. 2019. Is the French Diagonal Emptying? An Exploratory Spatial Analysis of Demographic Decrease in France for the Past 50 Years. Cybergeo. doi:10.4000/cybergeo.31641.
- Pesaresi, M., and P. Politis. 2023. “GHS-BUILT-S R2023A – GHS Built-up Surface Grid, Derived from Sentinel2 Composite and Landsat, Multitemporal (1975-2030). In European Commission.” Joint Research Centre (JRC, doi:10.2905/D07D81B4-7680-4D28-B896-583745C27085.
- Pollard, J. 2023. “The Political Conditions of the Rise of Real-Estate Developers in French Housing Policies.” Environment and Planning C: Politics and Space 41 (2): 274–291. doi:10.1177/23996544221129125.
- Reba, M., and K. Seto. 2020. “A Systematic Review and Assessment of Algorithms to Detect, Characterize, and Monitor Urban Land Change.” Remote Sensing of Environment 242: 111739. doi:10.1016/j.rse.2020.111739.
- Schiavina, M., S. Freire, A. Carioli, and K. MacManus. 2023. “GHS-POP R2023A – GHS Population Grid Multitemporal (1975-2030). In European Commission.” Joint Research Centre (JRC, doi:10.2905/D6D86A90-4351-4508-99C1-CB074B022C4A.
- Schiavina, M., M. Melchiorri, C. Corbane, S. Freire, and F. Batista e Silva. 2022a. “Built-up Areas are Expanding Faster Than Population Growth: Regional Patterns and Trajectories in Europe.” Journal of Land Use Science 17 (1): 591–608. doi:10.1080/1747423X.2022.2055184.
- Schiavina, M., M. Melchiorri, S. Freire, P. Florio, D. Ehrlich, P. Tommasi, M. Pesaresi, and T. Kemper. 2022b. “Land use Efficiency of Functional Urban Areas: Global Pattern and Evolution of Development Trajectories.” Habitat International 123: 102543. doi:10.1016/j.habitatint.2022.102543.
- Seto, K., B. Güneralp, and L. Hutyra. 2012. “Global Forecasts of Urban Expansion to 2030 and Direct Impacts on Biodiversity and Carbon Pools.” Proceedings of the National Academy of Sciences of the United States of America 109 (40): 16083–16088. doi:10.1073/pnas.1211658109.
- Teller, J. 2021. “Regulating Urban Densification: What Factors Should be Used?” Buildings and Cities 2 (1): 302–317. doi:10.5334/bc.123.
- Thompson, C., T. Johnson, and S. Hanes. 2016. “Vulnerability of Fishing Communities Undergoing Gentrification.” Journal of Rural Studies 45: 165–174. doi:10.1016/j.jrurstud.2016.03.008
- van Vliet, J. 2019. “Direct and Indirect Loss of Natural Area from Urban Expansion.” Nature Sustainability 2 (8): 755–763. doi:10.1038/s41893-019-0340-0.
- van Vliet, J., P. Verburg, S. Grădinaru, and A. Hersperger. 2019. “Beyond the Urban-Rural Dichotomy: Towards a More Nuanced Analysis of Changes in Built-up Land. Computers.” Environment and Urban Systems 74: 41–49. doi:10.1016/j.compenvurbsys.2018.12.002.
- Vergriete, P. 2013. “La ville fiscalisée : politiques d’aide à l’investissement locatif, nouvelle filière de production du logement et recomposition de l’action publique locale en France (1985-2012)” [Université Paris-Est]. https://doi .org/NT: 2013PEST1061.pastel-00995364
- Westerink, J., D. Haase, A. Bauer, J. Ravetz, F. Jarrige, and C. Aalbers. 2013. “Dealing with Sustainability Trade-Offs of the Compact City in Peri-Urban Planning Across European City Regions.” European Planning Studies 21 (4): 473–497. doi:10.1080/09654313.2012.722927.
- Wolff, M., S. Fol, H. Roth, and E. Cunningham-Sabot. 2013. “Shrinking Cities, Villes en Décroissance: Une Mesure du Phénomène en France.” CyberGeo 2013. doi:10.4000/cybergeo.26136.
- Woltjer, J. 2014. “A Global Review on Peri-Urban Development and Planning.” Jurnal Perencanaan Wilayah Dan Kota 25 (1): 1–16. doi:10.5614/jpwk.2014.25.1.1