
 ?Mathematical formulae have been encoded as MathML and are displayed in this HTML version using MathJax in order to improve their display. Uncheck the box to turn MathJax off. This feature requires Javascript. Click on a formula to zoom.
ABSTRACT
To enhance the accuracy of land use classification in mining areas, the Object-based Convolutional Neural Network (OCNN) method has been widely used. However, existing researches tend to neglect the importance of decision-level fusion, focusing only on feature-level fusion. This study proposes a new classification framework with Multi-level Fusion of Object-based analysis and CNN (MFOCNN) to achieves high-accuracy land use classification in mining areas. First, Simple Linear Iterative Cluster (SLIC) is employed to generate image objects, which serve as the basic unit for classification. Second, an improved DenseNet is proposed to extract deep features from image patches, which represent image objects, and provide the classification result. Third, handcrafted features including spectral, textural and geometric of the image objects are extracted and fused with the deep features to obtain the classification result with random forest classifier. Finally, the Dempster-Shafer (DS) evidence theory is applied to fuse the two previously described classification results at the decision-level to obtain the final result. Experiments conducted in the mining areas of Erdos using Gaofen-6 images demonstrate that the proposed MFOCNN achieves the best visual performance and accuracy among all tested methods. The MFOCNN, with its feature-level fusion and decision-level fusion, significantly improves the accuracy of land use classification in mining areas. The results suggest that the proposed MFOCNN is a promising method for achieving high-accuracy land use classification in mining areas.
1. Introduction
Mineral resources constitute a vital component of natural resources, and the exploration and utilization of these resources are pivotal for social and economic progress (Xie et al. Citation2021). Open-pit mining offers favorable production conditions and high mining efficiency (Li, Xing, et al. Citation2023). However, while open-pit mining promotes regional economic growth, it also disrupts the normal land use landscape, and can potentially trigger geological disasters like landslides and collapses (Li, Xing, et al. Citation2023; Li, Xu, et al. Citation2023). As resource extraction continues, the tension between open-pit mining and the preservation of delicate ecosystems becomes increasingly pronounced. China is accelerating the development of green mining and intensifying efforts in ecological preservation (Chen et al. Citation2020). The implementation of this policy relies on mine environmental monitoring, especially open-pit mines. Land use classification is an important part of mine environmental monitoring. The classification of land use in open-pit mining areas is paramount for gaining a comprehensive understanding of the impact of mining activities on the regional geological environment (Chen et al. Citation2018b). It not only contributes to a thorough comprehension of the ecological damage process caused by open-pit mining but also aids in the scientific formulation of ecological restoration plans to mitigate such ecological harm (Chen et al. Citation2022). Moreover, accurate land use data can also facilitate a comprehensive understanding of mining activities and the identification of illegal mining practices (Li, Xing, et al. Citation2023). In summary, achieving high-accuracy and refined land-use classification in mining areas is of utmost importance (Du, Li, et al. Citation2022; Du, Xing, et al. Citation2022).
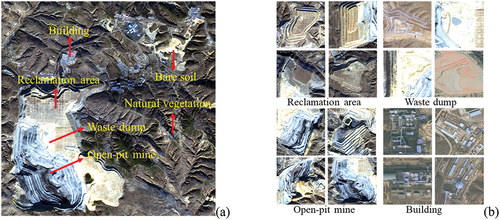
With the development of earth observation system, the spatial resolution, temporal resolution and spectral resolution of remote sensing images have been continuously improved, making it possible to implement land use classification (Li et al., ”Land Cover Classification from Remote Sensing Images,” Citation2022; Yu et al. Citation2022). In recent years, remote sensing images combined with traditional machine learning algorithms including Support Vector Machine (SVM) and Random Forest (RF) have been applied to the study of land use classification in mining areas. For instance, the algorithms of SVM and RF and images of ZiYuan-3 and WorldView-2 were used by Chen et al. (Citation2018a) and Chen, Li, and Wang (Citation2020) to conduct land use classification in several mining areas in China. However, the land use categories in mining areas are complex, with large variations in shape and scale (), and traditional machine learning algorithms have difficulties in extracting robust features to represent complex and heterogeneous scenes, resulting in achieving high-accuracy land use classification in mining areas remains a challenge (Du, Xing, et al. Citation2022; Li, Xing, et al. Citation2023).
Figure 1. A mining scene. (a) Complex scenes and heterogeneous composition; (b) large variation in shape, scale and spectrum.
With the continuous breakthrough of deep learning technology and the continuous improvement of data processing performance, more and more CNNs are proposed for image classification (e.g. VGGNet and ResNet etc.) (He et al. Citation2016; Simonyan and Zisserman Citation2014), semantic segmentation (e.g. U-Net and DeepLabv3+ etc.) (Chen et al. Citation2018; Ronneberger, Fischer, and Brox Citation2015; Xu et al. Citation2022) and object detection (e.g. Faster R-CNN and Yolo etc.) (Chen et al. Citation2023; Wang, Du, et al. Citation2022; Wang, Tan, et al. Citation2022). The application of CNNs has significantly enhanced the accuracy of land use classification across diverse and complex scenes. For instance, in intricate and heterogeneous wetland environments, Jamali et al. (Citation2022) developed a 3D Generative Adversarial Network (3D GAN), achieving high accuracy in large-scale wetland mapping. In urban settings, Cai and Chen (Citation2022) proposed the Multiscale Residual Convolutional Autoencoder (MRCAE), a novel approach for learning potential representations of different urban morphology categories. Li et al., ”Land Cover Classification from Remote Sensing Images,” (Citation2022) addressed issues related to single-scale convolutional kernel limitations by constructing a Multi-Scale Fully Convolutional Network (MSFCN). Similarly, Chen et al. (Citation2021) introduced the Dual Context Prior and Spatial Propagation Network (DSPNet), a simple yet effective network incorporating dual context prior and spatial propagation. Both methods were validated on publicly available datasets, demonstrating their effectiveness. Beyond land use classification, CNNs prove invaluable in tackling special target recognition challenges. The Earthquake-Flood-Fire-Cyclone Network (EFFCNet), for example, excels in high-precision classification and recognition of disasters such as earthquakes, floods, fires, and hurricanes in complex environments (Yuan et al. Citation2023).
Some published researches have applied CNNs in mining areas, for instance, Du, Xing, et al. (Citation2022) constructed OM-DeepLab by fusing multi-scale low-level and high-level features, which was used for the extraction of open-pit mines. RATT-UNet which combines residual connection, attention mechanism, and U-Net was proposed to extract mine road from remote sensing images (Xiao, Yin, and Fu Citation2022). Xie et al. (Citation2021) and Zhao et al. (Citation2022) proposed DUSegNet and VoVNet-v2 for the whole mining area extraction, respectively. All of the above studies have achieved good performance. However, Du, Xing, et al. (Citation2022) and Xiao, Yin, and Fu (Citation2022) only conducted extraction experiments for a certain mining area land use category. Whereas Xie et al. (Citation2021) and Zhao et al. (Citation2022) extracted the whole mine area as the target, all the above studies didn’t carry out fine-grained land use (such as open-pit mine, reclamation area, and waste dump) classification experiments within the mining area. Furthermore, some researchers have employed CNNs to achieve land use classification in mining areas. For instance, Chen et al. (Citation2022) introduced a hybrid open-pit mining mapping framework utilizing Gaofen-2 images and an improved U-Net, which successfully achieved fine-grained classification of land use categories in mining areas. Similarly, Zhou et al. (Citation2023) proposed the Edge Feature Enhancement and Graph Convolutional UNet (EG-UNet), incorporating an edge feature enhancement module and long-range information module, which demonstrated outstanding performance on both a constructed mining land use classification dataset and the publicly available Gaofen Image Dataset. Both of the aforementioned studies employed image pixels as the basic unit for land use classification. However, several researches have highlighted the advantages of using image objects as the basic classification unit in comparison to pixels (Liu et al. Citation2020; Zhang et al. Citation2018; Zhao, Du, and Emery Citation2017). These advantages include: 1) The boundaries of image objects fit the real boundaries of ground objects, making land use results based on image objects better match human perception. 2) Merging image pixels into objects according to formulated rules can reduce internal heterogeneity and mitigate possible pepper noise in the classification results. 3) Using objects as classification units during the classification process facilitates the extraction of handcrafted features, such as geometric features, which have proved to be useful in land use classification.
Therefore, the combination of object-based analysis and CNN is of great practical importance. The Object-based CNN (OCNN) has been proposed and applied in this context, which improves the classification accuracy and efficiency of remote sensing image (Zhang et al. Citation2018). The published researches about OCNN mainly adopts the following three modes for land use classification. The first one is to directly extract deep features of image objects and classify using CNNs, for instance, Zhang et al. (Citation2018) used the CNN and remote sensing images for urban land use classification. The second one involves calculating handcrafted features such as spectral, texture, and geometric features from segmented remote sensing images. These calculated features are then directly input into the constructed CNNs to conduct land use classification. For instance, Wang, Chen, and Plaza (Citation2023) incorporated these handcrafted features into the Mining Feature-Enhanced Resnet (MFE-ResNet), effectively enhancing the accuracy of land use classification in open-pit mining areas. The last one is to first extract the deep features of the image objects using CNNs, and then fused with the handcrafted features, finally feeds the fused features to the traditional machine learning classifier, such as RF for land use classification. For instance, Zhao, Du, and Emery (Citation2017) and Liu et al. (Citation2020) first fused deep features and handcrafted features, and then feed the fused features into machine learning classifiers to achieve high-accuracy urban land use classification. All modes have good performance in land use classification tasks, however, existing studies still suffer from the following problems.
Multi-scale segmentation algorithms are widely used to segment images to generate image objects, however CNN requires a fixed-size image patch as input, the image patch captured from segmented images are difficult to represent the image object effectively.
CNN have shown excellent performance in feature extraction and classification. However, in mining scenes with highly heterogeneous, the generalization of CNN needs to be improved due to the large variations in shape and scale of land use categories.
Existing OCNN methods usually focus only on feature-level fusion, ignoring decision-level fusion, which can fuse different levels of complementary information to improve the accuracy of land use classification.
Given these issues and challenges, a classification framework with Multi-level Fusion of Object-based analysis and CNN (MFOCNN) is proposed and applied to fine land use classification in mining areas. Experimental results show that this framework outperforms benchmark image classification networks and semantic segmentation networks, with the best quantitative assessment result and visual effect.
The contributions of the study can be summarized as follows:
The Simple Linear Iterative Cluster (SLIC) is employed to segment images and generate image objects. Because, the boundaries of the image objects generated by SLIC match the real boundaries of the ground objects and the captured image patches better represent the image objects.
An improved DenseNet is proposed for extracting robust deep features to conquer the problem of heterogeneity in mining areas.
MFOCNN is constructed to fuse classification information in multiple levels, thus improving classification accuracy. The framework not only provides the technical support for land use classification in mining areas, but also has a wide range of generalizability.
2. Methods
The proposed framework consists of three parts, which is illustrated in .
Figure 2. Flowchart of the proposed MFOCNN.
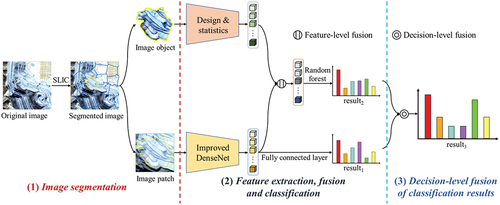
Image segmentation: SLIC is employed to segment images into image objects considering that SLIC has good results in ground object contour preservation and that the image objects generated by SLIC are more suitable as input to CNN than multi-scale segmentation algorithm.
Feature extraction and fusion: First, the image object is represented by a fixed-size image patch, and then the improved DenseNet is used to extract deep features and obtain classification result (Classification result based on improved DenseNet, result1). Second, the handcrafted features of the image object, including spectral, textural and geometric features, are extracted and fused with deep features. Finally, the fused features are fed into the RF classifier to obtain classification result (Classification result based on fused feature-random forest, result2).
Decision-level fusion of classification results: DS evidence theory is applied to fuse result1 with result2 at the decision-level to obtain the high-accuracy classification result (result3), as it has better application in fusing the results of multi-classifiers.
2.1. SLIC for image segmentation
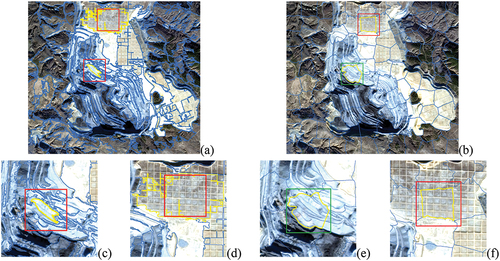
The multi-scale segmentation algorithm is widely employed to segment images into image objects which match the boundaries of the ground objects () (Liu et al. Citation2020). However, CNN requires a fixed-size image patch as input (He et al. Citation2015), the image patch captured from segmented image is difficult to represent the image object effectively. For instance, the image object is too small, so that the image patch covers a large area of non-study image objects () or the image object is too large for the image patch to cover the full image object (). Given this problem, SLIC is introduced to replace the multi-scale segmentation algorithm to generate image objects that both match the boundaries of the ground objects and are uniform in shape and scale (), aiming to solve the problem that fixed-size image patches fail to effectively represent the image objects ( (Jing et al. Citation2020).
Figure 3. Image segmentation result. (a) Result of multi-scale segmentation, (b) result of SLIC, (c) and (d) image patches are too small or too large to effectively represent the image objects in existing OCNN method, (e) and (f) image patches can effectively represent the image objects.
SLIC is a K-Means based super pixel segmentation method proposed by Achanta (Achanta et al. Citation2012). The principle of SLIC is to first select the seed points for clustering based on the number of objects expected to be segmented. Second, each pixel in the domain of the seed point is determined to belong to which cluster center, finally clustering and iterating until the segmentation result does not change, thus clustering the image into a number of super pixel objects with similar texture, color features, etc (Li, Li, et al. Citation2022). For details about SLIC, please refer to the study (Achanta et al. Citation2012).
2.2. Classification based on improved Densenet
The DenseNet was proposed by Huang et al. in 2017 (Citation2017). DenseNet has been used in land use classification and has achieved good performance in practical applications (Cai et al. Citation2021; Su et al. Citation2022). The basic module of DenseNet is dense block. The output features of any two layers in the Dense Block are connected via skip connection, which facilitates the propagation and reuse of features and also helps to alleviate the problem of gradient vanishing (Huang et al. Citation2017).
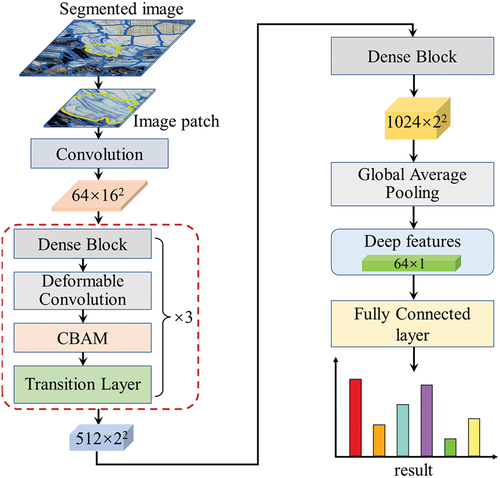
Although DenseNet performs well in many application scenes, it still falls short in land use classification of mining areas where the scene is complex and heterogeneous, as demonstrated by: (1) The size and shape of the standard convolutional kernel used in DenseNet are fixed, which limits the ability of the deep features to represent ground objects with large variation in size and shape (Zuo et al. Citation2022); (2) Each pixel in the image patch has a different effect on whether the image object can be correctly classified. Therefore, if the deep features are extracted indiscriminately at each pixel location, the invalid information acquired will interfere with the accuracy of the classification result (Li et al., “Semantic Segmentation of Remote Sensing Images,” Citation2022). To address the above-mentioned problems, deformable convolution and attention mechanism are introduced to improve DenseNet (Dai et al. Citation2017; Woo et al. Citation2018). The structure of the improved DenseNet is shown in .
Figure 4. The structure of the improved DenseNet.
As is shown in , the deformable convolution adds a direction vector to the weight of each convolution kernel on the basis of the standard convolution operation, so that the shape of the convolution kernel can change with the actual shape of the ground object (Dai et al. Citation2017).
Figure 5. The structure of deformable convolution.
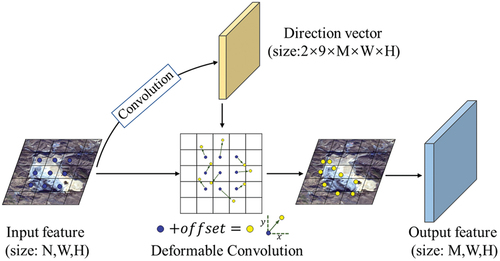
The eigenvalue calculation method of a certain position of the output feature of the deformable convolution can be defined by EquationEquation (1)(1)
(1) .
where, is the spatial position of each weight in the convolution kernel relative to the central position weight, and
;
is the convolution kernel;
is the input feature;
is the output feature;
is the position to be calculated in the input feature;
is the offset of each weight in the convolution kernel.
The attention mechanism helps guide DenseNet to enhance concentration on important pixels and important channels of the features, therefore the Convolutional Block Attention Module (CBAM) is introduced in this study (Woo et al. Citation2018). As is shown in , the CBAM consists of channel attention module and spatial attention module.
Figure 6. The structure of CBAM.
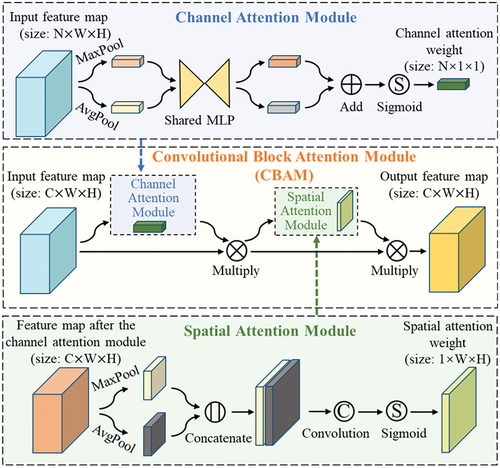
CBAM is defined in EquationEquations (2)(2)
(2) –(Equation5
(5)
(5) ):
where, denotes sigmoid function;
denotes Multi-layer Perceptron (MLP) function;
denotes global average pooling function;
denotes global max average pooling function;
denotes feature concatenated in the channel dimension;
denotes convolution operation;
is the channel attention weight;
is the spatial attention weight;
represent input feature, respectively.
and
represent the output feature of the channel attention module and spatial attention module, respectively.
As is shown in . The image patch captured from segmented images is fed into the improved DenseNet, and then the deep features adapted to the heterogeneous scene of the mining area are extracted through operations including Dense Block, deformable convolution, and CBAM. In addition, the fully connected layer at the end of the improved DenseNet is employed to get the result1.
2.3. Classification based on feature-level fusion
Several published researches have demonstrated that fusing handcrafted features and deep features can improve the accuracy of land use/land cover classification (Ge, Xie, and Meng Citation2022; Guo et al. Citation2021; Qu et al. Citation2022). Therefore, in this study, handcrafted features including spectral, textural and geometric of the image objects are designed and extracted for land use classification in the mining area (Zhao et al. Citation2017). Among them, the extraction of texture features and geometric features also contributes to the reduction of classification errors caused by the presence of shadows in the images (Ahamad et al. Citation2022). The feature extraction process involves several steps: First, it relies on Python, leveraging libraries such as Scikit-Image and the Geospatial Data Abstraction Library (GDAL) to perform SLIC on the image and obtain boundary vectors. Second, both the images and boundary vectors are imported into eCognition software. Third, multi-scale segmentation is executed within eCognition to obtain image objects, using the boundary vectors as constraints. It is important to note that when employing these vectors as constraints, the results of multi-scale segmentation are consistent with the results of SLIC. Finally, spectral, textural, and geometric features of the image objects are calculated within eCognition (Chen et al. Citation2020). After feature extraction, the most suitable feature combination is determined with the Feature Space Optimization function of eCognition (Wang, Chen, and Plaza Citation2023). As is shown in , a total of 70 handcrafted features are selected, including 22 spectral features, such as NDVI and NDWI. And 40 texture features, which are calculated based on the Gray-Level Co-occurrence Matrix (GLCM). The geometry features are 8 in total, such as boundary length and rectangular fit.
Table 1. The handcrafted features.
These handcrafted features are fused with the deep features extracted by the improved DenseNet, and the fused features can be calculated from the equation: , where,
represents the handcrafted features and
represents the deep features.
RF is an ensemble learning method for classification, which utilizes multiple decision trees to train and predict samples, and then, all trees vote for the output class (Li, Jing, and Wang Citation2021). Due to the higher generalization ability, RF are widely used in land use classification. In this study, the fused features are fed into the RF classifier to obtain result2.
2.4. Classification based on decision-level fusion
To fully combine the complementary information of multiple classifiers, DS evidence theory is employed to fuse result1 with result2 at the decision-level to obtain high-accuracy land use classification result of mining areas (result3).
DS evidence theory is usually used to deal with uncertainty problems, which can integrate the classification results of different experts or classifiers at the decision-level (Du et al. Citation2021; Shafer Citation1992). The classification probabilities of each classifier for each category of ground objects can be obtained from Section 2.2and Section 2.3 , and then the final result of DS evidence theory can be calculated by EquationEquation (6)(6)
(6) .
where, ,
,
denote the classification probabilities of the i-th category in result1, result2 and result3, respectively;
is the number of land use categories.
3. Experiments and results
3.1. Study area and dataset
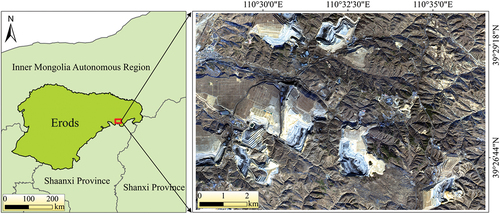
The study area is located in the coal mining areas of Erdos, Inner Mongolia Autonomous Region, China, covering an area of 101 km2. The Gaofen-6 satellite was launched on 2 June 2018, and was the sixth satellite of the China High-resolution Earth Observation System (CHEOS). As an optical remote sensing satellite, Gaofen-6 is carrying the Panchromatic & Multispectral Scanners (PMS) and the Wide Field of View Multispectral Cameras (WFV). The used images in this study were acquired by PMS on 10 December 2019, and collected from the Land Observation Satellite Service (https://data.cresda.cn/). The spatial resolution of the Panchromatic (PAN) image of the Gaofen-6 is 2 m, and the spatial resolution of the Multispectral (MS) images is 8 m. The preprocessing steps of Gaofen-6 images include radiometric calibration, atmospheric correction, geometric correction, orthorectification, and pansharpening fusion of PAN and MS images, using the PIE-Basic 6.3 (Zhang et al. Citation2023). The fused image includes 4 bands of R, G, B, and NIR, with a spatial resolution of 2 m. The location and the images coverage of the study area are shown in .
Figure 7. The study area.
After field investigation, six land use categories are determined, including Open-pit Mine (OM), Waste Dump (WD), Reclamation Area (RA), Building (BD), Natural Vegetation (NV) and Bare Soil (BS). Samples are produced through manual visual interpretation, followed by dividing the samples into training set, validation set and testing set. The number of samples is shown in .
Table 2. Number of samples.
3.2. Implementation details
The experiments are implemented on a desktop computer with Intel Xeon Gold 5118, 16.0 GB memory, and NVIDIA GeForce RTX2080Ti. All algorithms are performed using Python language (v3.6.5) on the PyCharm platform (Community Edition 2020.2.1 × 64). The deep learning framework is pytorch (v1.7.0 + cu110). To obtain the optimal classification result, the method of manual parameter tuning is employed to search for the optimal hyperparameters (Du, Li, et al. Citation2022). The hyperparameters of the MFOCNN are shown in .
Table 3. The hyperparameters of MFOCNN.
To evaluate the performance of the classification result quantitatively, F1– score, Overall Accuracy(OA) and Kappa are introduced in this study. F1– score is used to evaluate the classification effectiveness of individual categories, Overall Accuracy and Kappa are used to evaluate the overall classification effectiveness (Wang et al. Citation2023; Yang et al. Citation2022). The three indicators are defined in EquationEquations (7)(7)
(7) ~ (Equation9
(9)
(9) ).
where means User Accuracy and can be calculated by
;
means Producer Accuracy and can be calculated by
;
denotes the number of samples correctly classified as category
.
denotes the number of samples classified as category
.
where is the number of land use categories;
is the number of samples used for accuracy evaluation;
where .
3.3. Experimental results
The proposed MFOCNN has three classification results, i.e. result1, result2 and result3. To evaluate the effectiveness of the proposed method, the three results are compared and analyzed. In addition, the classification result of DenseNet (resultDN) are also added to verify the performance of the improved DenseNet.
shows the four results. In general, the four results differ significantly. For region1, the NV located underneath the BD is misclassified as OM in resultDN and result1, whereas this problem is mitigated in result2 and result3. The problem of misclassified NV as OM also exists in region2 for all results. However, the area of misclassified regions is significantly smaller in result3. The problem of misclassified NV as RA exists in resultDN, result1, and result2, yet it is alleviated in result3 (region3). There are also problems in result3, for example, some holes in the classification result of OM (region4).
Figure 8. Classification visualization results of different comparison methods.
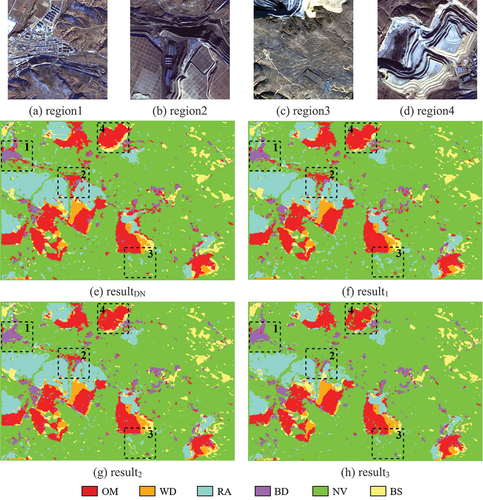
The quantitative evaluation results are shown in . The of each category in result3 is the highest, with 95.69%, 97.67%, 82.86%, 98.33%, 93.53%, and 96.59%, respectively. Result1 and result2 each have three land use categories with higher
than the other. Only the
of the RA in result1 is lower than that in resultDN. The
and
of the four results showed a trend of increasing, with result3 achieving the highest
and
of 95.6% and 0.95 respectively.
Table 4. Quantitative evaluation results of different comparison methods.
In summary, the improved DenseNet is more suitable for land use classification in mining areas than DenseNet, and the generalization ability of the model has improved considerably by incorporating the CBAM and deformable convolution. The result2, which fused handcrafted features, has a further improvement compared to result1. The DS evidence theory incorporates the advantages of both classification results, resulting in the highest accuracy in result3.
4. Discussion
4.1. Comparison of different segmentation algorithms
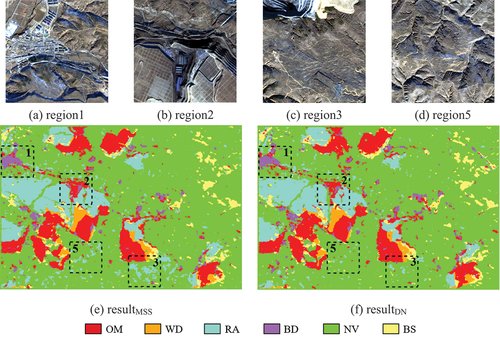
To evaluate the effectiveness of multi-scale segmentation algorithm and SLIC for land use classification in mining areas, comparative experiments based on the two segmentation algorithms are conducted using the DenseNet. The method of manual parameter tuning is employed to search for the suitable segmentation parameters. The parameters of multi-scale segmentation are set as follows: scale parameter: 20, shape index: 0.5 and compactness: 0.5, the parameters of SLIC are listed in . The results obtained by multi-scale segmentation and SLIC are defined as resultMSS and resultDN (the same as resultDN in Section 3.3).
The resultMSS and resultDN are shown in . Both the two results misclassified NV as OM (region1 and region2) and also misclassified NV as RA (region3 and region5). However, the area of misclassified regions in resultDN is smaller in comparison.
Figure 9. Classification visualization results based on different segmentation algorithms.
The quantitative evaluation results are shown in . The for each category in resultDN is higher than that in resultMSS, except for RA and BS. The
and
of resultMSS is 1.36% points and 0.02 higher than that of resultDN. In summary, the SLIC is more suitable for land use classification in mining areas.
Table 5. Quantitative evaluation results based on different segmentation algorithms.
4.2. Comparison of benchmark classification networks
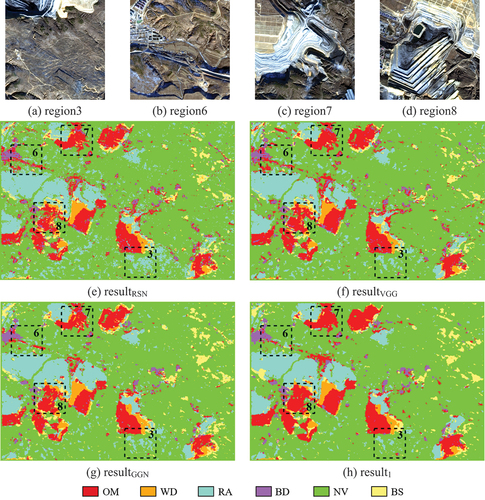
To evaluate the effectiveness of the improved DenseNet, experiments are conducted to compare the proposed improved DenseNet with benchmark classification networks including ResNet50 (He et al. Citation2016), VGGNet (Simonyan and Zisserman Citation2014), and GoogLeNet (Szegedy et al. Citation2015).
The results of the four methods i.e. resultRSN, resultVGG, resultGGN, and result1 (the same as result1 in Section 3.3) are shown in . resultRSN, resultVGG and resultGGN all have the problem of misclassified BD as OM, but not in result1 (region6). The results of the OM in result1 are neatly distributed with fewer holes than the other results (region7 and region8), and have fewer regions of NV misclassified as RA (region3).
Figure 10. Classification visualization results based on different classification networks.
The quantitative evaluation results are shown in . The for each category in result1 is higher than the other results, except for RA and BD. The
and
of result1 is significantly higher than the other results. Among the remaining three results, resultGGN has the highest
and
. In summary, the improved DenseNet outperformed GoogLeNet, ResNet and VGGNet.
Table 6. Quantitative evaluation results based on different classification networks.
4.3. Comparison of benchmark semantic segmentation networks
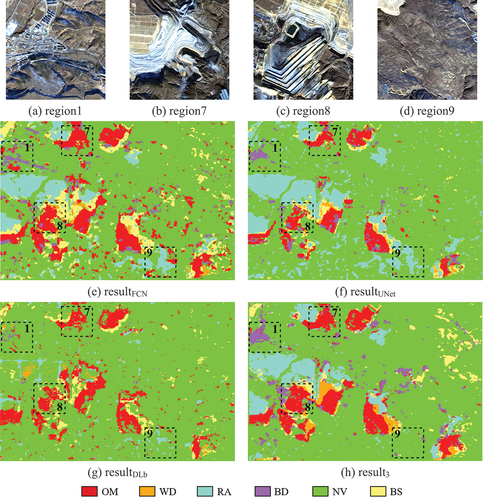
To further evaluate the effectiveness of the proposed MFOCNN, experiments are conducted with the benchmark semantic segmentation networks, including FCN (Shelhamer, Long, and Darrell Citation2017), U-Net (Ronneberger, Fischer, and Brox Citation2015) and DeepLabv3+ (Chen et al. Citation2018).
The classification results of the four methods are shown in . Overall, there are more fragmented spots in resultFCN and resultDLb. In terms of detail, the BD in resultFCN, resultDLb, and resultUNet have problems with misclassification (region1), and the OM have problems with broken boundaries and internal holes (region7 and region8). Compared to the other three results, the RA and NV in result3 are best classified (region9).
Figure 11. Classification visualization results based on different semantic segmentation networks.
The quantitative evaluation results are shown in . The OM and RA in resultUNet are 2.81 and 6.69% points higher compared to result3, respectively, with the remaining categories achieving the highest values for result3. Result3 achieved the highest and
of 95.60% and 0.95, respectively, which are 8.54% points and 0.11 higher than the sub-optimal FCN. Therefore, the proposed MFOCNN outperformed the benchmark semantic segmentation networks.
Table 7. Quantitative evaluation results based on different semantic segmentation networks.
4.4. Comparison of different segmentation parameters
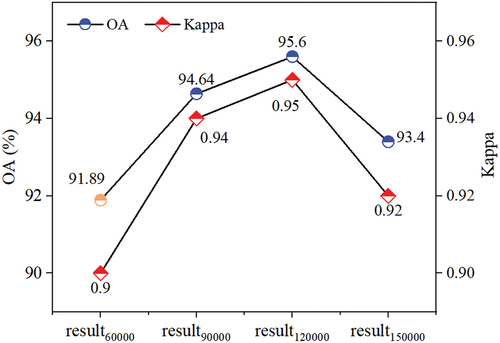
Segmentation parameters have a direct effect on the size and shape of the image objects, which in turn affects the accuracy of classification result. To explore the effect of segmentation parameters on classification result, the most important segmentation parameter of SLIC, i.e. n_segments, is discussed and analyzed.
It can be seen from that and
show a trend of increasing and then decreasing as the number of n_segments increase, with
of all the results above 91% and
of all results above 0.9, indicating the robustness of the proposed MFOCNN. The
and
achieved the highest value of 95.6% and 0.95, respectively when n_segments is set to 120,000. In summary, n_segments being set to 120,000 is a good choice for the experiment data in this study. Additionally, it’s important to take into consideration that the optimal n_segments for a given study may vary due to differences in image resolution and study area across different studies.
Figure 12. The and
of different n_segments.
4.5. Advantages and possible improvements
Compared to existing OCNN modes, the proposed MFOCNN has the following improvements. First, the SLIC is employed to generate image objects, which are more suitable for land use classification than the multi-scale segmentation algorithm used in previous researches. Second, the improved DenseNet utilized in the MFOCNN can extract deep features with greater robustness. Third, the handcrafted features and deep features are fused at the feature-level, and the results of the two OCNN modes are fused at the decision-level, which enables multi-level fusion and better utilization of complementary classification information.
Mining scenes present complex, heterogeneous, and diverse environments (see ), which make land use classification challenging. However, the experiments show that the proposed MFOCNN outperforms existing methods in mining area land use classification. In theory, the method has the potential for application in other natural scenes, such as cities (Du, Xing, et al. Citation2022).
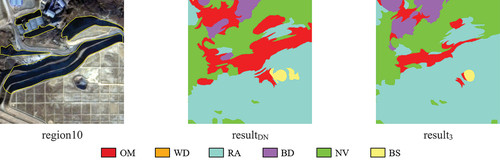
There is still potential to further improve the classification accuracy. First, handcrafted features and deep features represent different levels of information, and the method used in this study, direct fusion through channel concatenation, may not be optimal for fully utilizing these features. More effective feature fusion methods, such as Feature Pyramid Networks, will be explored in our research. Second, there are still instances of misclassification or holes in the classification results, indicating that further optimization is needed (Li, Xing, et al. Citation2023). In future research, the classification results will be improved by utilizing spatial topological relationships between land use categories and morphological algorithms. Last but not least, due to the rugged terrain and complex land use categories in the mining area, shadows are inevitable in remote sensing images. While compared to resultDN, the proposed MFOCNN partially mitigates this error through the incorporation of handcrafted features and multi-level fusion module, the challenge persists (). In future research, the fusion of high accuracy Digital Elevation Model (DEM) and contemporaneous multisource images to compensate for the spectral values of shadows will be considered.
Figure 13. Classification results in shadow areas in resultDN and result3, the yellow circled area in region 10 is shadow.
5. Conclusions
In this study, the proposed MFOCNN is applied to land use classification in mining areas, and the experiments show the best quantitative assessment result and visual effect. The conclusions of the study can be summarized as follows:
The SLIC can segment images into image objects with uniform shape and size which can be conveniently represented by fixed-size image patches, thus these image objects are suitable for input into CNN network that requires fixed-size image patches.
The generalization ability of the DenseNet has improved considerably by incorporating the CBAM and deformable convolution. The fusion of deep features with handcrafted features can further improve the robustness of the features. Finally, decision-level fusion is performed using DS evidence theory can fully combine the complementary information of multiple classifiers to further improve the accuracy of land use classification in mining areas.
It is demonstrated that the proposed MFOCNN exhibits satisfactory robustness and can achieve better classification results compared to benchmark classification networks and semantic segmentation networks.
In the future, efforts should focus on enhancing land use classification accuracy in mining areas, including the innovation of feature fusion methods for more efficient feature utilization, optimization of classification results in post-processing, and mitigation of classification errors caused by the presence of shadows.
Acknowledgements
The authors thank China Centre for Resources Satellite Data and Application (Land Observation Satellite Service, https://data.cresda.cn/) for providing us with high-resolution Gaofen-6 images. The authors also thank Bo Liu from Peking University for assisting with data analysis.
Disclosure statement
No potential conflict of interest was reported by the author(s).
Data availability statement
The remote sensing image used in this study can be acquired from the following link: https://figshare.com/s/0cd166e71ac14e73a0bc. The codes using python language can be founded from the following link: https://figshare.com/s/b1d5079b9859321dcf88.
Additional information
Funding
Notes on contributors
Jianghe Xing
Jianghe Xing is pursuing his PhD degree in surveying and mapping science and technology at China University of Mining and Technology-Beijing. His research interest is land use/land cover classification in mining areas.
Zhenwei Li
Zhenwei Li is pursuing his Master’s degree in Geodesy and Surveying Engineering at China University of Mining and Technology-Beijing. His research interest is land use/land cover classification in mining areas.
Jun Li
Jun Li received his PhD from Peking University, China. Currently he is a professor and the associate dean of the College of Geoscience and Surveying Engineering at China University of Mining and Technology-Beijing. His research interests are land spatial planning and intelligent computing and natural resource monitoring and evaluation.
Shouhang Du
Shouhang Du received his PhD from Peking University, China. Currently he is a lecturer at College of Geoscience and Surveying Engineering, China University of Mining and Technology-Beijing. His research interest is intelligent interpretation of remote sensing images based on deep learning.
Wei Li
Wei Li is pursuing his Master’s degree in Geodesy and Surveying Engineering at China University of Mining and Technology-Beijing. His research interests are ground objects change detection and extraction.
Chengye Zhang
Chengye Zhang received his PhD from Peking University, China. Currently he is an associate professor at College of Geoscience and Surveying Engineering, China University of Mining and Technology-Beijing. His research interests are geographic artificial intelligence technology and application.
References
- Achanta, R., A. Shaji, K. Smith, A. Lucchi, P. Fua, and S. Susstrunk. 2012. “SLIC Superpixels Compared to State-Of-The-Art Superpixel Methods.” IEEE Transactions on Pattern Analysis and Machine Intelligence 34 (11): 2274–2281. https://doi.org/10.1109/tpami.2012.120.
- Ahamad, A., C. C. Sun, N. J. Yang, and W. K. Kuo. 2022. “A New Fast Estimating Floor Region Based on Image Segmentation for Smart Rovers.” IET Image Processing 16 (9): 2457–2466. https://doi.org/10.1049/ipr2.12500.
- Cai, J. H., and Y. M. Chen. 2022. “A Novel Unsupervised Deep Learning Method for the Generalization of Urban Form.” Geo-Spatial Information Science 25 (4): 568–587. https://doi.org/10.1080/10095020.2022.2068384.
- Cai, H. J., T. Chen, R. Q. Niu, and A. Plaza. 2021. “Landslide Detection Using Densely Connected Convolutional Networks and Environmental Conditions.” IEEE Journal of Selected Topics in Applied Earth Observations and Remote Sensing 14: 5235–5247. https://doi.org/10.1109/jstars.2021.3079196.
- Chen, T., N. X. Hu, R. Q. Niu, N. Zhen, and A. Plaza. 2020. “Object-Oriented Open-Pit Mine Mapping Using Gaofen-2 Satellite Image and Convolutional Neural Network, for the Yuzhou City, China.” Remote Sensing 12 (23): 20. https://doi.org/10.3390/rs12233895.
- Chen, W. T., X. J. Li, H. X. He, and L. Z. Wang. 2018a. “Assessing Different Feature Sets’ Effects on Land Cover Classification in Complex Surface-Mined Landscapes by Ziyuan-3 Satellite Imagery.” Remote Sensing 10 (1): 20. https://doi.org/10.3390/rs10010023.
- Chen, W. T., X. J. Li, H. X. He, and L. Z. Wang. 2018b. “A Review of Fine-Scale Land Use and Land Cover Classification in Open-Pit Mining Areas by Remote Sensing Techniques.” Remote Sensing 10 (1): 19. https://doi.org/10.3390/rs10010015.
- Chen, L., J. J. Liu, H. Li, W. J. Zhan, B. D. Zhou, and Q. Q. Li. 2021. “Dual Context Prior and Refined Prediction for Semantic Segmentation.” Geo-Spatial Information Science 24 (2): 228–240. https://doi.org/10.1080/10095020.2020.1785957.
- Chen, W. T., X. J. Li, and L. Z. Wang. 2020. “Fine Land Cover Classification in an Open Pit Mining Area Using Optimized Support Vector Machine and Worldview-3 Imagery.” Remote Sensing 12 (1): 16. https://doi.org/10.3390/rs12010082.
- Chen, Y. L., H. L. Xu, X. J. Zhang, P. Gao, Z. G. Xu, and X. B. Huang. 2023. “An Object Detection Method for Bayberry Trees Based on an Improved YOLO Algorithm.” International Journal of Digital Earth 16 (1): 781–805. https://doi.org/10.1080/17538947.2023.2173318.
- Chen, T., X. X. Zheng, R. Q. Niu, and A. Plaza. 2022. “Open-Pit Mine Area Mapping with Gaofen-2 Satellite Images Using U-Net.” IEEE Journal of Selected Topics in Applied Earth Observations and Remote Sensing 15: 3589–3599. https://doi.org/10.1109/jstars.2022.3171290.
- Chen, L. C. E., Y. K. Zhu, G. Papandreou, F. Schroff, and H. Adam. 2018.“Encoder-Decoder with Atrous Separable Convolution for Semantic Image Segmentation.” Paper presented at the 15th European Conference on Computer Vision (ECCV), Munich, September 8–14.
- Dai, J. F., H. Z. Qi, Y. W. Xiong, Y. Li, G. D. Zhang, H. Hu, and Y. C. Wei. 2017. “Deformable Convolutional Networks.” Paper presented at the 16th IEEE International Conference on Computer Vision (ICCV), Venice, October 22-29.
- Du, S. J., S. H. Du, B. Liu, and X. Y. Zhang. 2021. “Incorporating DeepLabv3+ and Object-Based Image Analysis for Semantic Segmentation of Very High Resolution Remote Sensing Images.” International Journal of Digital Earth 14 (3): 357–378. https://doi.org/10.1080/17538947.2020.1831087.
- Du, S. H., W. Li, J. Li, S. H. Du, C. Y. Zhang, and Y. Q. Sun. 2022. “Open-Pit Mine Change Detection from High Resolution Remote Sensing Images Using DA-UNet Plus Plus and Object-Based Approach.” International Journal of Mining, Reclamation and Environment 36 (7): 512–535. https://doi.org/10.1080/17480930.2022.2072102.
- Du, S. H., J. H. Xing, J. Li, S. H. Du, C. Y. Zhang, and Y. Q. Sun. 2022. “Open-Pit Mine Extraction from Very High-Resolution Remote Sensing Images Using OM-Deeplab.” Natural Resources Research 31 (6): 3173–3194. https://doi.org/10.1007/s11053-022-10114-y.
- Ge, C. J., W. J. Xie, and L. K. Meng. 2022. “Extracting Lakes and Reservoirs from GF-1 Satellite Imagery Over China Using Improved U-Net.” IEEE Geoscience and Remote Sensing Letters 19: 5. https://doi.org/10.1109/lgrs.2022.3155653.
- Guo, Z. Q., H. L. Liu, Z. Z. Zheng, X. Chen, and Y. Liang. 2021. “Accurate Extraction of Mountain Grassland from Remote Sensing Image Using a Capsule Network.” IEEE Geoscience and Remote Sensing Letters 18 (6): 964–868. https://doi.org/10.1109/lgrs.2020.2992661.
- He, K. M., X. Y. Zhang, S. Q. Ren, and J. Sun. 2015. “Spatial Pyramid Pooling in Deep Convolutional Networks for Visual Recognition.” IEEE Transactions on Pattern Analysis and Machine Intelligence 37 (9): 1904–1916. https://doi.org/10.1109/tpami.2015.2389824.
- He, K. M., X. Y. Zhang, S. Q. Ren, and J. Sun. 2016. “Deep Residual Learning for Image Recognition.” Paper presented at the 2016 IEEE Conference on Computer Vision and Pattern Recognition (CVPR), Seattle, June 27–30.
- Huang, G., Z. Liu, L. van der Maaten, and K. Q. Weinberger. 2017. “Densely Connected Convolutional Networks.” Paper presented at the 30th IEEE/CVF Conference on Computer Vision and Pattern Recognition (CVPR), Honolulu, July 21–26.
- Jamali, A., M. Mahdianpari, F. Mohammadimanesh, and S. Homayouni. 2022. “A Deep Learning Framework Based on Generative Adversarial Networks and Vision Transformer for Complex Wetland Classification Using Limited Training Samples.” International Journal of Applied Earth Observation and Geoinformation 115: 11. https://doi.org/10.1016/j.jag.2022.103095.
- Jing, R., S. Liu, Z. N. Gong, Z. H. Wang, H. L. Guan, A. Gautam, and W. J. Zhao. 2020. “Object-Based Change Detection for VHR Remote Sensing Images Based on a Trisiamese-LSTM.” International Journal of Remote Sensing 41 (16): 6209–6231. https://doi.org/10.1080/01431161.2020.1734253.
- Li, L. H., W. P. Jing, and H. H. Wang. 2021. “Extracting the Forest Type from Remote Sensing Images by Random Forest.” IEEE Sensors Journal 21 (16): 17447–17454. https://doi.org/10.1109/jsen.2020.3045501.
- Li, Z. Q., E. Z. Li, A. Samat, T. Y. Xu, W. Liu, and Y. H. Zhu. 2022. “An Object-Oriented CNN Model Based on Improved Superpixel Segmentation for High-Resolution Remote Sensing Image Classification.” IEEE Journal of Selected Topics in Applied Earth Observations and Remote Sensing 15: 4782–4796. https://doi.org/10.1109/jstars.2022.3181744.
- Liu, B., S. H. Du, S. J. Du, and X. Y. Zhang. 2020. “Incorporating Deep Features into GEOBIA Paradigm for Remote Sensing Imagery Classification: A Patch-Based Approach.” Remote Sensing 12 (18): 24. https://doi.org/10.3390/rs12183007.
- Li, J., J. H. Xing, S. H. Du, S. H. Du, C. Y. Zhang, and W. Li. 2023. “Change Detection of Open-Pit Mine Based on Siamese Multiscale Network.” IEEE Geoscience and Remote Sensing Letters 20: 5. https://doi.org/10.1109/lgrs.2022.3232763.
- Li, J., Y. L. Xu, C. Y. Zhang, J. T. Guo, X. J. Wang, and Y. C. Zhang. 2023. “Unmixing the Coupling Influence from Driving Factors on Vegetation Changes Considering Spatio-Temporal Heterogeneity in Mining Areas: A Case Study in Xilinhot, Inner Mongolia, China.” Environmental Monitoring and Assessment 195 (1): 19. https://doi.org/10.1007/s10661-022-10815-0.
- Li, R., S. Y. Zheng, C. X. Duan, J. L. Su, and C. Zhang. 2022. “Multistage Attention ResU-Net for Semantic Segmentation of Fine-Resolution Remote Sensing Images.” IEEE Geoscience and Remote Sensing Letters 19: 5. https://doi.org/10.1109/lgrs.2021.3063381.
- Li, R., S. Y. Zheng, C. X. Duan, L. B. Wang, and C. Zhang. 2022. “Land Cover Classification from Remote Sensing Images Based on Multi-Scale Fully Convolutional Network.” Geo-Spatial Information Science 25 (2): 278–294. https://doi.org/10.1080/10095020.2021.2017237.
- Qu, L. A., M. C. Li, Z. J. Chen, W. B. Liu, J. J. Zhi, and L. C. Zhang. 2022. “Mapping Large Area Tea Plantations Using Progressive Random Forest and Google Earth Engine.” Journal of Applied Remote Sensing 16 (2): 22. https://doi.org/10.1117/1.Jrs.16.024509.
- Ronneberger, O., P. Fischer, and T. Brox. 2015. “U-Net: Convolutional Networks for Biomedical Image Segmentation.” Paper presented at the 18th International Conference on Medical Image Computing and Computer-Assisted Intervention (MICCAI), Munich, October 05-09.
- Shafer, G. 1992. “Dempster-Shafer Theory.” In Encyclopedia of Artificial Intelligence, edited by S. C. Shapiro, 330–331. New York: John Wiley & Sons.
- Shelhamer, E., J. Long, and T. Darrell. 2017. “Fully Convolutional Networks for Semantic Segmentation.” IEEE Transactions on Pattern Analysis and Machine Intelligence 39 (4): 640–651. https://doi.org/10.1109/tpami.2016.2572683.
- Simonyan, K., and A. Zisserman. 2014. “Very Deep Convolutional Networks for Large-Scale Image Recognition.” IEEE Transactions on Pattern Analysis and Machine Intelligence 36 (8): 1573–1585. https://doi.org/10.1109/TPAMI.2014.2301163.
- Su, Z. B., Y. Wang, Q. Xu, R. Gao, and Q. M. Kong. 2022. “LodgeNet: Improved Rice Lodging Recognition Using Semantic Segmentation of UAV High-Resolution Remote Sensing Images.” Computers and Electronics in Agriculture 196: 14. https://doi.org/10.1016/j.compag.2022.106873.
- Szegedy, C., W. Liu, Y. Q. Jia, P. Sermanet, S. Reed, D. Anguelov, D. Erhan, V. Vanhoucke, and A. Rabinovich. 2015. “Going Deeper with Convolutions.” Paper presented at the IEEE Conference on Computer Vision and Pattern Recognition (CVPR), Boston, June 7-12.
- Wang, D. C., X. N. Chen, N. B. Guo, H. Yi, and Y. A. Li. 2023. “STCD: Efficient Siamese Transformers-Based Change Detection Method for Remote Sensing Images.” Geo-Spatial Information Science 20. https://doi.org/10.1080/10095020.2022.2157762.
- Wang, C., T. Chen, and A. Plaza. 2023. “MFE-Resnet: A New Extraction Framework for Land Cover Characterization in Mining Areas.” Future Generation Computer Systems-The International Journal of Escience 145: 550–562. https://doi.org/10.1016/j.future.2023.04.001.
- Wang, X., J. H. Du, K. Tan, J. W. Ding, Z. X. Liu, C. Pan, and B. Han. 2022. “A High-Resolution Feature Difference Attention Network for the Application of Building Change Detection.” International Journal of Applied Earth Observation and Geoinformation 112: 15. https://doi.org/10.1016/j.jag.2022.102950.
- Wang, X., K. Tan, P. J. Du, C. Pan, and J. W. Ding. 2022. “A Unified Multiscale Learning Framework for Hyperspectral Image Classification.” IEEE Transactions on Geoscience and Remote Sensing 60: 19. https://doi.org/10.1109/tgrs.2022.3147198.
- Woo, S. H., J. Park, J. Y. Lee, and I. S. Kweon. 2018. “CBAM: Convolutional Block Attention Module.” Paper presented at the 15th European Conference on Computer Vision (ECCV), Munich, September 8-14.
- Xiao, D., L. Y. Yin, and Y. H. Fu. 2022. “Open-Pit Mine Road Extraction from High-Resolution Remote Sensing Images Using RATT-UNet.” IEEE Geoscience and Remote Sensing Letters 19: 5. https://doi.org/10.1109/lgrs.2021.3065148.
- Xie, H. B., Y. Z. Pan, J. H. Luan, X. Yang, and Y. W. Xi. 2021. “Open-Pit Mining Area Segmentation of Remote Sensing Images Based on DUSegNet.” The Journal of the Indian Society of Remote Sensing 49 (6): 1257–1270. https://doi.org/10.1007/s12524-021-01312-x.
- Xu, Y., J. Y. Gong, X. Huang, X. Y. Hu, J. Y. Li, Q. Li, and M. Peng. 2022. “Luojia-HSSR: A High Spatial-Spectral Resolution Remote Sensing Dataset for Land-Cover Classification with a New 3D-HRNet.” Geo-Spatial Information Science 13. https://doi.org/10.1080/10095020.2022.2070555.
- Yang, L., W. Chen, P. S. Bi, H. Z. Tang, F. J. Zhang, and Z. Wang. 2022. “Improving Vegetation Segmentation with Shadow Effects Based on Double Input Networks Using Polarization Images.” Computers and Electronics in Agriculture 199: 12. https://doi.org/10.1016/j.compag.2022.107123.
- Yuan, J. Y., X. Ma, Z. T. Zhang, Q. Xu, G. Han, S. Li, W. Gong, F. Y. Liu, and X. Cai. 2023. “EFFC-Net: Lightweight Fully Convolutional Neural Networks in Remote Sensing Disaster Images.” Geo-Spatial Information Science 12. https://doi.org/10.1080/10095020.2023.2183145.
- Yu, L., Z. R. Du, R. M. Dong, J. P. Zheng, Y. Tu, X. Chen, P. Y. Hao, et al. 2022. “FROM-GLC Plus: Toward Near Real-Time and Multi-Resolution Land Cover Mapping.” GIScience and Remote Sensing 59 (1): 1026–1047. https://doi.org/10.1080/15481603.2022.2096184.
- Zhang, C., I. Sargent, X. Pan, H. P. Li, A. Gardiner, J. Hare, and P. M. Atitinson. 2018. “An Object-Based Convolutional Neural Network (OCNN) for Urban Land Use Classification.” Remote Sensing of Environment 216: 57–70. https://doi.org/10.1016/j.rse.2018.06.034.
- Zhang, C. Y., J. H. Xing, J. Li, S. H. Du, and Q. M. Qin. 2023. “A New Method for the Extraction of Tailing Ponds from Very High-Resolution Remotely Sensed Images: PSVED.” International Journal of Digital Earth 16 (1): 2681–2703. https://doi.org/10.1080/17538947.2023.2234338.
- Zhao, W. Z., S. H. Du, and W. J. Emery. 2017. “Object-Based Convolutional Neural Network for High-Resolution Imagery Classification.” IEEE Journal of Selected Topics in Applied Earth Observations and Remote Sensing 10 (7): 3386–3396. https://doi.org/10.1109/jstars.2017.2680324.
- Zhao, L. R., R. Q. Niu, B. Q. Li, T. Chen, and Y. Y. Wang. 2022. “Application of Improved Instance Segmentation Algorithm Based on VoVnet-V2 in Open-Pit Mines Remote Sensing Pre-Survey.” Remote Sensing 14 (11): 24. https://doi.org/10.3390/rs14112626.
- Zhao, X., P. Wang, C. Chen, T. Jiang, Z. G. Yu, and B. Y. Guo. 2017. “Waterbody Information Extraction from Remote-Sensing Images After Disasters Based on Spectral Information and Characteristic Knowledge.” International Journal of Remote Sensing 38 (5): 1404–1422. https://doi.org/10.1080/01431161.2016.1278284.
- Zhou, G. D., J. H. Xu, W. T. Chen, X. J. Li, J. Li, and L. Z. Wang. 2023. “Deep Feature Enhancement Method for Land Cover with Irregular and Sparse Spatial Distribution Features: A Case Study on Open-Pit Mining.” IEEE Transactions on Geoscience and Remote Sensing 61: 20. https://doi.org/10.1109/tgrs.2023.3241331.
- Zuo, R. X., G. Y. Zhang, R. T. Zhang, and X. P. Jia. 2022. “A Deformable Attention Network for High-Resolution Remote Sensing Images Semantic Segmentation.” IEEE Transactions on Geoscience and Remote Sensing 60: 14. https://doi.org/10.1109/tgrs.2021.3119537.