
ABSTRACT
Starting from a resilience assessment of Harare's water supply, the system interactions of the city’s water management arrangements are explored through a series of causal loop diagrams. These are based on economic, physical, commercial, environmental, and social subsystems and the reinforcing and balancing loops that influence key variables of interest in each are identified. The analysis identifies a series of shortcomings including a weak provider-customer relationship, limited governance capacity, inadequate coordination and integration between key players, shortfalls in physical supply and critical infrastructure, environmental degradation, and a lack of disaster response and recovery measures.
A series of strategies are proposed as intervention actions that target the areas of potential leverage identified in the causal loop analysis, including improving customer-provider relationships; increasing coordination, collaboration, and integration; developing physical and informational infrastructure and enhancing environmental protection and rehabilitation. The impacts of these strategies are highlighted as strengthening key elements of the causal loop diagrams and addressing the resilience gaps identified. The systems mapping approach reveals that key issues are large-scale, cross-sectoral, and compounding. Remediation strategies must therefore also be multi-faceted and holistic in scope.
1. Introduction
Urban water scarcity is a growing systemic risk, particularly in the developing global south, where water supplies face a range of biophysical and socio-economic stressors. Compounding risks include population growth, urbanisation, climate change and ecosystem degradation. Harare, the capital of Zimbabwe, is particularly vulnerable to increasing water scarcity. This is due to a combination of existing shortfalls in water supply and access, high state fragility, growing exposure to water-related risks, and limited capacity to cope with shocks and recover from losses.
Current estimates indicate that the city’s formal treated water supply meets <40% of existing demand (COH Citation2022). The city relies predominantly on surface water resources for its supply. These sources are physically limited and have been experiencing perennially low water levels. Shortages are expected to worsen with increased drought risk from climate change (van Dijk et al. Citation2019).
In addition to quantity issues, the city faces raw water quality issues. Supplies are highly polluted due to the catchment’s topography and poor urban wastewater and pollution management. On the distribution side, there are high levels of real and apparent network water losses, exacerbated by ageing infrastructure, inadequate maintenance, and an intermittent supply (Gauff Ingenieure Citation2014). Additionally, insufficient network coverage and lagging development of critical infrastructure has led to access gaps and inequities. There is also a lack of reliable data which undermines decision-making (COH Citation2022).
Beyond these physical and technical factors, broader conditions of socio-economic and political instability limit governance capacity and constrain operations required for adequate service delivery. These are demonstrated by a revenue collection efficiency of only 45-50% (COH Citation2022), low levels of public trust and high levels of perceived corruption in government (Afrobarometer Citation2021).
The combination of these shortfalls contribute to water scarcity in Harare, worsening the supply-demand balance and undermining the city’s long-term water resilience (IPCC Citation2014). Taking these problems as a starting point, this paper uses a systems thinking approach to address the following questions.
What previous strategies have been employed in Harare to address water scarcity and how do these perform against resilience criteria?
What are the current water supply challenges, their driving factors and the system conditions that inhibit addressing them?
What systematic actions can be taken now, and in the future, to improve water scarcity and resilience outcomes?
The paper is structured as follows. A brief literature review, explanation of methods used and data sources are provided in Sections 2, 3, and 4 respectively. Section 5 applies ARUP’s City Water Resilience Framework to provide a novel assessment of the city’s water resilience. This considers performance in a series of discreet contexts: environmental; physical and informational; political; social and economic and reveals evidence of complex multi-faceted dependencies and shortcomings in Harare’s current water supply system. Section 6 represents this complexity through an overarching Causal Loop Diagram comprising of 5 subsystems based on the evidence from the diverse contexts considered. This allows insights to be made into the system structure, as well as the identification of influential feedback loops and potential areas of leverage. Section 7 discusses four strategies proposed to address the resilience gaps identified in Section 5 (improved customer-provider relationships; stronger co-ordination, collaboration and integration; implementation of physical and informational infrastructure, environmental protection and rehabilitation). The likely impacts of each strategy are traced through the appropriate parts of the causal loop diagram developed in Section 6. Finally a discussion which considers barriers to implementation of the strategies is provided in Section 8 and an overall Conclusion forms Section 9.
2. Literature review
The world’s renewable freshwater resources per capita continue to decline (Ritchie and Roser Citation2017), and nearly half the global population already lives in potential water scarce areas for at least one month per year. This number could increase to 4.8–5.7 billion in 2050 (Burek et al. Citation2016). In 2020, 2 billion people globally lacked safely managed drinking water, of which 771 million were without even basic drinking water (half of which live in sub-Saharan Africa) (UN Citation2021b).
Given its pivotal role, water scarcity has far-reaching impacts. Food and energy production, ecosystems and their services, public health and economic growth, and livelihoods are all adversely impacted by water scarcity (Rijsberman Citation2006). Moreover, competition for water resources destabilises social and political conditions by displacing populations, and elevating the risk of conflict, or ‘water wars’ (Rachman Citation2021).
Water scarcity is driven by a plethora of complex and inter-related biophysical and socio-economic factors. Changing hydroclimatic conditions increase drought and flood risks, affecting physical freshwater availability, whilst changing human activities alter quantities of water withdrawal (Huang, Yuan, and Liu Citation2021). Anthropogenic forces include population growth, urbanisation, per capita income (which correlates with demand), the amount of thermal electricity production and industry, land-use shifts, and technological changes (UNEP Citation2011). Consequently, water availability can be physically limited, but more often the problem lies on the management side. In an increasingly populated, urbanised, and globalised world under a changing climate, future risk conditions are becoming ever more volatile and ambiguous, stressing the resilience of urban water supplies (WEF Citation2022).
Urban Water Management (UWM) involves delivering the following core services: provision of safe drinking water, proper handling of wastewater for urban hygiene, drainage of urban areas for flood protection, and recreational amenities (Larsen and Gujer Citation1997). The methods used in industrialised societies to manage drinking water, wastewater and stormwater have been well established for decades. This prevailing UWM paradigm has been highly successful at addressing urban development and sanitation objectives (Pinkham Citation1999).
In high-income countries operating under this paradigm, urban water scarcity has typically been addressed with extensive infrastructure solutions that focus primarily on supply capacity. Reservoirs are used to store water to avoid shortages during periods of low availability. Other measures include groundwater exploitation, seawater desalination in coastal locations, and inter-basin water transfers in places where local resources cannot meet demand. Despite its successes, this paradigm has several downsides. Its functional and economic effectiveness and future applicability, particularly for rapidly growing cities in the global south, are being questioned (Larsen et al. Citation2016; Leigh and Lee Citation2019).
Conventional UWM approaches require substantial human, energy, and material resources, and involve long infrastructure planning horizons. They rely on stable institutions and large quantities of readily available water. Their resource use is highly inefficient (processes are energy-intensive and there’s considerable wastage of water, organic matter, heat, and nutrients such as phosphorus and nitrogen in wastewater). Significant environmental and social impacts are often also incurred, undermining other Sustainable Development Goals (He et al. Citation2021; Larsen et al. Citation2016; Leigh and Lee Citation2019; McDonald et al. Citation2014). Furthermore, the socio-environmental conditions that enabled the success of this regime have shifted. The water sector faces new threats and opportunities as global changes alter current and future risk conditions. Cities worldwide are facing climate disaster, urban growth, ecosystem degradation and health crises (WEF Citation2022). These compounding effects heighten stress on finite regional freshwater supplies, making the difficult task of UWM ever more challenging (Larsen et al. Citation2016). The conventional UWM approach is ill-equipped to deal with these uncertain, nonequilibrium conditions.
These factors are particularly pertinent in low to middle income countries. Evidently, the menu of water scarcity solutions available to a city, and their potential effectiveness, depend on a context’s geographical and financial limitations, and the specific management issues (water availability, quality or delivery) being faced (McDonald et al. Citation2011; Citation2014). Countries such as Zimbabwe face barriers such as capital shortages, high planning uncertainty, lack of stable energy supplies, spare parts, and operational know-how, and disabling institutional environments (Larsen et al. Citation2016). Many cities face further obstacles such as poverty, population growth, ageing infrastructure, overexploitation of groundwater, and ecosystem degradation. It will be particularly difficult to achieve traditional UWM solutions in these contexts by 2050.
Given the limitations of established UWM approaches, there is an urgent need to develop cost-effective, resource-efficient, low-impact, adaptive systems that can deliver core water services in the face of growing challenges. In this emerging paradigm, addressing urban water scarcity takes on a different tone. Softer, nature-based, localised, multi-faceted, demand-side strategies are given more attention. Beyond this paradigm shift, there’s an increasing need to include resilience thinking into the governance of urban water systems (Krueger et al. Citation2019). As cities globally face volatile and compounded systemic risks, the concept of resilience is gaining traction among urban planners as it offers a way to guide responses to water-related shocks and stresses (Saikia et al. Citation2022). These can be climate related, or systemic. The resilience of water supplies of cities in the developing global south, such as Harare, is particularly vulnerable due to heightened exposure to water-related risks, inadequate coping capacity, and limited ability to recover from shocks and losses (MacAlister and Subramanyam Citation2018)
Here, resilience is understood as a system’s ability to maintain its core functions and integrity in the face of dramatic changes and uncertainties (Saikia et al. Citation2022). Resilience is a ‘context-dependent concept’ (Cariolet, Vuillet, and Diab Citation2019) meaning that it is an emergent property that arises from systemic conditions. It is therefore both a process and an outcome. Building resilience goes beyond reducing and managing disaster risk; it enhances the ability of a system to detect, prepare for, respond to, recover from, and adapt to a range of hazards amidst future uncertainty, in a timely manner (Resilience Shift Citation2017).
The term ‘water resilience’ is relatively new, though it is growing in pertinence alongside the recognition that broader social-ecological resilience is fundamentally dependent on the functions of water (Falkenmark, Wang-Erlandsson, and Rockström Citation2019). ‘Water resilience’ can be defined as the ability of water systems and stakeholders to withstand any water-related shocks and stressors (e.g. floods, droughts, changes in water quality) without ceasing the delivery of key functions, and the ability to adapt to new hydrologic regimes (Rodina Citation2019). Given that the resilience concept has multidisciplinary origins and is open to multiple interpretations, recent work attempts to practically and explicitly apply it to urban water contexts, though the evidence of its application and operationalisation in practice is limited (CWRA Citation2019; Johannessen and Wamsler Citation2017; Lawson et al. Citation2020; Leigh and Lee Citation2019).
Existing research has applied systems thinking, specifically CLDs, to the water sector in various contexts and at different scales (e.g. Madani and Mariño Citation2009; Rehan et al. Citation2011; Zarghami, Gunawan, and Schultmann Citation2018; Sridharan and Irfan Citation2020; Stave Citation2003). The capacity of this tool to integrate disparate physical, socio-economic, and political systems and depict their complex interdependencies makes it highly applicable for managing water, such a pivotal element of life. Additionally, revealing the system structure enables understanding of the implications of proposed interventions for improving water outcomes.
In relation to these evolving concepts and techniques this paper focusses on Harare, a city in the developing global south, and assesses the resilience of its urban water management practices, forming the foundation for a systems analysis of the interactions of the city’s water management arrangements.
3. Methods
The resilience of Harare’s urban water management system is assessed in a number of disparate contexts, through the novel application of ARUP’s City Water Resilience Framework. This reveals a series of complex interactions and dependencies which are represented in a series of causal loop diagrams, highlighting where appropriate system solutions might be considered, and revealing the potential impacts of four proposed systemic interventions.
3.1 City water resilience assessment
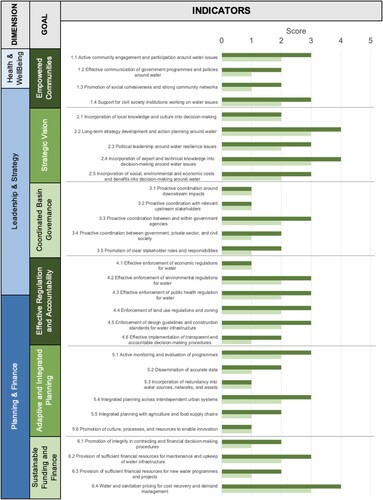
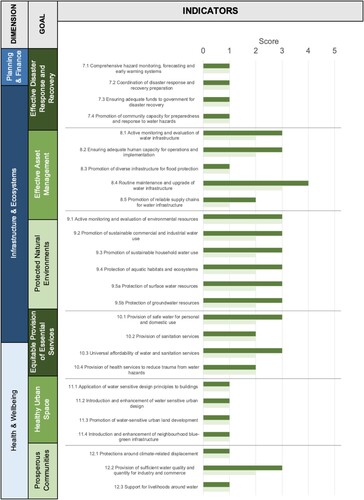
The City Water Resilience Framework (CWRF) is a governance-based resilience planning tool developed by ARUP to assess current water resilience capacity and inform better decisions about water sector investments in a way that builds resilience. It takes a holistic, complex systems view and recognises adaptive governance and its attributes as key drivers for resilience building (Saikia et al. Citation2022). The CWRF consists of 57 indicators distributed between 12 goals and 4 dimensions (see Figure 2).
Harare’s performance was assessed against each indicator, based on the data sources described in Section 4, each of which was assigned two scores between ‘1’ and ‘5’ (). The first score pertained to ‘Intent & Planning’, and the second to ‘Implementation & Outcome’ (), to account for variance between ambition and realisation of that indicator.
Table 1. Scoring scales for CWRF Indicators (Saikia et al. Citation2022).
Table 2. Phases of realisation.
The two different scoring axes are described in .
From Harare’s inception in 1890, the availability of water, how it was acquired, distributed, and used have been shaped by a complex interplay of environmental, technical, political, social, and environmental factors. Therefore, the present-day situation can only genuinely be understood through an appraisal of multiple contexts, summarised in , and reported below against the CWRF indicators, and discussed in Section 5. This analysis underpins the subsequent systems representations of these inter-related issues.
Table 3. System contexts influencing water supply in Harare.
3.2. Development of causal loop diagrams (CLDs)
Causal Loop Diagrams follow a qualitative approach and can assist in developing a better understanding of the main inter-connections in a complex system, highlighting critical feedback loops and connections that may not have otherwise been apparent. They may also lead to a better understanding of system behaviour, without any quantitative model needing to be built, and thereby contribute to breaking entrenched silo thinking. They are able to be applied as a stand-alone system and not necessarily need to be supported by computer simulation in developing subject and solving selected problems (Purwanto et al. Citation2019).
In CLDs, arrows connect pairs of variables, representing causality. The variable at the arrow’s tail impacts the variable at the arrow’s head. When the polarity of the arrow is positive (‘+’), an increase in the tail variable leads to an increase in the head variable, i.e. the variables change in the same direction. When the polarity is negative (‘ – ’), the variables change in opposite directions. If the arrow is cut by a ‘//’, a time delay exists between cause and effect. Combinations of variables can form loops. These can be reinforcing (‘R’) in that they result in exponential growth, or balancing (‘B’) in that they self-regulate toward equilibrium.
The causal loop diagrams presented here were based on the key variables and relationships identified through the City Water Resilience Assessment, and developed through a series of iterations. Whilst the procedure did not follow a full participatory methodology underpinned by a variety of stakeholder groups, it was informed by informal dialogue with representatives of the City of Harare and operators of varying responsibility. The variables chosen were selected by the researchers based on the results of the resilience assessment analysis, and the assembled evidence which underpinned this.
The system boundary was established across the 7 dimensions shown in , reflecting the various contexts described in the preceding section.
Table 4. System components (coloured according to their CLD representation).
Logical reasoning was used to define and select the most appropriate elements in each system category and determine causal relationships. These decisions were made in accordance with the data sources available to ensure the most prominent factors were included and that inter-connections reflected all the current system contexts as accurately as possible.
For the purpose of focussing on water scarcity, the following components were considered exogenous to Harare’s water system:
Climate change impacts: heightened drought and flood risk
Macroeconomic instability of Zimbabwe’s economy
Broader institutional conditions of partisan politics and illegitimate democratic processes
The provision of public health and sanitation services
Trends in population, urbanisation, and industrialisation. These trends are affected by innumerable factors, including the provision of water services, however, given the complexity of these causal connections they are considered only in terms of their contributions to water demand and environmental degradation.
These factors are beyond the control of the water system though their significant effects are worth considering in future iterations of the analysis.
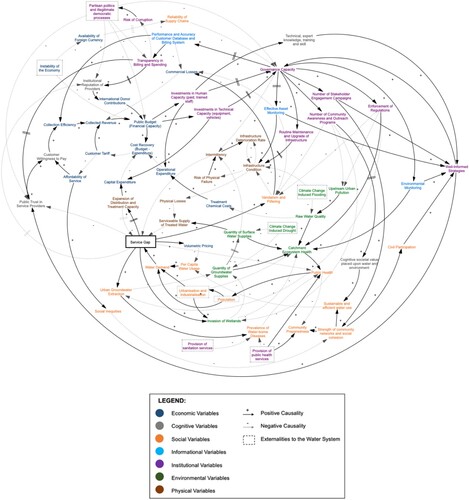
Following the development of the overall causal loop diagram (Figure 4), feedback loops were identified, and analysed to provide insight into the underlying system structure and its resulting behaviours. The analysis revealed different leverage points in the system that could improve water supply management and associated resilience outcomes.
Actions targeting leverage points were articulated, and their system implications traced through the diagram. This analysis yielded a set of recommended actionable steps for the city to take forward to improve water supply, scarcity, and resilience outcomes.
3.3. Strategy development
Having identified places of leverage, a vision for a sustainable and resilient water system in Harare was formulated to guide the development of strategies. Actions targeting leverage areas were articulated, and their system implications traced through the diagram. This analysis yielded a set of recommended actionable steps for the city to take forward to improve water supply, scarcity, and resilience outcomes, and realise the vision (Section 7). The feasibility of implementing these is discussed in Section 8.
4. Data sources
Harare is the capital city of Zimbabwe with a population of 1.5 million inhabitants (according to World Population Review), and is expected to rise to over 2 million by 2035 ().
Figure 1. Greater Harare Spatial Extent (COH Citation2021).
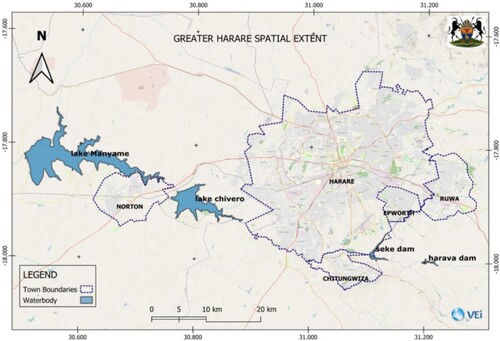
The city sits on one of the higher parts of the Highveld plateau of Zimbabwe at an elevation of 1,483 metres with an average temperature of 18OC, with average annual rainfall about 825 mm in the southwest, rising to 855 mm on the higher land of the northeast. There are three main seasons: a warm, wet summer from November to March/April; a cool, dry winter from May to August; and a warm to hot, dry season in September/October. The Harare City Council is an administrative body responsible for providing clean drinking water, housing and accommodation, refuse collection facilities and health services.
The analysis below draws on a combination of desktop literature (both academic and grey), and information provided directly by the City of Harare. The city provided meteorological data (rainfall, evaporation, and temperature), water quality reports, spatial mapping of the transmission and distribution network, census data, bathymetric and hydrological results, records of production, consumption, billing and cost recovery, and the latest estimates and projections of key metrics such as water demand, supply, non-revenue water percentages, physical and apparent losses, and revenue collection efficiency. They also provided their long-term water management and investment plans. The most detailed of these was developed in 2014 through the combined efforts of the World Bank and beneficiary local authorities (Gauff Ingenieure Citation2014), and much of its content remains relevant today. The most recent draft of the 2050 Climate Resilience Plan for Harare was also provided. It considers current and future climate impacts on Harare’s water resources, and provides outline plans (COH Citation2021).
5. Results of the city water resilience assessment
5.1 Environmental context
(Indicators 3.1, 3.2 )
Figure 2. CWRF Resilience Results for Harare. (Top bar = ‘Intent and planning; Bottom bar = ‘Implementation & Outcomes).
The combination of high elevation, a long dry season, perennial stream flows, and high evaporation rates has historically made water storage in and around Harare costly and challenging. Additionally, the predominance of ancient crystalline rocks and the absence of sedimentary formations in the vicinity results in small aquifer volumes unable to provide sizable groundwater yields. Therefore the centralised reliance on stored surface water in the Seke, Harava, Chivero and Manyame dams has become more entrenched over time (Musemwa Citation2021).
The region also faces water quality and ecosystem health challenges with many drainage paths in Harare having high pollutant loads aggravated by flooding, poor agricultural practices, and improper wastewater, stormwater, and solid waste management.
5.2 Physical and informational context: supply-demand balance
(Indicators 5.1, 5.2, 5.3, 8.1, 8.4, 8.5, 10.1, 12.2 )
Given the region’s rapid urban expansion in recent decades, the council has expanded to provide water services to peripheral areas. However, insufficient development of critical distribution infrastructure has led to access gaps.
5.2.1 Surface water
Surface sources have been experiencing perennial droughts in recent years (HRW Citation2021) with the Prince Edward WTW, fed by the Seke and Harava Dams, only operating from December to ∼August due to seasonal low water availability, and is mostly used to meet peak demand. The Morton Jaffray WTW is fed predominantly by Chivero, but also by Manyame but does not function at full capacity due to operational constraints. Because of these inefficiencies, the actual total output of the treatment plants is currently estimated at less than 60% of their capacity (COH Citation2022).
New dam schemes, either currently under construction or being planned will hypothetically offset the growing demand, however the enormous capital investment required poses a significant barrier, as exemplified by the delay in completing the Kunzvi dam. Given these supply shortfalls, a non-intermittent formal supply cannot be expected in the foreseeable medium to long-term future.
The current water supply network is highly centralised, homogenous, and relies on few critical sources with a need for more localised reservoirs. In addition, neighbouring satellite municipalities are increasingly reliant on purchasing treated water from the same sources thereby creating dependency and increasing vulnerability.
5.2.2 Groundwater
The majority of Harare has only moderate groundwater potential (Misi, Gumindoga, and Hoko Citation2018), but in response to the unreliable municipal water supply, there has been a recent proliferation of groundwater extraction. Private boreholes in low-density areas, and shallow, open wells and community boreholes in high-density areas offer short term relief. Recent research using GRACE satellite data shows a quick decline in groundwater levels over the last decade (van Dijk et al. Citation2019).
5.2.3 Network losses
Harare experiences excessive losses of treated water across its supply chain. These losses include water lost through leaks, overflows and during treatment (real/physical losses), and water which is not properly measured, accounted for, or paid for (apparent/commercial losses).
Real losses are exacerbated by ageing infrastructure. Moreover, maintenance, rehabilitation and upgrading works have been sparse for decades due to the council’s enduring struggle to meet its operating costs. Supply intermittency further burdens the decrepit infrastructure by creating drastic pressure changes. Shortages of foreign currency make importing equipment, parts, and treatment chemicals difficult, threatening reliability of supplier relationships, and contributing to the sporadic operation and upkeep of the system
5.2.4 Commercial losses
Commercial losses arise from an incomplete customer database, illegal connections and pilfering, billing errors, and dysfunctional meters that either don’t work or report inaccurate figures.
The introduction of a GIS Based Network Information system (for asset management, demand management, accounting and payroll, and customer support services) is only being implemented very slowly and creates ongoing operational issues. Consequently, data uncertainty and unreliability undermine sensible decision-making.
5.3 Political context: Harare’s water governance
(Indicators 2.1, 2.2, 2.3, 2.4, 2.5, 3.3, 4.2, 4.3, 4.4, 4.5, 4.6, 5.4, 5.5, 5.6, 7.1, 7.2, 7.3, 7.4, 8.2,8.3, 9.1, 9.4, 9.5a, 9.5 b. 11.1, 11.2, 11.3, 11.4,12.1, 12.3 )
Harare has a contentious and complex history of water politics and whilst climatic and technical factors may have contributed to current water scarcity, anthropogenic factors have undoubtedly dominated (Musemwa Citation2021). Water rights have historically been allocated along racial, territorial, and income lines. The spatial planning of Harare’s water supply networks still reflects these segregationist, inequal race and class relations today (Musemwa Citation2021). In 1976 all water use was brought under centralised control and in 1998 water became treated as an economic good under the user pays and polluter pays principle and led to the creation of the state water corporation, the Zimbabwe National Water Authority (ZINWA) to manage water resources at the national level and control the commercial functions of water services. Catchment Councils (CCs) and Sub-Catchment Councils (SCCs) were established to manage water locally. Their range of functions and responsibilities include stakeholder-informed planning, permitting, supervision and regulation, catchment protection, data gathering, and revenue collection (AFDB Citation2010).
5.3.1 Water politics: tensions between state and local governments
Political tensions between the state and local levels continue to undermine water provision, and it is the poorest and most vulnerable of the urban populous who bear the burden (Mataishe Citation2022) as policy intentions are marred by partisan agendas (COH Citation2020; Madzimure Citation2022). These partisan politics undercut vertical coordination between state and local levels.
5.3.2 Governance issues: Intra – and inter-agency coordination and enforcement of regulations
Harare’s water governance shortcomings include a lack of transparency and accountability, unclear job titles, descriptions, and responsibilities, as well as overlaps, gaps, and vacancies in work, especially at the lower levels, leading to micromanagement and overburdened employees. Decision-making processes involve multiple administrative levels, with cumbersome reporting lines creating inefficiencies (Gauff Ingenieure Citation2014).
Communication channels and institutional linkages between sectors such as energy, transport, agriculture, and environment are weak, and agencies operate in siloes. Where decision-making does involve multiple government departments, delays often result, especially if opinions are not unanimous (Gauff Ingenieure Citation2014). Separation of responsibility for water quantity (through ZINWA) and water quality (through EMA – Environmental Management Agency) creates an enforcement coordination issue, as the sanctioning of deviators gets transferred to the other government body and so often does not occur.
5.3.3 Long-term strategic planning
Current plans seek to first stabilise the situation and get the most out of existing assets, then to increase water production and reduce non-revenue water (NRW), and finally to expand facilities to accommodate increasing demand (Gauff Ingenieure Citation2014). This sequence has been slower to realise than planned, and many aspects remain wholly unaddressed.
Support has been provided by NGOs and international bodies, e.g. in terms of hydrological and hydraulic modelling (van Dijk et al. Citation2019). However, there remain shortfalls in engineers and employees with necessary literacy, skills, training, and technical knowledge. The plans are operationally focused and there is minimal inclusion of local knowledge and cultural values. There is no capacity left to develop measures that would improve responses to future hazards.
5.4 Social context: attitudes, inequities, preparedness and collaboration
(Indicators 1.1, 1.2, 1.3, 1.4, 3.4, 3.5, 9.2, 9.3, 10.4, 10.3 )
5.4.1 Public attitudes
Stakeholder engagement in practice is limited. Residents in Harare demonstrate low levels of trust and report significant levels of perceived corruption (Afrobarometer Citation2021). Comprehensive communication and dissemination of government programs and policies to all stakeholders is lacking and little efforts have been made by urban councils to foster social network strength and build trust. This erodes customer relations and reduces willingness to pay bills, thereby limiting revenue collection and further undermining service provision.
Feedback from recent resident consultations has included concerns over rehabilitation of critical assets, estimation of meter readings and accusations of arbitrary billing, insufficient reporting of customer usage by area, lack of transparency in revenue and expenditure for wards, drains clogged due to poor refuse collection, inadequate preservation of wetlands, poor employee conduct, rates established on unofficial guesses of inflation forecasts, no engagement upon bill increases, lack of regular engagement between the residents and authorities, no constant potable supply and the desire for prepaid meters and an e-platform to publish queries (COH Citation2022b).
5.4.2 Social inequities
Colonial legacies of resource inequity remain deeply entrenched among Harare’s residents. Swimming pools and expansive green lawns are plentiful in low-density areas, while water scarcity, unhygienic communal latrines and rudimentary boreholes abound in high-density areas. This proximity of communal boreholes and sewerage tanks aggravates public health risks, as demonstrated by rampant, repeated cholera outbreaks (Dzirutwe Citation2018). Under water scarce conditions, those with financial resources can afford to drill ever deeper, expensive boreholes, however the urban poor are forced to make ends meet in other ways. Women and children are disproportionately impacted, having to search for limited water rations and queue for hours. The postcolonial government has not altered these inherited inequitable patterns of urban water distribution and use (Musemwa Citation2021). In addition, over the past five years, access to good sanitation services has been worsening (Afrobarometer Citation2021).
5.4.3 Collaboration with private sector and civil service
The 2013 National Water Policy (NWP) states explicitly that the private sector and civil society have important roles to play in the water sector but the degree to which there is support, engagement and collaboration is limited in both planning and execution (Gauff Ingenieure Citation2014). Civil partnerships do exist between the council, the UN bodies and VEI, the Dutch Water Operators, especially on the technical research and planning fronts. Public-private partnerships have been attempted (Chidakwa Citation2021), however concerns have been expressed that contracts were drafted to benefit certain individuals over others.
5.5 Economic context: challenges financing water
(Indicators 4.1, 6.1, 6.2, 6.3, 6.4, 10.2 )
Zimbabwe’s economy has suffered from macroeconomic decline and instability since the early 2000s. There remains a hybrid economy plagued by a shortage of cash and foreign currency, black market trading, and fluctuating bank exchange rates (Reuters Citation2022). There has also been cessations of financial contributions from international donors, and inflictions of a wide range of sanctions on allegations of economic mismanagement and democratic misconduct (Ndakaripa Citation2021).
This unstable political and economic climate has been dramatically damaging for the water sector. Today’s turbulent exchange rate and cash shortages make it challenging to set fair tariffs and collect consistent revenue.
5.5.1 Financing water
In the current water system, funding comes from two sources: 1) state devolution funds, i.e. taxpayers’ money; 2) rates collected by local authorities. The state-level budgeting processes are opaque to local municipalities. However, at the local level, rates collected for water, works and health are collectively pooled and distributed. Therefore, funds collected for water do not necessarily get spent on water-related issues. The public have explicitly expressed concerns about a lack of transparency in spending at the council level (COH Citation2022b).
As per the NWP mandate, tariff bands have been introduced according to volumetric consumption and geographic location. Less affluent high-density areas are billed below production cost whilst more affluent low-density areas are billed above. The intention is to redistribute wealth and set tariffs purely for cost recovery to enable water provision as a constitutional right. Users are having to pay higher rates to cover operator inefficiencies, and social tensions may arise between different groups charged different rates.
There are also gaps in the customer database and issues with the billing system. These undermine operator legitimacy in the customer eye, reducing willingness to pay.
5.6 Cumulative resilience assessment
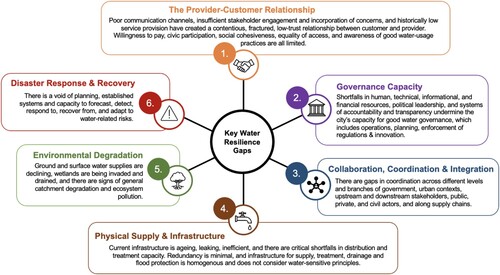
Based on the evidence summarised above the results of the resilience assessment are shown in , using the scoring scale defined in . These results reveal several deficient areas that undermine Harare’s water resilience and contribute to the problem of water scarcity. A description of the key water resilience gaps in Harare is summarised in . The challenges being faced in Harare are multi-faceted and complex, spanning a number of system dimensions.
Figure 3. Key water resilience gaps in Harare.
6. System analysis using causal loop diagrams
Systems thinking provides the ability to integrate disparate physical, socio-economic, and political systems and depict their complex interdependencies making it highly applicable for water planning in cities such as Harare. By revealing the underlying system structure, a system analysis enables an understanding of the implications of proposed interventions for improving water outcomes in complex contexts.
5 subsystems are extracted from which relate to economic factors, commercial losses, physical infrastructure, environmental factor and social factors. These are analysed in turn below.
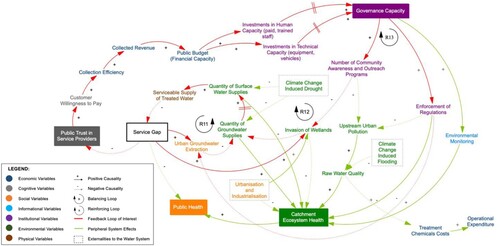
Figure 4. CLD Representing Harare’s Current Water Supply System.
6.1 Subsystem 1: economic factors ()
6.1.1. Key variable: public budget
Two competing feedback loops operate simultaneously to affect the budget’s size:
B1: The current system exhibits a low willingness to pay, low collection efficiency and high commercial losses, all of which limit the collected revenue. These factors, coupled with broader economic instability, political illegitimacy, and reduced donor contributions, limit the budget size. To cover costs, customer tariffs are raised to increase the revenue, creating a balancing loop.
R1: However, if tariffs are raised, this makes the service less affordable, which reduces the customer’s willingness to pay, ultimately reducing the collection efficiency and therefore the revenue, creating a negative reinforcing loop.
Figure 5. Subsystem focusing on Economic Factors.
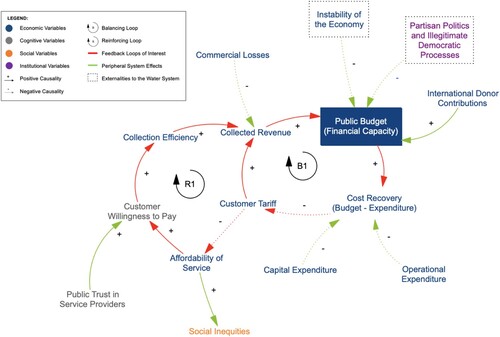
Crucially, as the service becomes less affordable, social inequities worsen because those who can pay to get off the system through independent means (e.g. by drilling private boreholes) do so. Those who cannot pay end up covering the costs of those who cannot afford the water, as well as the cost of the operator’s inefficiencies.
It is important to note that increased tariffs do not necessarily reduce consumption (and therefore revenue) because in Harare, billing is done in bands, not on exact metered consumption. Most people fall within the standard household consumption band. The only way that increased tariffs will reduce consumption is if significant numbers of people switch to relying on boreholes instead of the municipal water supply. However, as greater numbers of people abstract from the moderate groundwater reserves, more boreholes go dry, meaning that even the alternative form of supply is not secure.
6.1.2 System effects
A central factor that dictates which of the two identified feedback loops dominates in affecting the key budget variable is public trust. When there is a strong provider-customer relationship, there will be a greater willingness to accept a fee increase. Therefore, with an increase in tariffs, though the affordability of the service will decrease, the willingness to pay may not. Consequently, collection efficiency may not decrease, and revenues will increase, so the loop B1 dominates for a while. However, if service levels do not improve for long periods despite higher tariffs, trust will decline and R1 will dominate instead.
6.1.3 Key areas of leverage
Increasing public trust and reducing commercial losses are key areas for increasing financial capacity. These minimise the need for a permanent fee hike that deepens social inequalities
6.2 Subsystem 2: commercial losses (CLs) ()
6.2.1 Key variables: commercial losses (CLs) component of NRW
Three reinforcing loops affect CLs, and connects the budget with governance capacity via one of three routes:
Figure 6. Subsystem focusing on Commercial Losses
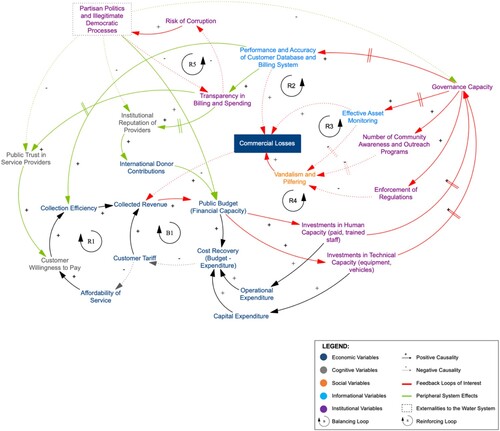
R2: Customer Database and Billing
Without a complete customer database and an accurate, reliable billing system, CLs are high. People on the system who don’t pay, and people not on the system who use water, are not accounted for. Moreover, bills are inaccurate and don’t always correlate with actual water consumption. Overestimations reduce willingness to pay and public trust, and underestimations reduce revenue collected. Either way, revenue is constrained, and governance capacity stunted.
R3: Asset Monitoring
Without functional asset monitoring systems (working metres reporting accurate flow and consumption readings), there’s limited spatial data on faults, inefficiencies, and pilfering. Decision-making is therefore uninformed, and CLs worsen.
R4: Vandalism and Pilfering
Vandalism of water infrastructure for tapping purposes worsens CLs, because treated water is not paid for. This can be reduced by increasing community awareness around proper infrastructure care, greater enforcement of regulations, and improved asset monitoring.
6.2.2 System effects
There are also several compounding peripheral outcomes associated with these loops. Without accurate billing and customer data, not only is the collection efficiency directly impacted, but so is the municipality’s ability to demonstrate financial integrity and transparency. Therefore, public trust and the institution’s international reputability are undermined, and donor support is unlikely, reducing revenue even further. Moreover, opaque management of finances heightens corruption risk, thereby contributing to the prevalence of undemocratic political processes across levels of government. As this culture becomes more established, trying to instil transparency becomes even harder (negative reinforcing loop R5). Governance capacity, public trust and institutional reputation suffer further.
6.2.3 Key areas of leverage
Improving the functionality and performance of the customer database and billing systems, and asset monitoring, as well as the reduction of pilfering through enforcement of regulations and community awareness programs are key areas. These will change R2, R3 and R4 from negatively reinforcing to positively reinforcing, reducing CLs, boosting revenue, and enabling continued growth in governance capacity.
6.3 Subsystem 3: physical infrastructure & losses ()
6.3.1 Key variables: service gap (shortfalls in access and supply), infrastructure condition, intermittency, physical losses, and governance capacity
There are five negative reinforcing loops (R6-R10), and one balancing loop (B2) in this subsystem focused on physical factors.
Figure 7. Subsystem focusing on Physical Infrastructure and Losses.
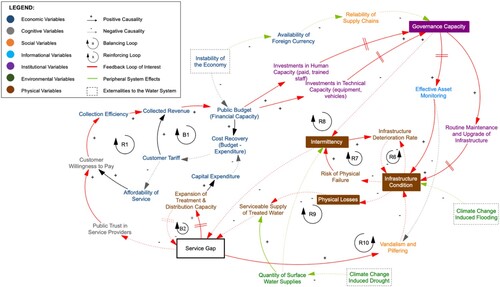
R6: Infrastructure Deterioration
As infrastructure conditions worsen, the rate of deterioration increases, creating a worsening spiral.
R7: Physical Failures
Current infrastructure condition is poor, which leads to a higher risk of physical failure. This increases the supply intermittency, which increases deterioration rate due to continual pressure changes, further worsening the condition (negative reinforcing loop).
R8: Intermittency
Low governance capacity and poor infrastructure conditions prevent treatment plants from operating at maximum efficiency, leading to intermittency in supply. This is aggravated by the peripheral effects of limited surface water supplies (worsened by climate-change induced drought), and broader economic instability contributing to shortages of foreign currency and disrupting supply chains. Intermittency contributes to the service gap, undermining public perception of the service provider, reducing willingness to pay, revenue and governance capacity, creating a negative reinforcing loop.
R9: Physical Losses
With poor infrastructure condition, there are high physical losses resulting in lower volumes of serviceable water, thereby directly contributing to the service gap. Without sufficient governance capacity to monitor assets and conduct routine maintenance and upgrading of infrastructure, R9 becomes a negative reinforcing loop.
R10: Vandalism and Pilfering
As the service gap widens, residents are forced to obtain water by other means, increasing the incentive to vandalise and pilfer from the network. This is detrimental to the infrastructure condition, further contributing to the service gap, thereby creating a worsening spiral.
B2: Infrastructure Expansion
The service gap drives expansion of treatment and distribution capacity, which balances the gap over time. However, expansion has lagged due to limited governance capacity, not keeping up with growing demand.
6.3.2 Key areas of leverage
Improving infrastructure condition, addressing physical losses, limiting intermittency, and expanding treatment and distribution capacity, are all very challenging as they are undercut by multiple negative reinforcing loops and exogenous factors, however these are key areas for closing the service gap. Building governance capacity by other means first will be vital.
6.4 Subsystem 4: environmental factors ()
6.4.1 Key variables: service gap, public health, catchment ecosystem health, public trust in service providers, and governance capacity
There are 3 key reinforcing loops in this subsystem focusing on environmental factors:
Figure 8. Subsystem focusing on Environmental Factors.
R11 and R12: Urban Groundwater Extraction and Wetland Invasion
The current service gap is driving excessive groundwater extraction and wetland drainage. This reduces groundwater supplies, and over time surface water supplies too, given their hydrological interconnectedness. These factors not only reduce supply levels for formal treated supply, but are detrimental to ecosystem health, and public health. The service gap is also directly detrimental to public health. Supply reductions will be exacerbated by droughts, and urbanisation and industrialisation trends will further damage ecosystem health. This is a doubly negative reinforcing loop involving different activities (i.e. groundwater extraction and wetland drainage), with further detrimental system spin-off effects.
In addition to groundwater factors, there are high levels of urban pollution, worsened by climate change-induced flooding. Given the catchment topography, raw water quality suffers, adversely impacting on ecosystem (and public) health.
R13: Community Outreach and Awareness
Though there are few stakeholder engagement initiatives currently underway, none focus on building awareness around the impacts of polluting behaviours, the importance of wetlands, and the problems associated with groundwater over-abstraction. Regulations are in place to limit borehole drilling; however, they are not adequately enforced. Moreover, environmental monitoring of only a small range of variables is conducted sporadically by EMA. These measures will be key in changing R11 and R12 from negatively to positively reinforcing feedback loops. Beneficial system spin-offs would include ecosystem and public health, as well as reduced treatment chemical costs.
6.4.2 Key areas of leverage
Addressing the gaps in enforcement, environmental monitoring, public awareness, as well as improving coordination with upstream stakeholders and between governance bodies will be important for improving ecosystem and public health.
6.5 Subsystem 5: social factors ()
6.5.1 Key variables: service gap, public budget, governance capacity, cognitive societal value placed on water and environment, sustainable and efficient water use, and community preparedness
There is one balancing loop (B3) and two negative reinforcing loops (R14 and R15) of relevance in this subsystem focused on social factors.
Figure 9. Subsystem focusing on Social Factors.
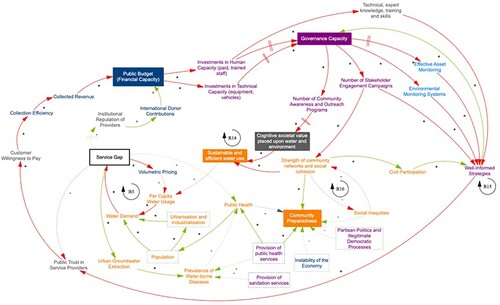
B3: Demand Management via Volumetric Pricing
Water demand increases with population growth, industrialisation, and urbanisation, widening the service gap. To address this, volumetric pricing was introduced to reduce per capita usage and manage demand.
R14: Demand Management via Changes in Water Use
Cognitive value placed on water and the environment, and public awareness around conservative water use is currently limited, so these do not constrain per capita usage and overall water demand. Moreover, low levels of social cohesion inhibit transmission of good practices. The lack of social cohesion also aggravates inequities in an ever-worsening loop (R16) and reduces civil participation in engagement programs to inform strategies. Overall, these factors undermine community preparedness.
R15: Strategies
Strong long-term strategies require data about the system performance (through asset and environmental monitoring), technical knowledge, understanding of stakeholder needs, local culture, and traditional knowledge (through engagement and civil participation). All of these are present to some degree in the system but require improvement. Good planning would in turn boost governance capacity, and if executed, boost public trust in service providers, creating a positive reinforcing loop.
6.5.2 System effects
As described in Section 3, the service gap has driven groundwater extraction. This has led to a proliferation of communal boreholes in high-density areas close to wastewater sources, thereby increasing the prevalence of water-borne diseases. These undermine public health and community preparedness further. Broader exogenous political and economic conditions, and poor public health and sanitation services also destabilise communities. As the service gap worsens, the government’s reputation regresses, limiting international financial assistance.
6.5.3 Key areas of leverage
Programs that aim to raise community awareness around water use and build stakeholder relations and social cohesion will be essential for managing demand. Moreover, coordination with public health and sanitation sectors will bolster community preparedness. Strong strategies will both require and expand governance capacity.
6.6 Overview
Harare’s current water system structure exhibits multiple negative reinforcing loops that undermine its resilience. Problems are cross-sectoral and compound each other. Strategies will need to be multi-faceted and simultaneously target multiple areas of leverage to effectively alter the system’s structure, and therefore, its behaviour.
7. Strategy development
Four strategies have been developed to address the resilience gaps identified in the CWRF assessment of Harare and target the areas of leverage identified in the causal loop analysis. These strategies have been developed within the broader context of the UWM paradigm shift towards water sensitive cities and are summarised in . Each strategy proposes a set of intervention actions with their immediate and significant impacts highlighted in , , and below. These strategies are not mutually exclusive addressing critical systemic issues and are deeply intertwined and synergetic.
Figure 10. Summary of strategy recommendations.
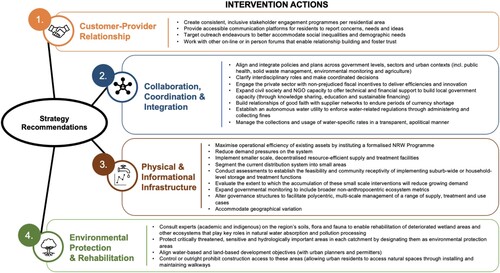
Figure 11. CLD showing System Impacts of Strategy 1: Customer-Provider Relationship.
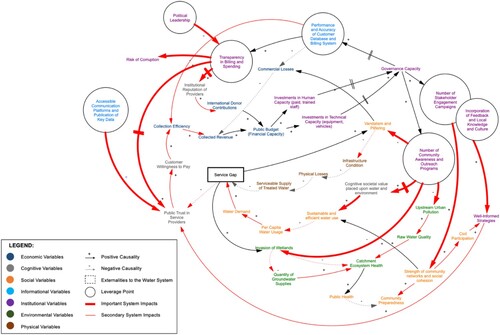
Figure 12. CLD showing system impacts of Strategy 2: Coordination, Collaboration, & Integration.
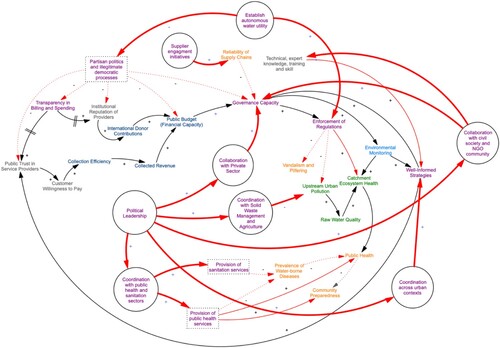
Figure 13. CLD showing system impacts of Strategy 3: Physical & Informational Infrastructure.
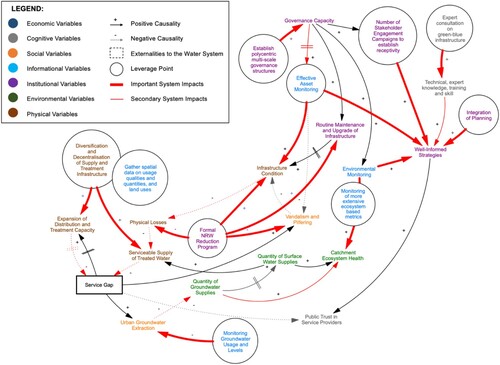
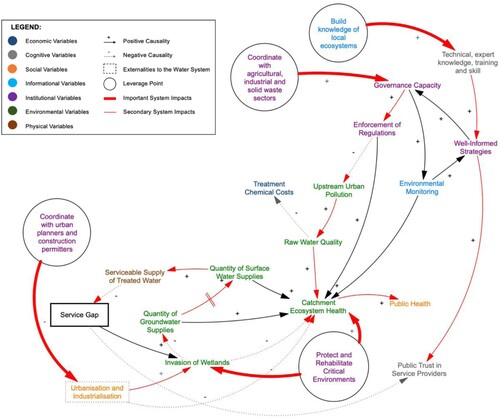
Figure 14. CLD Showing the system impacts of Strategy 4: Environmental Protection & Rehabilitation.
Further strategies focussing for example on political reform could also be developed and the cost-effectiveness of each strategy compared. However the purpose here is to demonstrate how a systems understanding can identify the need for change across several contexts, hitherto viewed independently, and to reveal the system wide impacts such possible strategies these create.
7.1 Strategy 1: customer-provider relationship
To improve the currently fragmented customer-provider relationship, it will be important to build trust and facilitate mutual learning processes which will contribute to new forms of knowledge creation, assist innovation, and enable adaption away from institutionalised, hierarchical approaches. The produced knowledge, and other pertinent local cultural values must be genuinely incorporated into council planning and activities where appropriate, and the nature of these inclusions communicated to contributing parties.
To foster customer willingness to pay and accept fee hikes, budget transparency is needed. This can be achieved through honest, clear reporting to residents of how collected rates are being spent. Moreover, given that the water bill is the primary communication device between provider and customer, they must be accurately based on demonstrable meter readings. This culture of transparency must also penetrate across levels of government, to reduce corruption risk and demonstrate financial integrity to donors. Political leadership will be essential to drive this.
Another key trust-building initiative will be to establish communication channels and spatial water rotas around service cuts. This will enable residents to plan their water-use according to intermittency. When service cuts inevitably occur, consistent and candid explanations to residents of the situation, outlining the remedial activities being undertaken, will minimise public perception of incompetence.
Social awareness programs are another key change lever. These must provide practical ways to conserve water use (to manage demand) and educate the public on the importance of wetlands and the impacts of polluting behaviours and vandalism. It will be important to communicate the whole picture to customers, enabling visibility of the connections between their actions and the probability that water flows from their taps. Ideally, this will create a sense of communal ownership and participation in the system and change the way that water is conceived of, valued, and used. The language of these communications must be accessible to the typical citizen. For example, when explaining how much water is lost from a leaky tap over a period, visual aids such as water tanks will be more effective than volumetric figures.
The primary aim of these activities is to ‘go beyond the dollar’. Improving collection efficiency is vital for the service provider to become financially self-sufficient and for governance capacity to expand. However, this can only occur if the appropriate relational architecture of trust is constructed that affirms the dignity and legitimacy of all who hold a stake in the water system.
The key beneficial system impacts communicated in above include greater ecosystem health, social cohesion, and community preparedness. Conservative water usage will reduce demand, closing the service gap, and infrastructure condition will improve. Lower corruption risks and commercial losses, an improved institutional reputation, greater public trust, and higher willingness to pay will all boost government financial capacity.
7.2 Strategy 2: coordination, collaboration, & integration
A strong network of trusting, functional relationships including both government and non-government actors will be essential for improving water scarcity and resilience outcomes in Harare. The intervention actions summarised in will require the cultural willingness to transform entrenched structures and genuinely consider conflicting opinions with the intent of finding common ground.
The key beneficial system impacts depicted in include expanded governance capacity through financial, technical, and interdisciplinary knowledge inputs, as well as reduced political interference, greater enforcement of regulations, improved ecosystem and public health, and better-informed, more integrated strategies.
7.3 Strategy 3: physical & informational infrastructure
This involves maximising the operational efficiency of existing assets by instituting a formalised NRW Reduction Program before any expansion, informed by sound asset monitoring data, such as mapping the contributors to losses over time and space (NB Harare has been trying to reduce NRW since 2014 and minimal progress has been made) (Gauff Ingenieure Citation2014).
Smaller-scale, decentralised, resource-efficient, supply and treatment facilities should be implemented with the current distribution segmented into smaller areas and assessments conducted to establish the feasibility and community receptivity of implementing suburb-wide or household-level storage and treatment functions.
Key beneficial system impacts identified in include improved infrastructure condition, ecosystem health, expanded informational capacity and system knowledge, and a lessening of the service gap through diversification and decentralisation of supply and treatment infrastructure.
7.4 Strategy 4: environmental protection & rehabilitation
The recommendations in will require consultation with experts (academic and indigenous) on the region’s soils, flora, and fauna to enable rehabilitation of deteriorated wetland areas and other ecosystems that play key roles in natural water absorption and pollution processing. Water-based and land-based development objectives should be aligned through urban planners and permitters. This may result in controlled or outright prohibited construction access to sensitive areas (allowing urban residents access to natural spaces through installing and maintaining walkways).
Protected spaces would increase public wellbeing and ecosystem health, and the city’s recreational amenity value. Furthermore, the primary threats to water quality and catchment degradation, and their origination in solid waste, agricultural and industrial practices, must be better understood. It will be essential to work with players in these sectors to boost governance capacity and regulate detrimental releases into the environment.
The key beneficial system impacts in above include reduced wetland invasions, pollution, and uncontrolled urbanisation and industrialisation, leading to improved catchment ecosystem health and public health whilst achieving an increase in serviceable water supply, reduced treatment costs, increased public trust and governance capacity.
8. Discussion: barriers to implementation
8.1 Resource constraints
Many of the recommendations presented here are not new. Harare’s municipalities are largely aware of what needs to be done but resource constraints and instabilities make execution very challenging. Capital shortages, such as funding, manpower, and materials, technical and operational know-how, political leadership, institutional fragmentation, and public trust, all perpetually undercut efforts to improve the situation.
8.2 Shifting mindsets
Different forms of knowledge, new language, tools and frameworks, alternative ways of approaching problems, novel processes of response, and radical ways of organising society are called for. However past decisions create path dependency and lock-in, limiting the choices available today.
Suggesting the instillation of an institutional culture of transparency and the creation of an autonomous regulator in a government accustomed to opacity, will involve drastic upheavals of the status quos. Shifts in established organisational structures will be necessary. Socially, suggesting changing the way that the public views and values water and the natural environment will be challenging given that much of the population lives under the poverty line and is more concerned with pressing, survival-based needs.
8.3 Challenges of coordination and relationship-building
The growing need for systemic solutions places an emphasis on coordination and integration, as per Strategy 2. However, as more stakeholders are engaged and more views are accommodated, building consensus becomes more difficult. Decision-making becomes cumbersome, time-consuming, and often the more conservative route that meets majority interests is chosen. This poses barriers to efficiency and the adoption of novel approaches, which are greatly needed in Harare. Moreover, Harare’s poor service provision track record and weak institutional reputation will require time and consistent effort to mend. Finally, adjusting the water system to accommodate a range of functions, scales, and contexts, as suggested in Strategy 3, will require highly complex, flexible organisational structures. These changes are intimidating and will face inertia because they fundamentally involve a redistribution of power. This is a radical shift from the hierarchical, centralised, rigid forms of governance that have dominated in Harare.
8.4 Uncertain futures
The extent of climate change (drought and floods) and socio-economic development (population growth and industrialisation) that Harare will be dealing with in decades to come are unknown. Therefore, adaptive, ‘no regret’ approaches that can be adjusted under variable future conditions are needed. However, navigating the trade-off between holding off for fear of locking onto a particular development pathway, versus doing nothing and watching the situation worsen, can lead to decision-making paralysis. Here lies another difficult but greatly required mindset shift toward viewing uncertainty and change as opportunity, embracing (to a reasonable degree) the financial and social risks of new approaches, and adopting a willingness to fail and learn.
The CLD approach taken here is an improvement from traditional, linear engineering approaches in that it considers a wider range of system elements and their interactions, important for sustainability. However, it has its limitations. Firstly, it is difficult to reliably draw inferences from complex causal maps without simulation. Additionally, the focus on feedback loops detracts from the accumulation/degradation of capital stocks, and sustainability is about the cumulative stocks available to coming generations. Other drawbacks pertain to causality and category. In a complex system, isolating non-compounded causalities between pairs of variables relies on numerous assumptions subject to the researcher’s biases. Moreover, categorising variables into different system dimensions, as done in this method, is problematic because dimensions are not only deeply connected, but mutually constitutive. Representing components as spatially distinct, bounded elements connected by arrows is a crude reduction of reality. More complex tools and visual aids that fully recognise the fundamental indivisibility of complex systems may be needed. However, as with all model building, the key lies in choosing the appropriate degree of approximation such that the map retains its utility but is not mistaken as the territory itself.
9. Conclusions
Harare faces several key resilience gaps in its ability to provide essential water services. These include a weak provider-customer relationship, limited governance capacity, inadequate coordination and integration between key players, shortfalls in physical supply and critical infrastructure, and environmental degradation.
The systems analysis presented above yields five key implications for Harare.
A Systems Approach: Active consideration of system impacts beyond technical and economic factors, and conscious integration of policies, plans and activities across sectors are vital.
Relationship-Building between Water Stakeholders: Not discounting the necessity of developing appropriate hard solutions (infrastructure and technology), their effectiveness will be limited without the presence of favourable relational architectures of trust (soft solutions). Building a network that better connects residents, providers, different sectors of government, the private sector, civil society, local and international experts, and people with nature, is a key driver of sustainable change.
Shifts in Knowledge Flows and Mindsets: The processes involved in creating, legitimising, assessing, distributing, and using knowledge fundamentally influence individual and collective conceptions of value and health, particularly around water and the environment. Altering this cognitive architecture underlying systemic behaviour is a powerful area of leverage.
Reorganisation of Power Structures: Shifting the flow of power, away from hierarchical, centralised arrangements where financial and material resources are concentrated among a small elite group, toward more decentralised, complex, distributed arrangements that facilitate local participation will better serve water outcomes.
Adaptivity and Flexibility: The future is inherently uncertain, so consciously building adaptive cultures of learning will be crucial for making choices today that do not constrain prospective responses.
The systems approach has revealed that these issues are large-scale, cross-sectoral, and compounding. Remediation strategies must therefore also be multi-faceted and holistic in scope.
The strategy development process identified several factors often overlooked in favour of large, centralised, capital-intensive, techno-bureaucratic approaches. These factors recognise the necessity of adopting a broader, integrative systems thinking approach, the power of building relationships of trust and dignity between stakeholders, the significance of shifting underlying mindsets, the influence of altering knowledge flows and reorganising power structures, and the importance of adaptivity and flexibility in decision-making. However, there are significant barriers to the implementation of these concepts in the context of Zimbabwe. These include resource constraints, entrenched political and economic instability, the inherent inertia of attitude change, the natural challenges of consensus-building and stakeholder coordination, and the difficulties of planning for an uncertain future.
Disclosure statement
No potential conflict of interest was reported by the author(s).
References
- AFDB. 2010. “Water Resource Management, Supply and Sanitation.” Zimbabwe Report. African Development Bank. https://www.afdb.org/fileadmin/uploads/afdb/Documents/Generic-Documents/9.%20Zimbabwe%20Report_Chapter%207.pdf.
- Afrobarometer. 2021. “Afrobarometer SDG Scorecard for Zimbabwe”. https://www.afrobarometer.org/wp-content/uploads/2022/02/zimbabwe_sdg_scorecard_2021-afrobarometer-8july21.pdf.
- Burek, P., et al. 2016. “Water Futures and Solution - Fast Track Initiative (Final Report)”. http://pure.iiasa.ac.at/id/eprint/13008/.
- Cariolet, J.-M., M. Vuillet, and Y. Diab. 2019. “Mapping Urban Resilience to Disasters – A Review.” Sustainable Cities and Society 51: 101746. https://doi.org/10.1016/j.scs.2019.101746.
- Chidakwa, B. 2021. “City of Harare to temporarily close Roadport”, The Herald, 8 December. https://www.herald.co.zw/city-of-harare-to-temporarily-close-roadport/.
- Chingono, N. 2021. “Half of Zimbabweans fell into extreme poverty during Covid”, The Guardian, 21 June. https://www.theguardian.com/global-development/2021/jun/21/half-of-zimbabweans-fell-into-extreme-poverty-during-covid.
- COH. 2020. A 100 Day City Stabilisation Plan Under the Cllr Jacob Mafume Mayorship Greater Transparency, Accountability and Integrity for Greater Service to the People of Harare. Harare, Zimbabwe: City of Harare Mayor’s Office.
- COH. 2021. “Climate Resilience Water Supply Plan for Harare 2050 (Draft Report).” Harare, Zimbabwe: City of Harare in collaboration with VEI.BV and UNICEF.
- COH. 2022. “City of Harare Water Resilience Plan (Draft).” City of Harare.
- COH. 2022b. “City of Harare Residents Consultation Feedback.” City of Harare.
- CWRA. 2019. “The City Water Resilience Approach.” https://www.arup.com/perspectives/publications/research/section/the-city-water-resilience-approach.
- Dzirutwe, M. 2018. “Cholera outbreak kills 10 people in Zimbabwe”, Reuters, 9 September. https://www.reuters.com/article/us-zimbabwe-health-idINKCN1LP0JZ.
- EMA. 2022. Test Results for Water Samples. Harare: Environmental Management Agency Zimbabwe.
- Falkenmark, M., L. Wang-Erlandsson, and J. Rockström. 2019. “Understanding of Water Resilience in the Anthropocene.” Journal of Hydrology X 2: 100009. https://doi.org/10.1016/j.hydroa.2018.100009.
- Gauff Ingenieure. 2014. Greater Harare Water and Sanitation Investment Report.
- He, C., Zhifeng Liu, Jianguo Wu, Xinhao Pan, Zihang Fang, Jingwei Li, and Brett A. Bryan. 2021. “Future Global Urban Water Scarcity and Potential Solutions.” Nature Communications 12 (1): 4667. https://doi.org/10.1038/s41467-021-25026-3.
- HRW. 2021. “Zimbabwe: Dire Lack of Clean Water in Capital”, Human Rights Watch, 22 September. https://www.hrw.org/news/2021/09/22/zimbabwe-dire-lack-clean-water-capital.
- Huang, Z., X. Yuan, and X. Liu. 2021. “The key Drivers for the Changes in Global Water Scarcity: Water Withdrawal Versus Water Availability.” Journal of Hydrology 601: 126658. https://doi.org/10.1016/j.jhydrol.2021.126658.
- IPCC, 2014. Climate Change 2014: Impacts, Adaptation, and Vulnerability. Part B: Regional Aspects. Contribution of Working Group II to the Fifth Assessment Report of the Intergovernmental Panel on Climate Change [Barros, V. R., C. B. Field, D. J. Dokken, M. D. Mastrandrea, K. J. Mach, T. E. Bilir, M. Chatterjee, K. L. Ebi, Y. O. Estrada, R. C. Genova, B. Girma, E. S. Kissel, A. N. Levy, S. MacCracken, P. R. Mastrandrea, and L. L.White (eds.)]. Cambridge: Cambridge University Press, pp. 688. Available at: https://www.ipcc.ch/site/assets/uploads/2018/02/WGIIAR5-PartB_FINAL.pdf.
- Johannessen, Å, and C. Wamsler. 2017. “What Does Resilience Mean for Urban Water Services?” Ecology and Society 22 (1). https://doi.org/10.5751/ES-08870-220101.
- Krueger, E. H., D. Borchardt, J. W. Jawitz, H. Klammler, S. Yang, J. Zischg, and P. S. C. Rao. 2019. “Resilience Dynamics of Urban Water Supply Security and Potential of Tipping Points.” Earth's Future 7 (10): 1167–1191. https://doi.org/10.1029/2019EF001306.
- Kugarakuripi, J. 2021. “Zimbabweans Grapple With Water Shortage Amidst COVID-19 Pandemic.” Afrobarometer. https://www.afrobarometer.org/publication/ad475-zimbabweans-grapple-water-shortage-amidst-covid-19-pandemic/.
- Larsen, T. A., and W. Gujer. 1997. “The Concept of Sustainable Urban Water Management.” Water Science and Technology 35 (9), https://doi.org/10.1016/S0273-1223(97)00179-0.
- Larsen, T. A., Sabine Hoffmann, Christoph Lüthi, Bernhard Truffer, and Max Maurer. 2016. “Emerging Solutions to the Water Challenges of an Urbanizing World.” Science 352 (6288): 928–933. https://doi.org/10.1126/science.aad8641.
- Lawson, E., Raziyeh Farmani, Ewan Woodley, and David Butler. 2020. “A Resilient and Sustainable Water Sector: Barriers to the Operationalisation of Resilience.” Sustainability 12 (5): 1797. https://doi.org/10.3390/su12051797.
- Leigh, N., and H. Lee. 2019. “Sustainable and Resilient Urban Water Systems: The Role of Decentralization and Planning.” Sustainability 11 (3): 918. https://doi.org/10.3390/su11030918.
- MacAlister, C., and N. Subramanyam. 2018. “Climate Change and Adaptive Water Management: Innovative Solutions from the Global South.” Water International 43 (2): 133–144. https://doi.org/10.1080/02508060.2018.1444307.
- Madani, K., and M. A. Mariño. 2009. “System Dynamics Analysis for Managing Iran’s Zayandeh-Rud River Basin.” Water Resources Management 23 (11): 2163–2187. https://doi.org/10.1007/s11269-008-9376-z.
- Madzimure, J. 2022. “President Launches Borehole Drilling Scheme,” The Herald. https://www.herald.co.zw/president-launches-borehole-drilling-scheme/.
- Manjengwa, F., Tamuka Nhiwatiwa, Elijah Nyakudya, and Petronella Banda. 2019. “Fish from a Polluted Lake (Lake Chivero, Zimbabwe): A Food Safety Issue of Concern.” Food Quality and Safety 3 (3): 157–167. https://doi.org/10.1093/fqsafe/fyz015.
- Mataishe, F. S. 2022. “Zimbabwe: Battle for control of Harare City Council rages on, The Africa Report.com.” https://www.theafricareport.com/206754/zimbabwe-battle-for-control-of-harare-city-council-rages-on/.
- McDonald, R. I., Ian Douglas, Carmen Revenga, Rebecca Hale, Nancy Grimm, Jenny Grönwall, and Balazs Fekete. 2011. “Global Urban Growth and the Geography of Water Availability, Quality, and Delivery.” AMBIO 40 (5): 437–446. https://doi.org/10.1007/s13280-011-0152-6.
- McDonald, R. I., Katherine Weber, Julie Padowski, Martina Flörke, Christof Schneider, Pamela A. Green, Thomas Gleeson, et al. 2014. “Water on an Urban Planet: Urbanization and the Reach of Urban Water Infrastructure.” Global Environmental Change 27: 96–105. https://doi.org/10.1016/j.gloenvcha.2014.04.022.
- Misi, A., W. Gumindoga, and Z. Hoko. 2018. “An Assessment of Groundwater Potential and Vulnerability in the Upper Manyame Sub-Catchment of Zimbabwe.” Physics and Chemistry of the Earth, Parts A/B/C 105: 72–83. https://doi.org/10.1016/j.pce.2018.03.003.
- Musemwa, M. 2021. “Urban Struggles Over Water Scarcity in Harare.” Daedalus 150 (4): 27–47. https://doi.org/10.1162/daed_a_01871.
- Ndakaripa, M. 2021. “Zimbabwe’s Economic Meltdown: Are Sanctions Really to Blame?” The Washington Quarterly 44 (2): 95–120. https://doi.org/10.1080/0163660X.2021.1934997.
- Pinkham, R. 1999. 21st Century Water Systems: Scenarios, Visions, and Drivers. Colorado: Rocky Mountain Institute. https://rmi.org/insight/21st-century-water-systems-scenarios-visions-and-drivers/.
- Purwanto, A., J. Susnik, F. X. Suryadi, and C. de Fariture. 2019. “Using Group Model Building to Develop a Causal Loop Mapping of the Water-Energy-Food Security Nexus in Karawang Regency.” Indonesia Journal of Cleaner Production 240. https://doi.org/10.1016/j.jclepro.2019.118170
- Rachman, G. 2021. “The Threat of Conflict Over Water is Growing”, Financial Times, 1 November.
- Rehan, R., M. A. Knight, C. T. Haas, and A. J. A. Unger. 2011. “Application of System Dynamics for Developing Financially Self-Sustaining Management Policies for Water and Wastewater Systems.” Water Research 45 (16): 4737–4750. https://doi.org/10.1016/j.watres.2011.06.001.
- Resilience Shift. 2017. “Resilience in Water Agenda Setting Scoping Studies Summary Report.”. Accessed 15 May, 2022. https://resilienceshift.org/wp-content/uploads/2017/10/027_Resilience-in-Water.pdf.
- Reuters. 2022. “Zimbabwe Suspends Bank Lending in Bid to Arrest Currency Decline”, Reuters, 8 May. https://www.reuters.com/world/africa/zimbabwe-suspends-bank-lending-bid-arrest-currency-decline-2022-05-07/.
- Rijsberman, F. R. 2006. “Water Scarcity: Fact or Fiction?” Agricultural Water Management 80 (1–3): 5–22. https://doi.org/10.1016/j.agwat.2005.07.001.
- Ritchie, H., and M. Roser. 2017. “Water Use and Stress”, Our World in Data [Preprint]. https://ourworldindata.org/water-use-stress.
- Rodina, L. 2019. “Water Resilience Lessons from Cape Town’s Water Crisis.” WIRES Water 6 (6), https://doi.org/10.1002/wat2.1376.
- Saikia, P., George Beane, Ricard Giné Garriga, Pilar Avello, Louise Ellis, Sophie Fisher, James Leten, et al. 2022. “City Water Resilience Framework: A governance based planning tool to enhance urban water resilience.” Sustainable Cities and Society 77: 103497. https://doi.org/10.1016/j.scs.2021.103497.
- Sridharan, A. R., and Z. B. Irfan. 2020. “Understanding the Water Crisis in India: Application of Causal Loop Modelling to Examine the Environment-Economy Linkage Across Sectors (Working Paper).” Madras School of Economics.
- Stave, K. A. 2003. “A System Dynamics Model to Facilitate Public Understanding of Water Management Options in Las Vegas, Nevada.” Journal of Environmental Management 67 (4): 303–313. http://doi.org/10.1016/S0301-4797(02)00205-0.
- UN. 2021b. “The Sustainable Development Goals Report”. https://unstats.un.org/sdgs/report/2021/.
- UNEP. 2011. “Water Scarcity Briefing.” https://ieep.eu/uploads/articles/attachments/1c1669a0-9f9d-44ea-b3d1-08fd4cdcc6e5/KNOSSOS_POLICY_PAPER_MAIN_BRIEFING.pdf?v = 63664509773#:~:text = Water%20scarcity%20occurs%20where%20insufficient,contribute%20to%20increasing%20water%20use%20.
- van Dijk, R., et al. 2019. “Manyame Catchment: A Risk Assessment’.
- WEF. 2022. “The Global Risks Report 2022,” 17th Edition. https://www.weforum.org/reports/global-risks-report-2022/in-full.
- World, Bank. 2019. Total Number of People in Extreme Poverty, Our World in Data. Available at: https://ourworldindata.org/grapher/total-population-in-extreme-poverty
- Zarghami, S. A., I. Gunawan, and F. Schultmann. 2018. “System Dynamics Modelling Process in Water Sector: A Review of Research Literature.” Systems Research and Behavioral Science 35 (6): 776–790. https://doi.org/10.1002/sres.2518.