
 ?Mathematical formulae have been encoded as MathML and are displayed in this HTML version using MathJax in order to improve their display. Uncheck the box to turn MathJax off. This feature requires Javascript. Click on a formula to zoom.
ABSTRACT
Water reuse with Advanced Water Treatment (AWT) is increasingly appealing for urban areas seeking water supply reliability. In cities facing water scarcity, how can large-scale reuse support reliability and how do reuse operations affect water quality, energy use, and water conservation? This paper presents a systems analysis of metropolitan-scale water reuse and its effects on water supply and quality. For the case study of Los Angeles County, California, USA, hydroeconomic modeling is used to evaluate reuse as a contributor to water supply given urban water conservation, drought-induced water scarcity, and costs and benefits for supply and demand. Results indicate that AWT can be a viable source of supply especially when coupled with conservation. Across modeled scenarios, reuse provides as much as 30% of regional supplies. New water reuse with AWT becomes viable when imported water availability is 50% or less of historic values. Existing indirect potable reuse operations in the county remain important. Systemwide energy intensity of operations increases with greater reuse in the absence of water conservation. Modeled influent flow rates to wastewater treatment plants resemble historical values, but extreme flow events could pose risks. The paper offers a holistic framework to evaluate water reuse as a component of urban water management.
1. Introduction
Water reuse is a source of supply for urban, industrial, and agricultural needs throughout the globe. Alternatively described as water recycling or Advanced Water Treatment (AWT), water reuse involves treating sewage, discharge water, or runoff to high levels for safe use or disposal. Water reuse operations go beyond conventional facilities where wastewater is treated through primary, secondary, and tertiary processes such as sedimentation, filtration, coagulation, and nitrate removal (Asano Citation2006; Leverenz, Tchobanoglous, and Asano Citation2011; Linstedt Citation1982; Metcalf & Eddy Citation2003; NRC Citation2012).
Water reuse operations are typically categorized by level of treatment and end-use. Non-potable reuse (NPR) describes treated wastewater that is sent to end-uses with low risk of direct human contact, such as outdoor irrigation or industrial use. Indirect potable reuse (IPR) describes operations where treated wastewater is sent to a potential water source, such as a groundwater basin or downstream city, via an environmental buffer. These can be groundwater basins, streams, or rivers. Direct potable reuse (DPR) is the process of introducing highly treated wastewater into a drinking water supply system for pre-treatment without an intermediary environmental buffer and long residence time (Leverenz, Tchobanoglous, and Asano Citation2011; Tchobanoglous et al. Citation2011). In practice, since public water and wastewater treatment works were developed in the late nineteenth and early twentieth centuries in modern industrial cities, vast populations of urban and rural dwellers have received water supplies through indirect potable reuse (Melosi Citation2001; Tarr Citation1984). Contemporary facilities in industrialized regions emphasize higher levels of treatment and monitoring to ensure safety. In the U.S., most wastewater treatment plants have moved to secondary and, to a lesser extent, tertiary levels of treatment (EPA Citation2016). Effluent can supply appropriate end-uses through ‘fit-for-purpose’ supply strategies, which match the level of treatment with required risk reduction to achieve public health and environmental quality standards (Sedlak Citation2014).
The prevalence of water reuse operations at any level varies. In some places, such as Israel or Windhoek, Namibia, reuse comprises a significant portion of total supply, while in other locations such as Spain and Singapore, reuse is an important source, but contributes less than 50% (Friedler Citation2001; Gerrity et al. Citation2013; Jiménez and Asano Citation2008; Lahnsteiner and Lempert Citation2007; Lefebvre Citation2018; Luthy and Sedlak Citation2015). For most places, water reuse is a small portion of municipal supplies.
In California, highly-treated wastewater effluent has supplied non-potable and indirect potable reuse operations for decades (Allen and Elser Citation1979; Mills Citation1998). In recent years, water reuse has provided approximately 863 million cubic meters (MCM) of annual supply (700,000 acre-feet, or ac-ft) for non-potable and IPR end-uses including irrigation, industrial operations, and groundwater recharge. To date, the state has no Direct Potable Reuse facilities, but since 2010 California has been developing frameworks for implementing DPR regulations and pilot projects are underway (SWRCB Citation2016; SWRCB Citation2018). Many agencies have undertaken independent feasibility studies, pilot projects, and sizeable field testing in anticipation of future rules allowing some level of direct potable reuse for municipal supplies (City of San Diego Citation2012; MWD Citation2016; WateReuse California Citation2019). The studies have been motivated by increasing concerns of future water scarcity as well as local agency interest in more reliable supplies.
Recycled water is an increasingly important for water supply resilience in California’s Mediterranean climate. The state receives most annual precipitation in winter months, while demands peak in hotter summer months driven by irrigation for agriculture and urban landscapes. Climate variability and extremes are expected to increase with more extreme precipitation events of greater intensity affecting runoff, water supply availability, and drought risk (Dettinger et al. Citation2011; Swain et al. Citation2016; Diffenbaugh, Swain, and Touma Citation2015). The entire American Southwest is expected to see increased drought and reduced availability of future water for agriculture and growth (MacDonald Citation2010). Studies indicate that Eastern Sierra snowpack is expected to decrease, which would also decrease spring runoff volumes and, without additional surface storage or groundwater recharge, reduce availability of imported water during the late summer and early fall months (Costa-Cabral et al. Citation2013; Musselman et al. Citation2017). These factors combine to challenge a system already seeking to increase capture and use of stormwater for recharging the regional groundwater basins that are critical for supply.
Increased reliance on water reuse operations in a metropolitan system introduces several types of uncertainty for water supply and wastewater operations. First, is water reuse cost-effective within a semi-arid metropolitan region that experiences periodic water scarcity, and how does it compare to other sources of supply? Second, how would other management goals, especially long-term efforts to reduce water demand through conservation, affect the potential for and value of new investments in water reuse? Increased conservation in buildings can reduce the volume or increase the concentration of effluent available for reuse (DeZellar and Maier Citation1980; Koyasako Citation1980; Maier, DeZellar, and Miller Citation1981; Tran, Jassby, and Schwabe Citation2017). Third, would changes in the quantity and quality of sewage produced in buildings affect existing treatment processes? Reuse facilities must meet standards of public safety given growing recognition of existing and emerging contaminants such as chemicals, residual pharmaceuticals, and plastics (Chaudhry et al. Citation2017; Mitch and Sedlak Citation2002; NRC Citation2012; Roccaro Citation2018; Snyder et al. Citation2003; Soller, Eftim, and Nappier Citation2018; Wilcox et al. Citation2016). Finally, what are the systemwide energy use implications of significantly expanding water reuse operations at the metropolitan scale? This paper presents a systems analysis of metropolitan-scale water reuse including effects on water supply reliability, energy intensity of operations, and effectiveness of existing treatment operations. Using an integrated hydroeconomic modeling framework for urban water management, the analysis evaluates the role of reuse as a source of supply across scenarios of supply and demand, including drought-induced water scarcity from reduced out-of-basin water imports. Model outputs are then compared with historical monitoring data for influent flow and contaminant concentrations to evaluate potential risk that altered rates of water use may have on existing wastewater treatment facilities. Finally, the systemwide implications for energy use of new AWT operations are evaluated. A case study of Los Angeles (LA) County, California, USA, is considered by incorporating a comprehensive set of regional factors into the hydroeconomic modeling, including costs of supply and demand, existing infrastructure capacity, detailed hydrologic modeling, groundwater management, and water access and rights for over 100 water supply agencies covering 10 million people. Results offer insights regarding the role of large-scale reuse operations within an existing system based on current economic and capacity constraints, and the analysis demonstrates an integrated approach relevant to urban water systems analysis in cities everywhere.
2. Methods
The analysis for the case study of metropolitan Los Angeles included three components. First, hydroeconomic modeling is used to simulate and optimize regional water urban water supply and demand management decisions using linear programming and a link-node network representation of the regional urban water management system. Building on an existing model, Artes (Porse et al. Citation2017), data for newly proposed water reuse operations is incorporated into the hydroeconomic framework to evaluate the viability of expanded reuse operations. Second, results from the hydroeconomic modeling for wastewater production and influent flows in facilities are used to evaluate potential effects on existing wastewater treatment operations by comparing model results with historical records of influent wastewater flow and constituent concentrations. Third, implications for water conservation and systemwide energy use are evaluated. The sections below describe: 1) case study background on Los Angeles water management, 2) model formulation and new reuse operations, 3) data sources, 4) model calibration, 5) procedures to incorporate energy intensity of new reuse operations, 6) modeled scenarios, and 7) procedures to assess design implications for operational efficiency of wastewater treatment facilities.
2.1. Case study: water management and wastewater treatment in Los Angeles
The Los Angeles metropolitan area is highly urbanized. Ecological and climate zones in LA are diverse, spanning estuaries, highland mountains, cool coastal areas, and hot-dry interior lands. Across the county, native landscapes mix with dense urbanization. Today, the region is home to over 10 million people. The region grew through strategic use of local water supplies coupled with acquisition of rights to distant water sources for imported supplies (Davis Citation1993; Erie and Brackman Citation2006; Pincetl, Porse, and Cheng Citation2016). In recent years, water agencies across LA County used approximately 1,800 million cubic meters (MCM) (1.5 million acre-feet) of water from groundwater, imported, recycled, and surface water sources (Federico et al. Citation2019). A large portion of demand is dedicated to outdoor irrigation driven by horticultural practices and landscape preferences of residents (Pataki et al. Citation2013; Pincetl et al. Citation2013; Avolio et al. Citation2015).
Of the 1.5 million acre-feet of typical annual demand, almost sixty percent has historically been supplied from out-of-basin imports through three major infrastructure systems: the Colorado River Aqueduct that draws from the Colorado River at the California-Arizona border, the California State Water Project (SWP) that diverts water from rivers in northern California through the Sacramento-San Joaquin Delta, and the Los Angeles Aqueduct that brings water from the Owens Valley in California’s Sierra Nevada Mountains to the City of Los Angeles (). These water conveyance systems were completed between 1914 and 1972. The primary water importing agency, the Metropolitan Water District of Southern California (MWD), was created through state legislation in 1927 and approved by local voters to import water to the region, first from the Colorado River and subsequently from California’s SWP. MWD distributes imported water to over 100 different water delivery entities (a) within a hierarchy of agencies across Southern California, including in LA County (Pincetl, Porse, and Cheng Citation2016).
Figure 1 . Major sources of imported water supply to Los Angeles County.
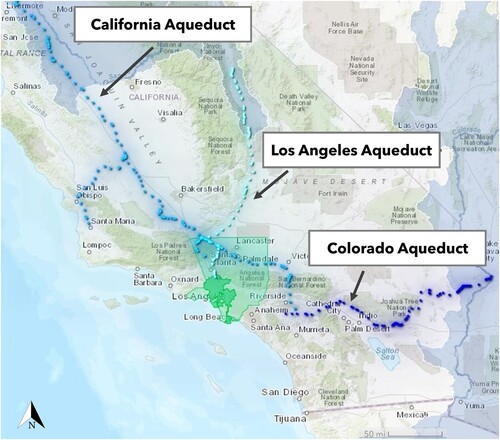
Figure 2 . Within Los Angeles, a complex system of water management includes (a) Water supply agencies, (b) Major watersheds associated with rivers, (c) Groundwater basin management areas, (d) Stormwater capture facilities.
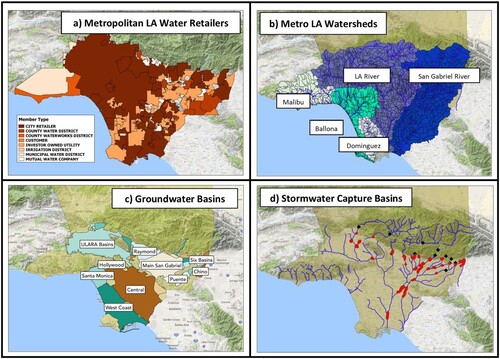
In addition to imported supplies, local hydrology and water sources are also important. The urbanized parts of LA County include five large watersheds. Runoff collects from surrounding mountain ranges and drains through channelized rivers towards the Pacific Ocean (b). The region experiences a Mediterranean climate, with warm-to-hot summers and precipitation occurring in late fall, winter, and early spring months (Kottek et al. Citation2006). Regional precipitation averages across parts of LA County range from 30 to 50 centimeters annually, with higher totals falling in surrounding mountains (LA County Citation2011; NOAA Citation2018). A network of interconnected groundwater basins (c) contains, by rough estimate, over 50,000 MCM of total capacity. Annual allowable groundwater pumping allocations for regional agencies are approximately 780 MCM. Groundwater basins have been intensely managed for decades, typically providing thirty to forty percent of supplies. Stormwater is actively captured across over 20 capture basins (d), combined with recycled water, and infiltrated through managed aquifer recharge, with an annual average of 246 MCM since 2007 (LACDPW Citation2014; USBR and LACDPW Citation2016). While inexpensive imported water provided a source for recharge in past decades, today, most recharge relies on stormwater capture and recycled water (ULARA Watermaster Citation2013; CB/WCB Amended Judgment Citation2013; LADWP Citation2015b).
An extensive and uniquely interconnected system of wastewater treatment plants, often referred to as water reclamation plants (WRPs), exists in Los Angeles (). The facilities treat water to secondary and tertiary levels for discharge to local waterways, but over 222 MCM of influent is further treated to standards of reuse for non-potable uses such as irrigation and groundwater recharge (SWRCB Citation2016). Wastewater facilities are managed by several agencies, including the City of Los Angeles Bureau of Sanitation, the Los Angeles County Sanitation Districts (LACSD), and the Water Replenishment District of Southern California (WRD). details operational parameters of existing facilities used in the model.
Figure 3 . Wastewater treatment facilities in metropolitan Los Angeles.
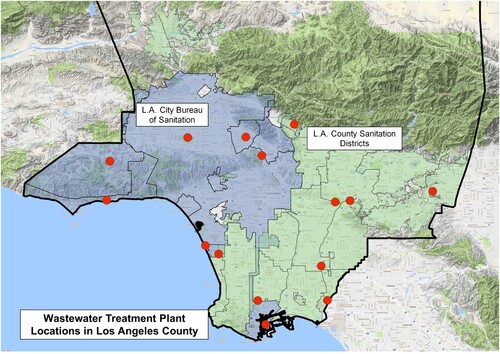
Table 1 . Operational treatment capacity parameters for current wastewater treatment and water reuse facilities, based on data from available sources. The parameters were used as constraints in the modeling (WRP = water reclamation plant).
In recent years, non-potable and indirect potable reuse have comprised 5–10% of annual regional supplies in LA (Gold, Federico, and Pincetl Citation2015; Porse et al. Citation2017). Facing future water scarcity from imported supplies, regional agencies have proposed new water reuse operations that would significantly expand existing capacity for Advanced Water Treatment (). The City of Los Angeles has stated goals to reuse all influent in coming decades and a joint initiative by the County of Los Angeles and the Metropolitan Water District of Southern California (MWD) is slated to build large-scale water reuse operations from LA County’s primary wastewater facility (LACSD Citation2015; LADWP Citation2015a; MWD Citation2016). These facilities could support future operations with Direct Potable Reuse.
Table 2 . Proposed new water reuse operations and associated costs added to the model for this analysis. Many operations are being flexibly designed to provide either indirect or direct potable supplies as existing and emerging regulations allow (MCM/Day = millions of cubic meters per day).
2.2. Formulation
The hydroeconomic model, Artes, was developed to understand the potential to maximize local water supplies in LA County and has been used to evaluate many aspects of future urban water management (Porse et al. Citation2017). Artes incorporates data from hundreds of sources on water utility operations, surface hydrology, climate, hydrogeology, wastewater operations, and stormwater infrastructure. It includes a central database and open-source software that supports analysis at multiple geographic and temporal scales in LA. Model outputs quantify agency-specific and regional totals for water flows, potential shortages that are calculated as the difference between expected demands and available supplies, and annual use of water sources to understand regional water supply portfolios given assumptions of conservation and imported water availability.
The objective function (Equation 1) uses a least-cost formulation, calculated as the difference between total costs and assessed benefits. Total costs include supply and distribution costs and assessed economic damages
associated with residential outdoor water conservation, while benefits
are limited to recreational benefits associated with large stormwater capture basins (Porse et al. Citation2018):
(1)
(1) Total costs and economic damages from reduced deliveries depend on the flows of water across links in the system, each of which have associated cost coefficients. During a time step t, supply costs (Equation 2) are equal to the product of the volume of flow from node i to node j across link k (
) and the specified unit cost of flows across link k
:
(2)
(2)
Economic damages (Equation 3) for residential water conservation during a time step are similarly calculated by summing the product of volumetric shortages from reduced deliveries () from node i to node j over link k, and the unit cost associated with assessed economic damages for node j (
):
(3)
(3) Unit costs for damages were estimated as agency-specific welfare losses and based on a linear demand function procedure with estimated elasticities of demand and water prices derived from existing sources and existing work in California (Porse et al. Citation2018; Buck et al. Citation2016; Jenkins and Lund Citation2000). Economic losses capture costs of water use reductions, especially outdoor water use reductions achieved by changing irrigation habits and replacing lawns. Some costs are not considered, such as potential revenue losses for utilities or additional costs to mitigate effects of water conservation actions on utility operations. Further details are included in the Supplemental Data section.
Volumetric shortages for a demand node j during a time step are the difference between the demands for node j
and the sum of flows (supplies) to node j (Equation 4).
Minimum demands include health, safety, and industrial demands () associated with indoor residential populations that use 189 liters per capita per day (50 gallons per person per day), which is based on current indoor consumption and policy targets in California, as well as reported commercial and industrial uses (Equation 5):
(4)
(4)
(5)
(5)
Economic benefits B (Equation 6) during time t associated with certain stormwater capture uses are calculated across all nodes as the product of the flows and the unit value of benefits for that node ():
(6)
(6) A continuity equation preserves flows into and out of each node during time t (Equation 7):
(7)
(7) Some nodes, including watersheds and conveyance infrastructure, have
inflows from external sources, while all nodes have
storage capacity and
losses during a given time step based on loss rates included in the water balance. For a given time, the flows across link k cannot exceed the capacity
(Equation 8):
(8)
(8) Finally, Eq. 9 represents a lower bound so flows across links cannot be negative:
(9)
(9) The processes for validating and calibrating the hydrologic and economic formulations within the Artes model are extensively documented in multiple peer-reviewed sources (Porse et al. Citation2017; Porse et al. Citation2018). Additional peer-reviewed studies have used Artes to evaluate implications of local water reliance on supply reliability, stormwater capture impacts on streamflow, groundwater management, energy use, and key themes for future water sustainability (Pincetl et al. Citation2019; Porse et al. Citation2015; Porse and Pincetl Citation2018; Porse et al. Citation2018).
2.3. Data sources
Data were compiled from existing models, documents, reports, and agency databases. The data are historic (up to 2010), corresponding with available data at the time of development. It captures past droughts but does not reflect the most recent droughts (2011–2016, 2020–2022).
Relevant data included groundwater pumping and recharge, water demands, institutional water transfer agreements, assessed tree canopy water needs, historic wastewater and water reuse flows, historic imported water supplies, and precipitation and evaporation. Data covered the period of 1986–2010, with wastewater influent and effluent available for 1996–2010. Detailed descriptions of the data sources are provided in the Supplemental Data section.
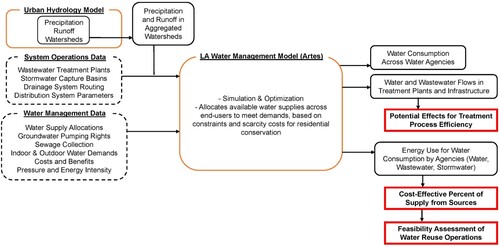
Precipitation, runoff, and recharge were incorporated into the analysis using an existing hydrologic model for LA County, the Watershed Management Modeling System (WMMS), and integrated into Artes (LACDPW Citation2013; Porse et al. Citation2017). WMMS includes 25 years of daily climate variables for over 2,000 small watersheds. These were aggregated into 47 watershed zones within Artes that correspond to key catchments for managed streams or infrastructure operations. Aggregated values of precipitation, watershed inflows and outflows, and evaporation losses in each watershed zone in Artes for the unaltered system serve as flow constraints within the optimization. Past work showed that incorporating wastewater system effluent discharges to simulate altered hydrologic flows improved the agreement of modeled stream flows with historic gauge data in several watersheds (Porse et al. Citation2017). Model calibration procedures are extensively documented (Porse et al. Citation2017; Porse et al. Citation2018; Porse and Pincetl Citation2018). The input data sets, software integration, and outputs are shown in .
Figure 4 . Schematic depicting architecture and data flows of the Artes model
For wastewater treatment, past studies included current wastewater treatment and reuse operations, as well as some proposed small operations (Porse et al. Citation2017; Porse et al. Citation2018; Porse et al. Citation2018). Table S2 in the Supplemental Data section provides a detailed description of the previously modeled operations. For this study, new nodes and links were incorporated into the network model to represent network connectivity and flow for the proposed large-scale water reuse operations detailed in .
2.4. Calibration
Model calibration involved a multi-step process (Porse et al. Citation2017). First, water distribution system losses (evaporation, evapotranspiration, groundwater recharge, and leakage), were calibrated for 2010, the only year with reasonable estimates of annual water supply and demand values across all retailers based on data available at the point of the model’s development. Losses in urban water distribution networks were determined by summing all reported demands from retailers flowing to each of the wastewater treatment plants, based on sewer network pipe service areas. The percent of losses was determined as the difference between the total inflows and total outflows in a service region. Based on the collection system networks, LA County was aggregated into two regions: 1) the LA County joint service area comprised of 8 treatment and recycling plants, and 2) the LA City area comprised of 4 plants. This resulted in aggregating the retailers into two main groups feeding each system. Urban system losses for water supply distribution, household uses, and wastewater collection in the L.A. County network ranged from 33 to 55%, with higher values in summer months. In L.A. City including the cities of Los Angeles, Burbank, Glendale, and others, losses ranged from 1 to 34% (Porse et al. Citation2017). For comparison, a limited survey of L.A. County water retailers reported up to 4% losses from leaks within distribution systems alone, while statewide reporting indicated leak losses in distribution systems of over 7% (Naik and Glickfeld Citation2015; Rupiper et al. Citation2021).
Second, simulated runoff, evapotranspiration, and infiltration data obtained from outputs to the regional hydrologic model (WMMS) were compared to actual stream flow records for the downstream gauges in regional watersheds. Calibration results verified the accuracy of the underlying hydrologic model for the LA River and San Gabriel River watersheds without WRP outflows based on Nash-Sutcliffe efficiency (NSE) values of 0.790 and 0.604. Adding WRP outflows to the surface flows based on the drainage network increased the accuracy of calibration during summer months. Further details were previously reported (Porse et al. Citation2017).
Third, after calibrating the hydrologic model with WRP outflows, monthly results for precipitation and total outflow were imported into the Artes database. The monthly precipitation and upstream surface flows were added to watersheds as inflows. Losses to evaporation and groundwater infiltration were calculated for each watershed zone based on constraining the optimization to match outflows from watersheds to the WMMS values for each month.
2.5. Modeled scenarios
To evaluate the economic feasibility of water reuse operations over a variety of operational scenarios, water scarcity was imposed in the form of cutbacks in available imported water. Ten scenarios were modeled, with available imported water included as a percentage of the historic annual amount from each of the three primary imported water sources: Owens Valley, the Colorado River, and Northern California through the Sacramento-San Joaquin Delta. The modeled percentages ranged from 0 to 100%. For each scenario of available imported water, the formulation allocated water flows to agencies throughout the network based on least-cost options to deal with imposed water scarcity given existing institutional and legal constraints that govern access to water supply and rights. In scenarios with very low imported water availability from all imported water sources, this would instigate significant water conservation in most areas.
2.6. Effects of flow changes on wastewater treatment operations
Many wastewater treatment facilities and collection systems in California are aging and have not undergone comprehensive upgrades. Older treatment facilities were designed to specifications of influent flow and constituent concentrations in past decades. In recent surveys, a significant percentage of wastewater treatment managers have reported that changes to influent flow and quality during recent drought affected existing wastewater treatment and reuse facilities (Porse et al. Citation2023; Chappelle et al. Citation2019). Without upgrades and improvements, wastewater facilities can face challenges in maintaining process efficiency (percent of contaminants removed) and meeting permitted discharge limits of contaminants (Tran, Jassby, and Schwabe Citation2017; Schwabe et al. Citation2020; OWP at Sacramento State Citation2022).
The effects of modeled scenarios on treatment process efficiency were evaluated through two procedures. First, modeled influent flow rates were compared to historical influent flow rates during the period with available data (1996–2010). Second, the relationship between flow rate, contaminant concentrations, and treatment effectiveness was compared using historical operational data, with the intent of evaluating how lower influent flow rates from water conservation may affect influent constituent concentrations. For one facility with available data (Hyperion WRP), daily monitoring records of influent and effluent flow, Biochemical Oxygen Demand (BOD) and Total Suspended Solids (TSS) from 2011 to 2019 were used to examine relationships. The treatment effectiveness was calculated for each day as the percent removal of BOD and TSS. Multiple regression with a semi-log model was used to evaluate relationships of influent flow and concentration as explanatory variables for percent removal. Two separate models were developed for BOD and TSS, with percent removal of a contaminant as a response variable and log-transformed values of influent flow and concentration of the contaminant as explanatory variables. The models were implemented in R Studio using the lm package.
2.7. Energy intensity of water reuse
Integrating potential reuse operations into the hydroeconomic framework required a newly developed representation of energy use intensity to simulate conveying and pumping water throughout the metropolitan region (Porse et al. Citation2020). Numerous studies have evaluated the energy implications of water management strategies in Los Angeles (Porse et al. Citation2020; Sanders Citation2016; Sokolow, Godwin, and Cole Citation2016; Stokes-Draut et al. Citation2017; Wilkinson, Wolff, and Shwom Citation2006). Replacing imported water sources with supplies from local reuse offers an opportunity to achieve net reductions in electricity consumption and associated costs, but additional pumping and treatment needs offset energy savings (Escriva-Bou, Lund, and Pulido-Velazquez Citation2015; Spang, Holguin, and Loge Citation2018; Stokes-Draut et al. Citation2017; Wilkinson, Wolff, and Shwom Citation2006). Greater use of in-basin sources with more moderate energy intensity could reduce systemwide energy intensity, but conveying water throughout a city such as Los Angeles also uses significant energy (Kenway et al. Citation2015; LADWP Citation2015a; Lam, Kenway, and Lant Citation2017; Sokolow, Godwin, and Cole Citation2016).
For this analysis, pumping energy needs and costs associated with new centralized water reuse were incorporated into the model using commercial electricity supply rates that utilities pay to local investor-owned utilities (estimated as USD $0.10 per kilowatt-hour). Details on the methods and data are included in the Supplemental Data.
3. Results
3.1. Water reuse and regional water supplies
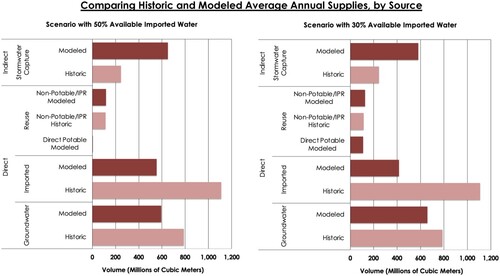
Model results indicate that new water reuse operations with AWT become economically viable when imported water availability is 50% or less of historic values. Across scenarios, existing and less expensive indirect potable reuse facilities in the county consistently make up 7–12% of supplies, regardless of imported water availability. For instance, in a scenario with 50% annual availability of imported supplies, indirect and non-potable reuse comprises 10%, while new reuse with AWT is only 1% (). New and more expensive AWT facilities become more viable in scenarios when 50% or less of imported water is available, and AWT becomes especially viable as imported water availability falls to 30% of historic inflows. In these scenarios, existing IPR and proposed AWT provide 20%−30% of total regional supplies across the county. The increase occurs for two reasons. First, some recycled water that would be used for indirect potable reuse through groundwater recharge is instead diverted to AWT. Second, some agencies turn to more expensive AWT sources to meet demands and alleviate economic losses associated with shortages. Thus, significant disruptions in existing supply are needed to instigate adoption of AWT operations.
Figure 5 . Supply portfolios from the hydroeconomic modeling framework. The two scenarios modeled responses to an imposed reduction of 50% of historic imported water supplies with and without new large-scale reuse project capacity (MCM = Millions of Cubic Meters). The percentages represent the percent of total supply in the scenario from a source.
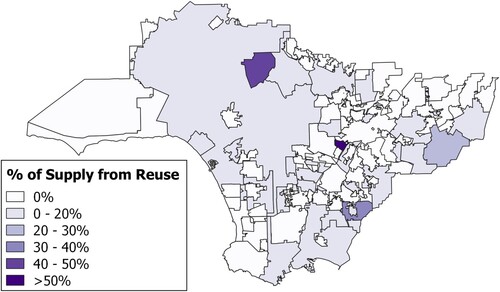
Examining localized results reveals how particular agencies may capitalize on cost-effective strategies for reuse. Water retailer agencies with access to a nearby reuse facility were more likely to receive a significant portion of supplies from reuse through the least-cost decision-making approach (). Reducing pumping requirements to move water in the basin can significantly increase the cost-effectiveness of water reuse as a supply source.
Figure 6 . Water reuse as a percentage of supply for water retailers throughout LA County in the modeled scenario with an imposed 50% reduction in available imported water.
3.2. Wastewater flows and treatment process efficiency
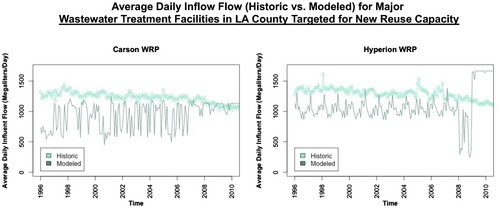
Promoting greater use of local water sources could affect wastewater treatment operations, with effects varying based on geographic location in the LA Basin (Porse et al. Citation2017; Porse et al. Citation2018). Comparing model results with historic data for the two largest facilities indicates that without AWT, modeled influent flow rates are less than historical values and design flows. However, once AWT becomes economically viable due to imported water scarcity, flow rates are boosted to maximize production (). For instance, in the scenario with 30% imported water availability, influent flows to LA City’s Hyperion Treatment Plant are less than the original design capacity of 450 million gallons per day (MGD, which is equivalent to 1.7 Million Cubic Meters, or MCM) for many years as reservoir storage is drawn down, but in later years that maximize AWT, influent flow rates are equal to or greater than recent historical levels. Similar trends occur in Joint Water Pollution Control Plant (Carson, or JWPCP) that is operated by the Los Angeles County Sanitation Districts (LACSD) and serves many of the cities and unincorporated areas in LA County outside the jurisdiction of the City of Los Angeles. This indicates that future urban water management options must balance opportunities for reuse with the cost-effectiveness of conservation as a demand management option.
Figure 7 . Historic and modeled influent flows to the two largest wastewater treatment facilities in LA. The modeled flows are from a scenario with 30% available imported water, which represents extended water scarcity from drought.
Implications for these influent flow rates based on basic statistical analysis of monitoring data are inconclusive. Data for influent flow and constituent concentrations (BOD, TSS) for one of the two largest regional wastewater treatment facilities (Hyperion WRP) does not provide clear indications that future operations and treatment effectiveness would be significantly affected from future modeled flows. From 2011 to 2019, average influent flow was 326 MGD and average annual influent concentration of TSS and BOD was 399 and 313 mg/L per day. Average percent removal from influent to effluent was consistently 94–95%.
Multiple regression modeling indicated that flow was inversely correlated with percent removal of both TSS and BOD, while influent concentrations were positively correlated. For each 1% decrease in flow, percent removal of TSS increases by 0.027, which given that the response variable unit is percent, is equivalent to a 2.7% increase (R2 = 0.45). Similarly for BOD, a 1% decrease in flow yields a change in percent removal of 0.026 (R2 = 0.29). Both explanatory variables are statistically significant. shows results. However, the low values for the coefficient of variation indicate that, in the modeled facility, other factors not captured in the model likely affect treatment process efficiency. Visualizing the percent removal of TSS and BOD as a function of influent concentration and flow rate reveals a weak positive correlation for both, whereby increased concentration corresponds with an increased percent removal (). It is likely that additional operational and environmental control variables would be necessary to identify clear trends between influent flow and treatment process efficiency, but data was not available for this study. This would be an area for additional future investigation.
Figure 8 . Daily influent monitoring data for contaminant concentration and percent removal of Biochemical Oxygen Demand (BOD) and Total Suspended Solids (TSS) for Hyperion WRP (2011–2019). Source: Based on data from the California Integrated Water Quality System and published by Keene, Babchanik, and Porse (Citation2022).
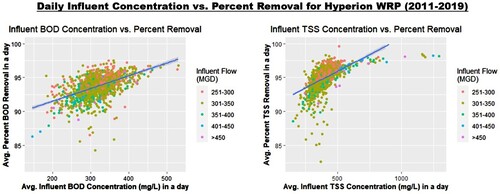
Table 3 . Results from multiple regression modeling with a semi-log formulation.
3.3. Energy use
Increased reliance on AWT would replace current imported water supplies to the region from the Sacramento-San Joaquin Delta and the Colorado River, which both require significant amounts of energy. Water conservation is a key driver of energy use reductions for water supply operations within the basin. In modeled scenarios, as imported water grows scarcer and demand reduces, the electricity intensity of the water supply system decreases until the threshold of 50% imported water availability (). Below 50% of imported water supply, systemwide electricity intensity increases again (). Drought years, which are identified as years with less than the 50th percentile of annual precipitation in the region during the modeled period, had higher average electricity intensity driven by greater reliance on AWT ().
Table 4 . Modeled scenarios of imported water availability with available reuse capacity, including both existing indirect potable reuse and newly proposed advanced water treatment.
Table 5 . Average value of electricity intensity during drought, non-drought, and all years for the modeled scenario of 50% of historic imported water availability (kWh = Kilowatt-Hours). Drought and non-drought years are identified as years with greater or less than the 50th percentile of annual precipitation during the time period from 1986 to 2010.
4. Discussion
Model results indicate that the feasibility of AWT as a source of supply is linked to scarcity of existing imported water supplies. New reuse operations become cost-effective after extended periods of limited imported water availability. Coupled with demand reductions via conservation and continued use of stormwater capture and water storage, water reuse from existing and proposed sources is estimated to comprise up to 30% of regional supplies, but only in scenarios of significant imported water scarcity. However, this modeled economic viability of new AWT operations is rooted in existing financial and economic practices. Imported water sources were built over a century ago. Retail unit costs for agencies to purchase annual imported water allocations from MWD have increased over time to cover costs for energy, maintenance, and infrastructure upgrades. Costs for new reuse infrastructure (or other supply options) typically incorporate both construction and long-term operational costs, which are also annualized over a future long period. While regional planning studies evaluate the future annualized costs of new sources such as reuse or stormwater capture, there is currently no consistency in whether regional planning documents incorporate long-term escalation in annualized unit costs for existing annual water purchases. Thus, the existing imported water purchases can seem mistakenly cheaper. In a system with path dependence (Liebowitz and Margolis Citation1995), the financial viability of a new source such as reuse is subject to the implications of past decisions as well as circumstances of future ones.
The analysis is subject to limitations. First, the analysis at the monthly time step may fail to capture important dynamics that affect water and wastewater system operations, such as extreme daily peak flows and concentrations. Second, model results may overestimate stormwater capture as a contribution to water supply because the model does not have sufficient temporal resolution to represent extreme hydrologic events. This means that reuse could be underrepresented as a source of supply if stormwater capture and recharge are too optimistic. Third, the modeling does not incorporate water quality considerations. Emerging contaminants may push more communities to invest in Advanced Water Treatment. Finally, system losses from all sources including wastewater systems were estimated and may not reflect losses that occur in new AWT operations.
5. Conclusions
AWT operations were incorporated into an integrated urban water resources model, Artes, for metropolitan Los Angeles. The model was run across scenarios of decreased imported water availability, which is a main supply source for many agencies but faces future scarcity. Cost and energy requirements for advanced water treatment operations were drivers of the feasibility of the new AWT sources.
Results indicate that, without significant water supply scarcity in the form of available imports, new reuse operations would not be highly utilized based on the primary driver of cost-effectiveness. Across modeled scenarios that each span multiple years, reuse emerges as a significant source of supply only in scenarios with 50% or less imported water. During such times, modeled reuse supplies up to 30% of regional demands. Pumping costs to move treated water uphill in the basin are a significant limit on cost-effectiveness of water reuse due to the locations of current large wastewater treatment facilities. More localized water reuse operations, which were not explicitly included in the modeling, offer opportunities to reduce energy and pumping costs and increase economic viability of operations. Analysis of monitoring data indicates limited to modest risk to existing treatment operations from future influent flow rates and likely associated constituent concentrations. In summary, the modeling framework and results offer a template for integrating water reuse operations into integrated models of urban water planning.
Supplemental Material
Download Zip (4.2 MB)Acknowledgements
The model and previous studies were supported through a grant from the U.S. National Science Foundation Water, Sustainability, and Climate program (NSF Award #1204235).
Disclosure statement
No potential conflict of interest was reported by the author(s).
Data availability
Model documentation, data, and software are openly available (Porse Citation2022). Supporting data for the analysis is available as a supplementary file. Wastewater treatment facility data used to evaluate potential water quality and treatment effects is available through a Hydroshare repository (Keene, Babchanik, and Porse Citation2022).
Additional information
Funding
References
- Allen, Preston K., and Gordon L. Elser. 1979. “They Said It Couldn’t be Done – The Orange County, California Experience.” Desalination 30 (1): 23–38. https://doi.org/10.1016/S0011-9164(00)88430-1.
- Asano, Takashi. 2006. Water Reuse: Issues, Technology, and Applications. New York: McGraw-Hill.
- Avolio, Meghan L., Diane E. Pataki, Thomas W. Gillespie, G. Darrel Jenerette, Heather R. McCarthy, Stephanie Pincetl, and Lorraine Weller Clarke. 2015. “Tree Diversity in Southern California’s Urban Forest: The Interacting Roles of Social and Environmental Variables.” Frontiers in Ecology and Evolution 3: July. https://doi.org/10.3389/fevo.2015.00073.
- Buck, Steven, Maximilian Auffhammer, Stephen Hamilton, and David Sunding. 2016. “Measuring Welfare Losses from Urban Water Supply Disruptions.” Journal of the Association of Environmental and Resource Economists 3 (3): 743–778. https://doi.org/10.1086/687761.
- CB/WCB Amended Judgment. 2013. Central and West Basin Water Replenishment District v. Charles E. Adams et al: Third Amended Judgment. Superior Court of the State of California, Los Angeles County.
- Chappelle, Caitrin, Henry McCann, David Jassby, Kurt Schwabe, and Leon Szeptycki. 2019. Managing Wastewater in a Changing Climate. Sacramento, CA: Public Policy Institute of California.
- Chaudhry, Rabia, Kerry Hamilton, Charles Haas, and Kara Nelson. 2017. “Drivers of Microbial Risk for Direct Potable Reuse and de Facto Reuse Treatment Schemes: The Impacts of Source Water Quality and Blending.” International Journal of Environmental Research and Public Health 14 (6): 635. https://doi.org/10.3390/ijerph14060635.
- City of San Diego. 2012. Recycled Water Study. San Diego, CA: Brown and Caldwell, prepared for the City of San Diego. https://www.sandiego.gov/sites/default/files/legacy/water/pdf/purewater/2012/recycledfinaldraft120510.pdf.
- Costa-Cabral, Mariza, Sujoy B. Roy, Edwin P. Maurer, William B. Mills, and Limin Chen. 2013. “Snowpack and Runoff Response to Climate Change in Owens Valley and Mono Lake Watersheds.” Climatic Change 116 (1): 97–109. https://doi.org/10.1007/s10584-012-0529-y.
- Davis, Margaret Leslie. 1993. Rivers in the Desert: William Mulholland and the Inventing of Los Angeles. 1st ed. New York, NY: HarperCollins Publishers.
- Dettinger, Michael D., Fred Martin Ralph, Tapash Das, Paul J. Neiman, and Daniel R. Cayan. 2011. “Atmospheric Rivers, Floods and the Water Resources of California.” Water 3 (2): 445–478. https://doi.org/10.3390/w3020445.
- DeZellar, Jeffrey, and Walter Maier. 1980. “Effects of Water Conservation on Sanitary Sewers and Wastewater Treatment Plants.” Journal (Water Pollution Control Federation), 76–88.
- Diffenbaugh, Noah S., Daniel L. Swain, and Danielle Touma. 2015. “Anthropogenic Warming Has Increased Drought Risk in California.” Proceedings of the National Academy of Sciences 112 (13): 3931–3936. https://doi.org/10.1073/pnas.1422385112.
- EPA. 2016. Clean Watershed Needs Survey 2012 Report to Congress. Washington, D.C.: U.S. Environmental Protection Agency. https://www.epa.gov/cwns.
- Erie, Steven P., and Harold David Brackman. 2006. Beyond Chinatown: The Metropolitan Water District, Growth, and the Environment in Southern California. Stanford: Stanford University Press.
- Escriva-Bou, Alvar, Jay R. Lund, and Manuel Pulido-Velazquez. 2015. “Modeling Residential Water and Related Energy, Carbon Footprint and Costs in California.” Environmental Science & Policy 50 (June): 270–281. https://doi.org/10.1016/j.envsci.2015.03.005.
- Federico, Felicia, Anne Youngdahl, Sagrarika Subramanian, Cassie Rauser, and Mark Gold. 2019. 2019 Environmental Report Card for Los Angeles County Update. Los Angeles, CA: UCLA Institute of the Environment and Sustainability.
- Friedler, E. 2001. “Water Reuse — An Integral Part of Water Resources Management: Israel as a Case Study.” Water Policy 3 (1): 29–39. https://doi.org/10.1016/S1366-7017(01)00003-4.
- Gerrity, Daniel, Brian Pecson, R. Shane Trussell, and R. Rhodes Trussell. 2013. “Potable Reuse Treatment Trains Throughout the World.” Journal of Water Supply: Research and Technology-Aqua 62 (6): 321–338. https://doi.org/10.2166/aqua.2013.041.
- Gold, Mark, Felicia Federico, and Stephanie Pincetl. 2015. 2015 Environmental Report Card for Los Angeles County. Los Angeles, CA: UCLA Institute of the Environment and Sustainability.
- Jenkins, Marion W., and Jay R. Lund. 2000. “Integrating Yield and Shortage Management Under Multiple Uncertainties.” Journal of Water Resources Planning and Management 126 (5): 288–297. https://doi.org/10.1061/(ASCE)0733-9496(2000)126:5(288).
- Jiménez, Blanca, and Takashi Asano. 2008. Water Reuse an Internatioanl Survey of Current Practice, Issues and Needs. London: IWA.
- Keene, Dakota, David Babchanik, and Erik Porse. 2022. “Influent Parameter Concentrations, Mass Loading Values, and Influent Flow Values for Evaluating Operations During Dry Weather Flows at California Wastewater Treatment Facilities.” Office of Water Programs, Sacramento State University, https://doi.org/10.4211/hs.e02c71690d3d4df9abfaf8ec33f7f9c7.
- Kenway, S. J., A. Binks, J. Lane, P. A. Lant, K. L. Lam, and A. Simms. 2015. “A Systemic Framework and Analysis of Urban Water Energy.” Environmental Modelling & Software 73 (November): 272–285. https://doi.org/10.1016/j.envsoft.2015.08.009.
- Kottek, Markus, Jürgen Grieser, Christoph Beck, Bruno Rudolf, and Franz Rubel. 2006. “World Map of the Köppen-Geiger Climate Classification Updated.” Meteorologische Zeitschrift 15 (3): 259–263. https://doi.org/10.1127/0941-2948/2006/0130.
- Koyasako. 1980. Effects of Conservation on Wastewater Flow Reduction: A Perspective. EPA-600/2-80-137. Cincinnati, OH: U.S. Environmental Protection Agency Municipal Environmental Research Laboratory.
- LACDPW. 2013. Los Angeles County Water Management Modeling System (WMMS). Los Angeles County: Los Angeles County Department of Public Works.
- LACDPW. 2014. “Spreading Grounds Database: Water Conserved Information.” Los Angeles County Department of Public Works. http://dpw.lacounty.gov/wrd/SpreadingGround/watercon/.
- LA County. 2011. Los Angeles County Enterprise GIS Database: Rainfall. Shapefile, Los Angeles County: Los Angeles County Department of Public Works. https://egis3.lacounty.gov/dataportal/tag/schools/.
- LACSD. 2015. Twenty-Sixth Annual Status Report on Recycled Water use. Doc No 3392791. Los Angeles, CA: Sanitation Districs of Los Angeles County.
- LADWP. 2015a. Urban Water Management Plan. Los Angeles, CA: Los Angeles Department of Water and Power.
- LADWP. 2015b. Stormwater Capture Master Plan. Los Angeles, CA: Prepared by Geosyntec and TreePeople for the LA Department of Water and Power.
- LADWP. 2019. Hyperion Water Reuse and Resiliency Program. Los Angeles, CA: Los Angeles Department of Water and Power. https://s3-us-west-2.amazonaws.com/ladwp-jtti/wp-content/uploads/sites/3/2019/09/19144819/Hyperion-reuse-5.pdf.
- Lahnsteiner, J., and G. Lempert. 2007. “Water Management in Windhoek, Namibia.” Water Science and Technology 55 (1-2): 441–448. https://doi.org/10.2166/wst.2007.022.
- Lam, Ka Leung, Steven J. Kenway, and Paul A. Lant. 2017. “Energy Use for Water Provision in Cities.” Journal of Cleaner Production 143 (February): 699–709. https://doi.org/10.1016/j.jclepro.2016.12.056.
- Lefebvre, Olivier. 2018. “Beyond NEWater: An Insight Into Singapore’s Water Reuse Prospects.” Current Opinion in Environmental Science & Health 2 (April): 26–31. https://doi.org/10.1016/j.coesh.2017.12.001.
- Leverenz, Harold L., George Tchobanoglous, and Takashi Asano. 2011. “Direct Potable Reuse: A Future Imperative.” Journal of Water Reuse and Desalination 1 (1): 2. https://doi.org/10.2166/wrd.2011.000.
- Liebowitz, Stan J., and Stephen E. Margolis. 1995. “Path Dependence, Lock-in, and History.” Journal of Law, Economics, & Organization 11 (1): 205–226.
- Linstedt, K. D. 1982. “Water Recycling: Review and Background.” Water Science and Technology 14 (9-11): 1385–1392. https://doi.org/10.2166/wst.1982.0173
- Luthy, Richard G., and David L. Sedlak. 2015. “Urban Water-Supply Reinvention.” Daedalus 144 (3): 72–82. https://doi.org/10.1162/DAED_a_00343.
- MacDonald, Glen. 2010. “Water, Climate Change, and Sustainability in the Southwest.” Proceedings of the National Academy of Sciences 107 (50): 21256–21262. https://doi.org/10.1073/pnas.0909651107
- Maier, Walter, Jeffrey DeZellar, and Raina Miller. 1981. “Benefits of Water Conservation Depend on Comprehensive Planning.” Water Resources Bulletin: American Water Resources Association 17 (4): 672–677. https://doi.org/10.1111/j.1752-1688.1981.tb01275.x
- Melosi, Martin. 2001. Effluent America: Cities, Industry, Energy, and the Environment. Pittsburgh: University of Pittsburgh Press.
- Metcalf & Eddy. 2003. “Wastewater Engineering: Treatment and Reuse.” In McGraw-Hill Series in Civil and Environmental Engineering. 4th ed, edited by George Tchobanoglous, Franklin L. Burton, and H. David Stensel. Boston: McGraw-Hill.
- Mills, W. R. 1998. “Groundwater Recharge at the Orange County Water District.” Water Reclamation and Reuse, 1105–1142.
- Mitch, William A., and David L. Sedlak. 2002. “Formation of N-Nitrosodimethylamine (NDMA) from Dimethylamine During Chlorination.” Environmental Science & Technology 36 (4): 588–595. https://doi.org/10.1021/es010684q.
- Musselman, Keith N., Martyn P. Clark, Changhai Liu, Kyoko Ikeda, and Roy Rasmussen. 2017. “Slower Snowmelt in a Warmer World.” Nature Climate Change 7 (3): 214–219. https://doi.org/10.1038/nclimate3225.
- MWD. 2016. Potential Regional Recycled Water Program Feasibility Study. 1530. Los Angeles, CA: Metropolitan Water District of Southern California.
- Naik, Kartiki, and Madelyn Glickfeld. 2015. Water Distribution System Efficiency: An Essential or Neglected Part of the Water Conservation Strategy for Los Angeles County Water Retailers? Los Angeles, CA: UCLA Institute of the Environment and Sustainability.
- NOAA. 2018. Data Tools: 1981-2010 Normals. California. Washington, D.C.: National Oceanographic and Atmospheric Adminsitration. https://www.ncdc.noaa.gov/cdo-web/datatools/normals.
- NRC. 2012. Water Reuse: Potential for Expanding the Nation’s Water Supply Through Reuse of Municipal Wastewater. Washington, D.C.: National Research Council. Committee on the Assessment of Water Reuse as an Approach to Meeting Future Water Supply Needs; National Research Council.
- OWP at Sacramento State. 2022. Environmental and Economic Effects of Water Conservation Regulations in California: Evaluating Effects of Urban Water Use Efficiency Standards (AB 1668-SB 606) on Urban Retail Water Suppliers, Wastewater Management Agencies, and Urban Landscapes. Sacramento, CA: Prepared by the Office of Water Programs at Sacramento State, the University of California Los Angeles, the University of California Davis, and California Polytechnic University Humboldt. https://www.waterboards.ca.gov/water_issues/programs/conservation_portal/regs/water_efficiency_legislation.html.
- Pataki, Diane E., H. R. McCarthy, Thomas W. Gillespie, G. Darrel Jenerette, and Stephanie Pincetl. 2013. “A Trait-Based Ecology of the Los Angeles Urban Forest.” Ecosphere (washington, D C) 46 (8): 7y2.
- Pincetl, Stephanie, Erik Porse, and Deborah Cheng. 2016. “Fragmented Flows: Water Supply in Los Angeles County.” Environmental Management 58 (2): 208–222. https://doi.org/10.1007/s00267-016-0707-1.
- Pincetl, Stephanie, Erik Porse, Kathryn B. Mika, Elizaveta Litvak, Kimberly F. Manago, Terri S. Hogue, Thomas Gillespie, Diane E. Pataki, and Mark Gold. 2019. “Adapting Urban Water Systems to Manage Scarcity in the 21st Century: The Case of Los Angeles.” Environmental Management 63 (3): 293–308. https://doi.org/10.1007/s00267-018-1118-2.
- Pincetl, Stephanie, Setal S. Prabhu, Thomas W. Gillespie, G. Darrel Jenerette, and Diane E. Pataki. 2013. “The Evolution of Tree Nursery Offerings in Los Angeles County Over the Last 110 Years.” Landscape and Urban Planning 118 (October): 10–17. https://doi.org/10.1016/j.landurbplan.2013.05.002.
- Porse, Erik. 2022. Artes: Modeling Water Resources Management in Los Angeles. Los Angeles, CA: California Center for Sustainable Communities, UCLA Institute of the Environment and Sustainability.
- Porse, Erik, Madelyn Glickfeld, Keith Mertan, and Stephanie Pincetl. 2015 August. “Pumping for the Masses: Evolution of Groundwater Management in Metropolitan Los Angeles.” GeoJournal, https://doi.org/10.1007/s10708-015-9664-0.
- Porse, Erik, Caitlyn Leo, Erick Eschker, Harold Leverenz, Jonathan Kaplan, John Johnston, Dakota Keene, and David Babchanik. 2023 February. “Adapting Wastewater Management Systems in California for Water Conservation and Climate Change.” Sustainable and Resilient Infrastructure, 1–14. https://doi.org/10.1080/23789689.2023.2180251.
- Porse, Erik, Kathryn B. Mika, Alvar Escriva-Bou, Eric D. Fournier, Kelly T. Sanders, Edward S Spang, Jennifer Stokes-Draut, Felicia Federico, Mark Gold, and Stephanie Pincetl. 2020. “Energy Use for Urban Water Management by Utilities and Households in Los Angeles.” Environmental Research Communications 2 (1): 015003.
- Porse, Erik, Kathryn B. Mika, Mark Gold, Stephanie Pincetl, and William A Blomquist. 2018. “Groundwater Exchange Pools and Urban Water Supply Sustainability.” Journal of Water Resources Planning and Management 144 (3): 04018040.
- Porse, Erik, Kathryn B. Mika, Elizaveta Litvak, Kimberly F. Manago, Terri S. Hogue, Mark Gold, Diane E. Pataki, and Stephanie Pincetl. 2018 May. “The Economic Value of Local Water Supplies in Los Angeles.” Nature Sustainability, https://doi.org/10.1038/s41893-018-0068-2.
- Porse, Erik, Kathryn B. Mika, Elizaveta Litvak, Kimberly Manago, Kartiki Naik, Madelyn Glickfeld, Terri Hogue, Mark Gold, Diane E. Pataki, and Stephanie Pincetl. 2017. “Systems Analysis and Optimization of Local Water Supplies in Los Angeles.” Journal of Water Resources Planning and Management 143 (9).
- Porse, Erik, and Stephanie Pincetl. 2018. “Effects of Stormwater Capture and Use on Urban Streamflows.” Water Resources Management 33 (2): 713–723.
- Roccaro, Paolo. 2018. “Treatment Processes for Municipal Wastewater Reclamation: The Challenges of Emerging Contaminants and Direct Potable Reuse.” Current Opinion in Environmental Science & Health 2 (April): 46–54. https://doi.org/10.1016/j.coesh.2018.02.003.
- Rupiper, Amanda M., MacKenzie S. Guilliams, Micaela M. Bush, Katrina K. Jessoe, and Frank J. Loge. 2021. “Assessing Data Adequacy for Determining Utility-Specific Water Loss Reduction Standards.” Journal of Water Resources Planning and Management 147 (8): 05021011. https://doi.org/10.1061/(ASCE)WR.1943-5452.0001419.
- Sanders, Kelly T. 2016. “The Energy Trade-Offs of Adapting to a Water-Scarce Future: Case Study of Los Angeles.” International Journal of Water Resources Development 32 (3): 362–378. https://doi.org/10.1080/07900627.2015.1095079.
- Schwabe, Kurt, Mehdi Nemati, Refat Amin, Quynh Tran, and David Jassby. 2020. “Unintended Consequences of Water Conservation on the Use of Treated Municipal Wastewater.” Nature Sustainability 3 (8): 628–635. https://doi.org/10.1038/s41893-020-0529-2.
- Sedlak, David L. 2014. Water 4.0: The Past, Present, and Future of the World’s Most Vital Resource. New Haven, CT: Yale University Press.
- Snyder, Shane A., Paul Westerhoff, Yeomin Yoon, and David L. Sedlak. 2003. “Pharmaceuticals, Personal Care Products, and Endocrine Disruptors in Water: Implications for the Water Industry.” Environmental Engineering Science 20 (5): 449–469. https://doi.org/10.1089/109287503768335931.
- Sokolow, Sharona, Hilary Godwin, and Brian L. Cole. 2016. “Impacts of Urban Water Conservation Strategies on Energy, Greenhouse Gas Emissions, and Health: Southern California as a Case Study.” American Journal of Public Health 106 (5): 941–948. https://doi.org/10.2105/AJPH.2016.303053.
- Soller, Jeffrey A., Sorina E. Eftim, and Sharon P. Nappier. 2018. “Direct Potable Reuse Microbial Risk Assessment Methodology: Sensitivity Analysis and Application to State Log Credit Allocations.” Water Research 128 (January): 286–292. https://doi.org/10.1016/j.watres.2017.10.034.
- Spang, Edward S, Andrew J Holguin, and Frank J Loge. 2018. “The Estimated Impact of California’s Urban Water Conservation Mandate on Electricity Consumption and Greenhouse Gas Emissions.” Environmental Research Letters 13 (1): 014016. https://doi.org/10.1088/1748-9326/aa9b89.
- Stokes-Draut, Jennifer, Michael Taptich, Olga Kavvada, and Arpad Horvath. 2017. “Evaluating the Electricity Intensity of Evolving Water Supply Mixes: The Case of California’s Water Network.” Environmental Research Letters 12 (11): 114005. https://doi.org/10.1088/1748-9326/aa8c86.
- Swain, D. L., D. E. Horton, D. Singh, and N. S. Diffenbaugh. 2016. “Trends in Atmospheric Patterns Conducive to Seasonal Precipitation and Temperature Extremes in California.” Science Advances 2 (4): e1501344–e1501344. https://doi.org/10.1126/sciadv.1501344.
- SWRCB. 2016. Investigation on the Feasibility of Developing Uniform Water Recycling Criteria for Direct Potable Reuse: Report to the Legislature. Sacramento, CA: California State Water Resources Control Board.
- SWRCB. 2018. A Proposed Framework for Regulating Direct Potable Reuse in California. Sacramento, CA: California State Water Resources Control Board.
- Tarr, Joel. 1984. “The Evolution of the Urban Infrastructure in the Nineteenth and Twentieth Centuries.” In Perspectives on Urban Infrastructure. Committee on National Urban Policy, National Research Council. Washington, D.C.: National Academies Press.
- Tchobanoglous, George, Harold Leverenz, M. H. Nellor, and J. Crook. 2011. Direct Potable Reuse: A Path Forward. Washington, D.C.: WaterReuse Research and WaterReuse California.
- Tran, Quynh K., David Jassby, and Kurt A. Schwabe. 2017. “The Implications of Drought and Water Conservation on the Reuse of Municipal Wastewater: Recognizing Impacts and Identifying Mitigation Possibilities.” Water Research 124 (November): 472–481. https://doi.org/10.1016/j.watres.2017.07.069.
- ULARA Watermaster. 2013. 2011-12 Annual Report: Upper Los Angeles River Area Watermaster.
- USBR and LACDPW. 2016. Los Angeles Basin Study: The Future of Stormwater Conservation. Task 6- Trade-Off Analysis & Opportunities. Los Angeles County: U.S. Bureau of Reclamation, LA County Department of Public Works.
- WateReuse California. 2019. Potable Use Projects. Sacramento, CA: WateRese California. https://watereuse.org/wp-content/uploads/2020/02/Potable-Reuse-Map-1-14-2020-1.pdf.
- Wilcox, Jonathan, Fuzhan Nasiri, Sarah Bell, and Md. Saifur Rahaman. 2016. “Urban Water Reuse: A Triple Bottom Line Assessment Framework and Review.” Sustainable Cities and Society 27 (November): 448–456. https://doi.org/10.1016/j.scs.2016.06.021.
- Wilkinson, Robert, Gary Wolff, and Rachel Shwom. 2006. “An Analysis of the Energy Intensity of Water in California: Providing a Basis for Quantification of Energy Savings from Water System Improvements.”