
 ?Mathematical formulae have been encoded as MathML and are displayed in this HTML version using MathJax in order to improve their display. Uncheck the box to turn MathJax off. This feature requires Javascript. Click on a formula to zoom.
ABSTRACT
Falling Weight Deflectometry (FWD) tests are performed around the centres of two rectangular concrete plates, with geophones measuring vertical deflections in eight directions. Experimental results allow for quantifying asymmetries regarding the structural behaviour. Significant asymmetries are found for a 22-year-old plate scheduled for replacement. A new plate, tested a few weeks after production, is found to behave in a virtually double-symmetric fashion. Structural analysis of the new plate is based on Kirchhoff–Love plate theory, using free-edge boundary conditions. The support of the plate is provided by a Winkler foundation. Performing a static analysis, the uniform modulus of subgrade reaction is optimised to reproduce the measured deflections. The result is not convincing. The model is extended towards consideration of a second optimisation variable: a uniform auxiliary surface load. This allows for reproducing the measured deflections. The auxiliary load is superimposed with the pressure resulting from the Winkler foundation. This yields a realistic distribution of subgrade pressure. Dividing it by the deflections results in the distribution of the effective modulus of subgrade reaction. Finally, the analysis is extended towards the consideration of inertia forces. They increase the effective moduli of subgrade reaction determined by means of static analysis by less than 3.5%.
1. Introduction
Falling Weight Deflectometry (FWD) allows for quantifying and evaluating the state of concrete roads and of the subgrade beneath them. A FWD test consists of dropping a standardised mass (= ‘falling weight’) from a defined height onto a load plate placed on top of the pavement's surface. During the impact, displacement sensors (= ‘geophones’) capture the deflection history of several points at the surface of the pavement, along one specific radial direction, typically the driving direction. The measured deflections are the basis for back-calculating stiffness properties of the pavement plate and of the layers of the subgrade underneath. The present paper is focused on centric FWD tests on pavement plates made of concrete.
The evaluation of an FWD test is an inverse problem. Properties of the subgrade are back-calculated such as to obtain deflections agreeing with the ones by the displacement sensors. Back-calculation may be performed in a dynamic (Khazanovich Citation2000; Sawant Citation2009) or quasi-static context. The evaluation of centric FWD tests is typically performed under the assumption that the deflection of the pavement is radially symmetric with respect to the centre of the impact. Several types of structural models are used, including plates resting on elastic foundations (Winkler Citation1867; Biot Citation1937; Vesić Citation1961), multi-layered plates on top of a Winkler foundation (Girija Vallabhan et al. Citation1991) and continuum mechanics of multi-layered solids (Kausel and Roësset Citation1981; Pan Citation1989a, Citation1989b; Rahim and George Citation2003; Abd El-Raof et al. Citation2018). In the latter context, the modulus of elasticity and/or the thickness of each individual layer of the subgrade is back-calculated. A variety of methods are used for the simulation of the structural problem, including axisymmetric Finite Element models accounting for either elastic (Loizos and Scarpas Citation2005; Wang and Li Citation2016) or viscoelastic (Li et al. Citation2017) material behaviour, artificial neural networks and genetic algorithms, again accounting either for elastic (Sharma and Das Citation2008; Li and Wang Citation2019) or viscoelastic (Varma et al. Citation2013) material behaviour, hybrid neural network structures (Han et al. Citation2021) and other methods (Goktepe et al. Citation2006; Levenberg Citation2013). Despite their wide use, it has been noted (Mehta and Roque Citation2003) that the inverse problem is mathematically ‘ill-posed’, because different structures consisting of layers with different combinations of modulus of elasticity and thickness result under the same loading in the same deflection field. This underlines that the inverse problem has multiple solutions rather than a unique one. Thus expert knowledge, experience and care are needed when using back-calculation procedures.
The present study is inspired by inverse calculations performed in the New Austrian Tunnelling method (Rabcewicz Citation1965), where cylindrical shotcrete tunnel shells are monitored by means of measuring three-dimensional displacement vectors of ‘measurement points’ in ‘measurement cross-sections’ (Schubert and Lauffer Citation2012). Back-calculations are aimed at computing the stresses in the lining and comparing them with the current strength of the material (Hellmich et al. Citation2001) as well as computing the spatial distributions of ground pressure and shear exerted from the ground mass onto the inaccessible outer surface of the shotcrete shell (Ullah et al. Citation2013). Following these lines, a multi-directional mode of centric FWD tests is proposed in the present paper. The deflections captured by the displacement sensors are used to compute the distribution of (i) the pressure exerted from the subgrade onto the inaccessible bottom surface of the pavement plate and (ii) the effective modulus of subgrade reaction. The tool for structural analysis is a Kirchhoff–Love plate resting on a Winkler foundation. Herein, a series solution derived in the framework of the Principle of Virtual Power (Germain Citation1972) is used, see the amendment by Höller et al. of Vlasov's approach (Vlasov Citation1966; Höller et al. Citation2019).
A Winkler foundation summarises the properties of the whole subgrade by one value: the modulus of subgrade reaction (Winkler Citation1867). The influence of different absolute values of the modulus of subgrade reaction on the stresses and deflections of short-panelled concrete plates subjected to traffic loads was studied by means of the Finite Element method by Gupta (Citation2021). The modulus of subgrade reaction, however, is a structural rather than a material property (Aristorenas and Gómez Citation2014), and the assumption of a spatially uniform modulus of subgrade reaction may lead to unrealistic results (Smith Citation1970; Eisenberger Citation1990; Daloglu and Vallabhan Citation2000; Larkela et al. Citation2013). As a remedy, non-uniform distributions of the modulus of subgrade reaction were introduced, e.g. in the context of the analysis of concrete slabs (Roesler et al. Citation2016) and of vibrations of thin circular plates (Foyouzat et al. Citation2016). In the present paper, a method is developed which allows for the determination of a realistic distribution of the modulus of subgrade reaction for centric FWD tests on concrete pavements. The method is essentially based on the quantification of a realistic distribution of the pressure exerted from the subgrade onto the inaccessible bottom surface of the pavement plate. Such a pressure distribution is realistic, provided that (i) it is in equilibrium with the dead load of the plate and the falling weight, (ii) the deflections of the plate agree well with the measurements from multi-directional FWD testing and (iii) the field equation of Kirchhoff–Love theory as well as the boundary conditions of the plate are satisfied.
In this study, centric FWD tests are performed along eight different radial directions (Section 2). Such a novel multi-directional testing scheme provides insight into possible asymmetries of the structural behaviour of the characterised plate and its subgrade. The proposed test protocol is applied to two plates: a new one that had never been exposed to regular traffic loads and an old plate already scheduled for replacement. The new plate had been installed only a few weeks before testing. Merely site traffic had potentially passed over it. The old plate had been in service for 22 years. The leftmost 1.05 m were part of the first lane; the rest was part of the emergency lane. Thus service loads were running mainly along the left edge of the plate, resulting is localised degradation of the subgrade. Based on the results of multi-directional FWD testing, an index value is proposed, which quantifies the level of asymmetry of the structural behaviour. As for the virtually double-symmetric behaviour of the new plate, structural analysis is performed with the aim to quantify a realistic distribution of the pressure exerted by the subgrade onto the plate (Section 3). At first, it is confirmed that a spatially uniform modulus of subgrade reaction is unsuitable to explain the multi-directional deflection measurements. Therefore, the structural model is extended towards consideration of an auxiliary surface load. The extended model is capable of reproducing the multi-directional deflection measurements. It allows for computing a realistic distribution of the subgrade pressure and of the modulus of subgrade reaction, with and without accounting for inertia forces resulting from the dynamic nature of FWD testing. The present paper ends with conclusion drawn from the results of the presented study (Section 4).
2. Multi-directional FWD testing
FWD tests were performed on two concrete plates of the Austrian highway ‘A1’, near the junction ‘Steinhäusl’, in Lower Austria. The geometric dimensions of the tested plates amounted to , the maximum force produced by the falling weight to
and the measurement frequency of the geophones to
, see .
Table 1. Properties of the plates and of the equipment used.
Both tested plates were located at the right side of the highway. The rightmost were part of the emergency lane, the leftmost
were part of the first lane, with the traffic line of
in between. Along three edges, the tested plates were connected by means of steel bars to their neighbours: the left edge (tie bars) and the two edges orthogonal to the driving direction (dowels). The right lateral surfaces of the plates were free edges.
2.1. Test protocol
Multi-directional FWD testing was carried out in eight directions described by a local cardinal directional system, with N referring to the driving direction (). Because of structural constraints of the FWD machine, the angles between neighbouring directions amounted to either 38 or 52
(), rather than to 45
, see also . FWD testing started in the N direction and continued clockwise: NE, E, SE, S, SW, W and NW. As for every specific direction, three tests were carried out, one right after the other, in order to capture data that allow for assessing the quality of test repeatability. After three tests in each of the eight directions, another set of three tests was carried out in the N direction. In other words, the first three tests and the last three tests referred to the driving direction. These in total six tests allow for checking whether or not the same results are obtained at the start and at the end of multi-directional FWD testing.
Figure 1. Novel multi-directional arrangement of the FWD measurements described by a local cardinal directional system, with N referring to the driving direction.
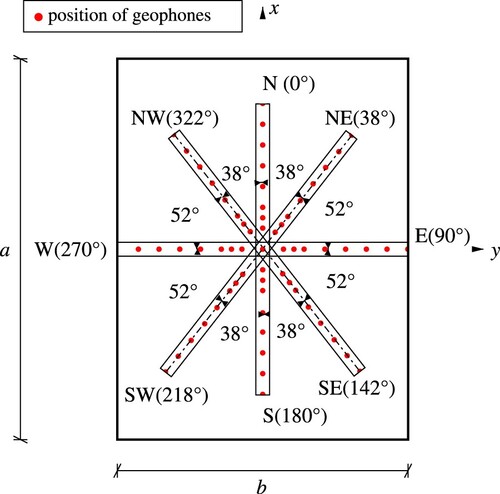
Table 2. Polar angle as a function of the measurement direction.
Nine geophones recorded the deflection histories during every single FWD test (). Geophone 1 was always located at the centre of the falling weight experiments. The other eight geophones were fixed to a bar, ensuring that the radial distances between them were always the same. As for the tests in the N, NE, E, S, W and NW directions, the distance of the geophone-bar to the centre of the falling weight was equal to the default value of the used machine (). As for the tests in the SE and SW directions, the geophone-bar had to be positioned 15 cm further away from the centre (), again because of structural constraints of the FWD machine. When testing in the W direction, the outermost geophone was located at the neighbouring plate. The respective data are excluded from the present analysis, because explicit consideration of the interaction of neighbouring plates is beyond the scope of this work.
Figure 2. Multi-directional FWD testing: (a) experiment with geophones positioned in the SE direction and (b) load plate through which the falling weight was transferred to the pavement.
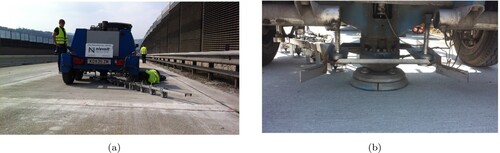
Table 3. Radial distances [m] of nine geophones from the axis of impact, as a function of the measurement direction: d=1 (N), d=2 (NE), d=3 (E), d=4 (SE), d=5 (S), d=6 (SW), d=7 (W), d=8 (NW).
2.2. Experimental data from the new plate
The first test location referred to a concrete pavement plate at the kilometre 33.360 of the highway ‘A1’. The tested plate was only a few weeks old at the time of testing. Before that, only site traffic had potentially passed over the plate.
The deflections recorded by the geophones are bell-shaped functions of time, see . The duration of the dynamic behaviour of the plate amounted to some 30 ms. This period of time is resolved by some 300 readings of the geophones, noting the measurement frequency of 10 kHz. A total of 27 individual FWD tests were carried out within 45 min, given that three tests were performed in every direction and that the N direction was measured twice. A total of 240 individual displacement histories were recorded, since 9 geophones documented every single test, except for the W direction where only 8 geophones were positioned on the plate of interest, see above. The corresponding 240 displacement maxima ( in Appendix 1) are illustrated in .
Figure 3. Results from the first out of 27 FWD tests of the new plate: deflections measured as a function of time by the nine geophones along the N direction.
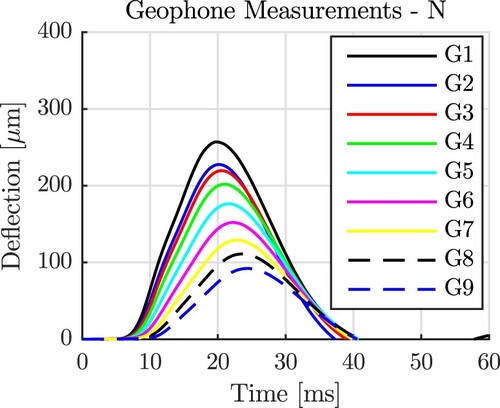
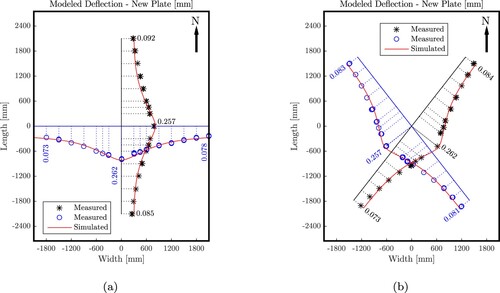
Figure 4. Results from multi-directional FWD testing on the new plate: 240 deflection maxima measured by the geophones along the (a) N, S, E and W directions, as well as (b) the diagonal directions; the lines refer to splines interpolating between the average deflections measured at each location, see Equation (Equation1(1)
(1) ).
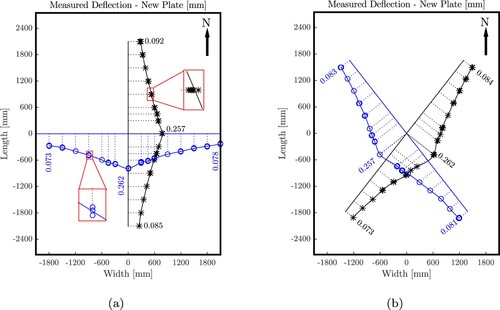
The circle and star symbols in refer to the described 240 displacement maxima. Because the three to six measurements at every location resulted in virtually the same results, the corresponding three to six symbols are hardly distinguishable. The solid lines in are splines interpolating between the average deflection maxima measured at each location. Using index d for measurement irections, with
,
, …,
, index g for the
eophones and index i for the ith test in direction d, the average values are computed as
(1)
(1) where
stands for the number of tests performed in direction d. As for , results from all six tests in the N direction are included, resulting in
. For the other seven measurement directions,
. Test repeatability is studied statistically based on coefficients of variation (= mean values divided by standard deviations):
(2)
(2) The standard deviations read as
(3)
(3) In order to quantify the quality of repeatability regarding all sets of three nominally identical tests, carried out immediately one after the other in the same direction, Equations (Equation1
(1)
(1) )–(Equation3
(3)
(3) ) are evaluated for all of the nine sets of three tests, and for each one of the nine geophones (except for the W direction, where only eight geophones were positioned at the plate of interest), see . The obtained 80 coefficients of variation are smaller than 5%. This indicates a satisfactory level of test repeatability.
In order to quantify the quality of repeatability regarding the first set of three tests in the N direction, performed at the start of multi-directional testing, and the second set of three tests in the same direction, performed at the end of multi-directional testing, these six tests are evaluated as one statistical sample (). The obtained coefficients of variation are smaller than 2%, see . This indicates a very satisfactory level of test repeatability.
2.3. Experimental data from the old plate
The second test location referred to a concrete pavement plate at the kilometre 33.354 of the highway ‘A1’. The tested plate was 22 years old at the time of testing. It was scheduled to be replaced shortly after the multi-directional FWD testing. The traffic had mainly passed along the Western edge of the plate, because the leftmost of the width of the plate were part of the first lane.
The deflections recorded by the geophones are bell-shaped functions of time, see . The dynamic behaviour of the plate lasted for some 30 ms, resolved by some 300 readings of the geophones. 27 individual FWD tests were carried out within 45 min, leading to a total of 240 individual displacement histories. The corresponding 240 displacement maxima ( in Appendix 2) are illustrated in .
Figure 5. Results from the first out of 27 FWD tests of the old plate: deflections measured as a function of time by the nine geophones along the N direction.
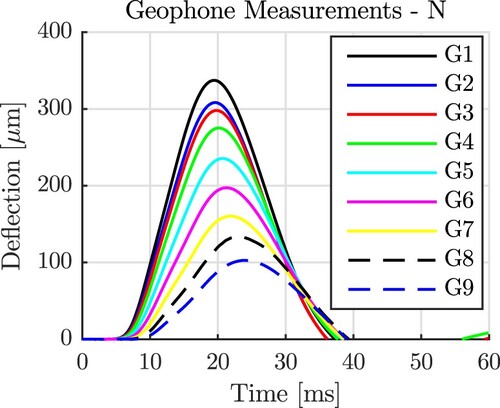
Figure 6. Results from multi-directional FWD testing on the old plate: 240 deflection maxima measured by the geophones along the (a) N, S, E and W directions, as well as (b) the diagonal directions; the lines refer to splines interpolating between the average deflections measured at each location, see Equation (Equation1(1)
(1) ).
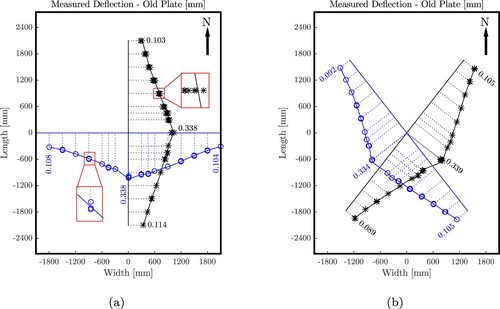
The circle and star symbols in refer to the described 240 displacement maxima. Because the three to six measurements at every location resulted in virtually the same results, the corresponding three to six symbols are hardly distinguishable. The solid lines in are splines interpolating between the average deflection maxima measured at each location, computed based on Equation (Equation1(1)
(1) ) with
and
otherwise.
In order to quantify the quality of repeatability regarding all sets of three nominally identical tests, carried out immediately one after the other in the same direction, Equations (Equation1(1)
(1) )–(Equation3
(3)
(3) ) are evaluated for all of the nine sets of three tests, and for each one of the nine geophones (except for the W direction, where only eight geophones were positioned at the plate of interest), see . The obtained 80 coefficients of variation are smaller than 3%. This indicates a satisfactory level of test repeatability.
In order to quantify the quality of repeatability regarding the initial set of three tests and the final set of three tests in the N direction, these six tests are evaluated as one statistical sample (). The obtained coefficients of variation are smaller than 6%, see . This indicates an acceptable level of test repeatability.
2.4. Asymmetries of the structural behaviour of the tested plates
Results from multi-directional FWD experiments ( and ) are used to assess asymmetries of the structural behaviour of the tested plates. As regards the new plate, asymmetries may result from the dowels and tie bars connecting it to its neighbours in the N, S and W directions. As for the old plate, asymmetries may also result from long-term service loads from traffic running mainly along the Western edge.
The development of a suitable index for the quantification of the asymmetry of the structural behaviour is based on the discussion of possible symmetries of the new plate.
If the dowels and tie bars influenced the structural behaviour of the new plate, its deflections could be expected to be virtually symmetric with respect to the E–W axis running through the centre of the plate. The deflections would be virtually symmetric in the N and S, the NE and SE as well as the SW and NW directions.
If the dowels and tie bars had no significant influence on the structural behaviour of the new plate, its deflections could be expected to be virtually double-symmetric with respect to the E–W and N–S axes running through the centre of the plate. Not only the deflections discussed after the first bullet point would be virtually the same but also those in the E and W, the NE and NW, the SW and SE, the NE and SW as well as the NW and SE directions.
The described symmetries are checked based on the deflections illustrated in and . The spline in d direction is referred to as , where
denotes the radial coordinate. The level of asymmetry of the deflections in the d and δ directions is quantified based on the squared differences of the related splines, normalised with respect to their maximum values at the centre of the impact (r=0):
(4)
(4) If the deflections in the d and δ directions are identical,
is equal to zero. Thus the larger
, the larger is the asymmetry of the deflections in the d and δ directions. The asymmetry indicators
,
,
,
,
and
, evaluated both for the new and old plates, are listed in .
Table 6. Asymmetry indicators for both plates, computed according to Equation (Equation4(4)
(4) ).
As for the new plate, the eight asymmetry indicators are on average equal to . The mean value of the first three asymmetry indicators is slightly smaller than that of the last five indicators, see . This underlines that the plate behaved virtually in a double symmetric fashion and that the dowels and tie bars connecting the new plate to its neighbours in the N, S and W directions had no significant influence on the structural behaviour during FWD testing at the centre of the plate. Consequently, a structural analysis of the FWD tests on the new plate can be based on free-edge boundary conditions, see Section 3.
As for the old plate, the eight asymmetry indicators are on average equal to . Thus the asymmetry of the old plate is by a factor of 2.37 larger than that of the new plate. The largest values of the asymmetry indicators of the old plate are ≥12% and refer to the E–W and NE–SE axes. From these results, it is concluded that the old plate behaved in a significantly asymmetric fashion, because of its long-term service with traffic running mainly along its Western edge. If the plate had not already been scheduled for replacement, the asymmetry indicators evaluated herein would suggest such a necessity for repair.
The index defined in Equation (Equation4(4)
(4) ) is appealing, because it allows for direct comparison of FWD tests in which deflections were measured at different distances from the centre of the falling weight. In order to corroborate the expressiveness of the index, hypothesis testing is used.
2.5. Revisiting symmetry of the plate behaviour based on hypothesis testing
Statistical hypothesis testing (Lehmann and Romano Citation2006) is based on the comparison of deflection maxima measured at the same distances to the centre of the falling weight, but in different directions, see . As regards the symmetry with respect to the E–W axis, the comparison regards deflections measured along the N and S directions. As regards the symmetry with respect to the N–S axis, the comparison regards deflections measured along the E and W directions, the NE and NW directions as well as the SE and SW directions.
Inspired by the approach of Abd El-Raof et al. (Citation2018), mean values of deflection maxima measured in one direction are plotted over corresponding mean values referring to the other direction, see, e.g. . If the structure behaved in an asymmetric fashion, see (b), then the individual points lie in a considerable distance to the identity line. However, if the structure behaved in a virtually symmetric fashion, see (a), then the individual points fall very close to the identity line. The latter passes through the origin of the graph and has a slope which is equal to 1. This is the motivation to fit the data points by the best linear regression function which passes through the origin. Accordingly, the following null hypotheses are written:
The slope of the linear regression function is one:
(5)
The mean difference between the measurements in both directions is equal to zero (paired difference test following a Student's t-distribution):
Figure 7. Comparison between the mean of the deflection maxima measured at each geophone (a) on the new plate along the SE direction () and the SW direction (
), see also , and (b) on the old plate along the E direction (
) and the W direction (
), see also .
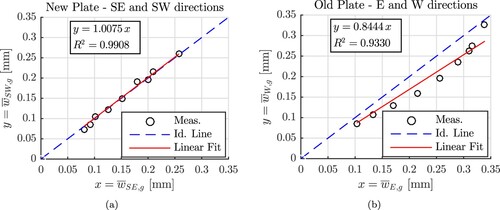
Table 8. Results obtained from testing whether or not the old plate behaved in a symmetric fashion, based on the hypotheses (Equation5(5)
(5) ) and (Equation6
(6)
(6) ); the p-values indicate virtually symmetric behaviour in the N–S direction, and asymmetric behaviour in the E–W, NE–NW and SE–SW directions.
Statistical significance is assumed if the observed measurements lie outside of a 99% confidence interval, i.e. the hypotheses are rejected if p<0.01. This value ensures a small probability of so-called Type I errors referred to as ‘false positives’ (Lehmann and Romano Citation2006). The rejection of any one of the two hypotheses suggests that the structure behaved asymmetrically with respect to the investigated axis.
As for the new plate, the hypotheses of symmetric structural behaviour cannot be rejected, as indicated by values of p which are larger than 0.01 in all cases, see . The assumption of symmetric behaviour has survived eight serious attempts of falsification. According to Popper (Citation1962), this corroborates that the new plate indeed behaved in a virtually double-symmetric fashion.
As for the old plate, the hypotheses of symmetric structural behaviour with respect to the E–W axis cannot be rejected, see the values of p for and
in . The hypotheses of symmetric structural behaviour with respect to the N–S axis, however, are rejected, see the values of p for
,
,
,
,
and
in . These results emphasise that the old plate behaved in an asymmetric fashion with respect to the N–S axis.
In order to assess the expressiveness of the proposed symmetry index, see Equation (Equation4(4)
(4) ), values of the index listed in are compared with results from statistical hypothesis testing, see and . All pairs of measurement directions, which were qualified by statistical hypothesis testing as to refer to symmetric structural behaviour, have values of the index smaller 5%. Vice versa, all pairs of measurement directions, which were qualified by statistical hypothesis testing as to refer to asymmetric structural behaviour, have values of the index larger than 7%. It is concluded that statistical hypothesis testing has corroborated the expressiveness of the symmetry index of Equation (Equation4
(4)
(4) ).
3. Structural analysis of the new plate
The virtually double-symmetric behaviour of the new plate is studied based on Kirchhoff–Love linear theory of thin plates. A Cartesian coordinate system is used, with the x-axis oriented in the driving direction, see .
The boundary value problem consists of one field equation and boundary conditions. The field equation reads as (Vlasov Citation1966)
(7)
(7) where
denotes the flexural stiffness of the plate, E the modulus of elasticity of concrete, ν its Poisson's ratio and ρ its mass density, see . Furthermore,
denotes the deflection of the plate,
its external vertical load per area and k the modulus of subgrade reaction. As for the boundary conditions, all four lateral edges of the rectangular plate are stress-free boundaries (= ‘free edges’). Denoting components of Cauchy's stress tensor as
with
, the boundary conditions at
read as (Vlasov Citation1966; Höller et al. Citation2019)
(8)
(8)
(9)
(9)
(10)
(10) and at
as (Vlasov Citation1966; Höller et al. Citation2019)
(11)
(11)
(12)
(12)
(13)
(13) where
and
stand for bending moments per length,
for twisting moments per length and
and
for shear forces per length.
The deflection field is computed based on the amendment by Höller et al. (Citation2019) of Vlasov's approach (Vlasov Citation1966). In more detail: based on the Principle of Virtual Power (Germain Citation1972), a series solution is obtained from the following weak formulation of the field equation (Equation7
(7)
(7) ) and the boundary conditions (Equation8
(8)
(8) )–(Equation13
(13)
(13) ):
(14)
(14) where
stands for the virtual velocities. As for the deflections
, an ansatz is made. It consists of a Fourier series of double-symmetric deflection modes:
(15)
(15) The number of unknown Fourier coefficients
is equal to the number of deflection modes and amounts to
for
. A system of algebraic equations for these coefficients is obtained by choosing an approach similar to Equation (Equation15
(15)
(15) ) also for the virtual velocities, see (Höller et al. Citation2019) for details. In the sequel, N in Equation (Equation15
(15)
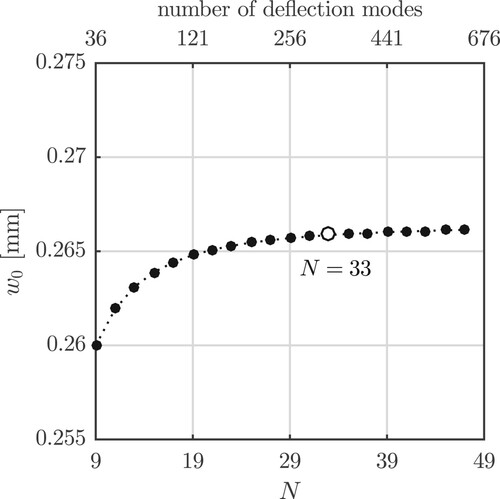
(15) ) is set equal to 33, resulting in 324 Fourier coefficients. This yields a well-converged solution in terms of displacements, see the related convergence analysis in Appendix 3.
The structural analysis is focused on the time instant at which the falling weight produces the maximum force. The corresponding external loading of the plate reads as
(16)
(16) with
denoting the radius of the load plate through which the dynamic force was introduced into the pavement, see (b).
The term in Equations (Equation7
(7)
(7) ) and (Equation14
(14)
(14) ) denotes inertia forces per area. Their importance will be quantified in Section 3.4. Before that, static structural analyses are performed, i.e. the inertia forces are set equal to zero.
3.1. Static structural analysis: identification of the modulus of subgrade reaction
The modulus of subgrade reaction k is optimised in the interval , in order to reproduce the measured deflections in the best possible fashion. The residual differences between measured deflections and corresponding simulation results are quantified based on the following square-root of sum of squared errors:
(17)
(17) with
and
otherwise. The Cartesian coordinates of the positions of the geophones follow from their radial distances
and polar angles
as
and
, see and .
yields the best reproduction of the measured deflections, see . The residual error according to Equation (Equation17
(17)
(17) ) amounts to
. The agreement between the computed and measured deflections is not convincing, see . It is concluded that a uniform modulus of subgrade reaction cannot explain the measured deflections in a satisfactory fashion. This calls for an extension of the structural model.
Figure 8. Static structural analysis of the new plate: results of the optimisation of the value of the modulus of subgrade reaction: square-root of sum of squared errors between measured deflections and corresponding simulation results, quantified according to Equation (Equation17(17)
(17) ).
![Figure 8. Static structural analysis of the new plate: results of the optimisation of the value of the modulus of subgrade reaction: square-root of sum of squared errors between measured deflections and corresponding simulation results, quantified according to Equation (Equation17(17) SRSSE=171∑d=18∑g=1md[w¯d,g−w(xd,g,yd,g)]2,(17) ).](/cms/asset/7d801382-1e6d-4db2-ad63-0c38e3b5fb85/gpav_a_2006651_f0008_oc.jpg)
Figure 9. Static structural analysis of the new plate: results of the optimisation of the value of the modulus of subgrade reaction: measured deflections (points) and corresponding simulations results (lines) obtained with the optimal value of k amounting to .
3.2. Static structural analysis: extension towards consideration of an auxiliary surface load
In order to increase the quality of reproducing the measured deflections, a uniform auxiliary load is introduced at the top surface of the plate. Thus Equation (Equation16(16)
(16) ) is replaced by
(18)
(18) The values of the modulus of subgrade reaction and of the auxiliary load are optimised within the intervals
and
. The values
and
allow for reproducing the measured deflections in the best-possible fashion, see . The residual error according to Equation (Equation17
(17)
(17) ) amounts to
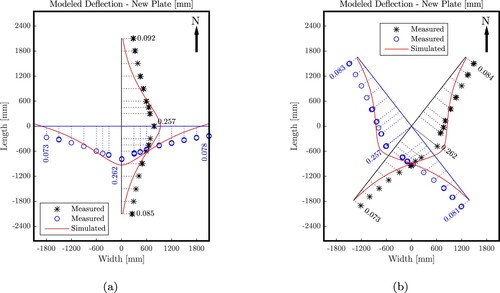
. The agreement between the computed and measured deflections is both qualitatively and quantitatively satisfactory, see . It is concluded that the consideration of a uniform auxiliary surface load, together with a uniform modulus of subgrade reaction, does allow for explaining the measured deflections in a satisfactory fashion.
Figure 10. Static structural analysis of the new plate: results of the optimisation of the values of the uniform modulus of subgrade reaction and of the auxiliary surface load: square-root of sum of squared errors between measured deflections and corresponding simulation results, quantified according to Equation (Equation17(17)
(17) ).
![Figure 10. Static structural analysis of the new plate: results of the optimisation of the values of the uniform modulus of subgrade reaction and of the auxiliary surface load: square-root of sum of squared errors between measured deflections and corresponding simulation results, quantified according to Equation (Equation17(17) SRSSE=171∑d=18∑g=1md[w¯d,g−w(xd,g,yd,g)]2,(17) ).](/cms/asset/bf73a3db-397c-4346-b13e-89933d0f5ab2/gpav_a_2006651_f0010_oc.jpg)
Figure 11. Static structural analysis of the new plate: results of the optimisation of the values of the uniform modulus of subgrade reaction and of the auxiliary surface load: measured deflections (points) and corresponding simulations results (lines) obtained with and
, see also Equation (15) and Table A6.
It remains to be shown that the auxiliary load results in an effective modulus of subgrade reaction which is spatially distributed rather than being uniform. To this end, the plate is conceptually cut free from the Winkler foundation. In this configuration, three types of compressive normal stresses are acting on the horizontal surfaces of the plate.
The pressure from the falling weight acts onto the top-surface of the plate, as described by Equation (Equation16
The pressure resulting from the springs of the Winkler foundation acts onto the bottom-surface of the plate. It reads as:
The auxiliary pressure
However, a pressure acting onto the top-surface of a plate is equivalent to tensile loading with the same absolute value, acting onto the bottom-surface of the plate. This way, the auxiliary loading is conceptually moved from the top to the bottom of the plate. There, it is superimposed with the stresses resulting from the springs of the Winkler foundation, see the second bullet point. The resulting pressure distribution at the bottom surface reads as . This is a realistic distribution of the pressure exerted from the subgrade onto the bottom-surface of the plate, because it is in equilibrium with the falling weight, and the corresponding deflection field
satisfies the plate's field equation and boundary conditions, while reproducing the measurements in an accurate fashion.
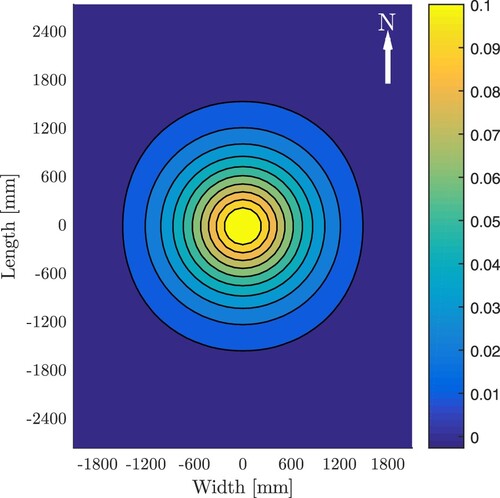
3.3. Static structural analysis: effective modulus of subgrade reaction
The effective modulus of subgrade reaction is equal to the effective pressure at the bottom of the plate, divided by the effective deflection field
:
(19)
(19) The load-case superposition principle applies to both the subgrade pressure and to the deflections, see the numerator and the denominator on the right-hand-side of Equation (Equation19
(19)
(19) ), but not to the effective modulus of subgrade reaction, because
is inversely proportional to
. Thus Equation (Equation19
(19)
(19) ) must be evaluated for the total load case consisting of the dead load of the plate and the falling weight.
The dead load represents a uniform external vertical load amounting to , where
denotes the gravitational acceleration. The corresponding subgrade pressure is equally large, in order to balance the external loading. The deflection resulting from the dead load,
is equal to the subgrade pressure divided by the modulus of subgrade reaction, i.e.
. Since the value of the modulus of subgrade reaction is uncertain, a sensitivity analysis is performed in the interval
, see . The chosen interval was defined in accordance with existing studies (Nielson et al. Citation1969; Murthy Citation2011; Ping and Sheng Citation2011; Putri et al. Citation2012; Martin et al. Citation2016).
Table 9. Sensitivity analysis regarding the deflection resulting from the dead load.
Superimposing the load cases ‘dead load’ and ‘falling weight’, both in terms of the effective pressure at the bottom of the plate and in terms of the deflections, yields, after insertion into Equation (Equation19(19)
(19) ):
(20)
(20) The realistic distribution of the effective modulus of subgrade reaction according to Equation (Equation20
(20)
(20) ) is illustrated in . The uncertainty regarding the deflection of the plate resulting from its dead load does not have a significant influence on the distribution of the effective modulus of subgrade reaction. Still, the distribution is markedly non-linear. It is reminiscent of a bell-shaped function.
Figure 12. Results of static structural analysis of the new plate: effective modulus of subgrade reaction, in [MPa/mm], computed according to Equation (Equation20(20)
(20) ) with (a)
and (b)
, see .
![Figure 12. Results of static structural analysis of the new plate: effective modulus of subgrade reaction, in [MPa/mm], computed according to Equation (Equation20(20) keff(x,y)=ρgh+kw(x,y)−pauxwρgh+w(x,y).(20) ) with (a) wρgh=0.026mm and (b) wρgh=0.018mm, see Table 9.](/cms/asset/a0e5bbcd-b31a-40b8-a498-53e9e6695cb9/gpav_a_2006651_f0012_oc.jpg)
The corresponding distribution of the pressure exerted by the subgrade onto the inaccessible bottom surface of the plate reads as: , see . Because the width of the plate differs from its length, the subgrade stresses are double-symmetric with respect to the N–S and E–W axes running through the centre of the plate, rather than radial symmetric. The maximum pressure amounts to
.
Figure 13. Results of static structural analysis of the new plate: distribution of pressure exerted from the subgrade onto the bottom-surface of the plate: , in (MPa).
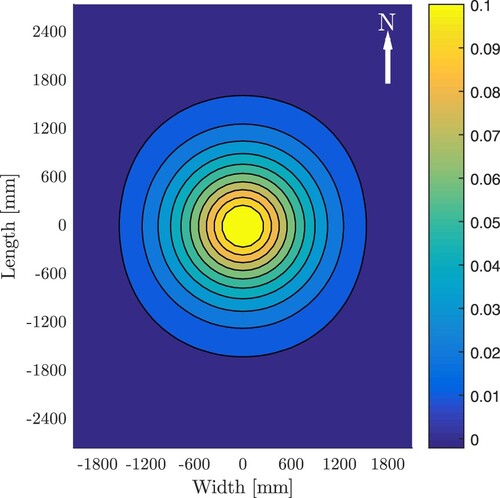
3.4. Dynamic structural analysis: effective modulus of subgrade reaction
It is of interest to quantify the influence of inertia forces on the effective modulus of subgrade reaction. The accelerations
are quantified based on the readings of the geophones, see, e.g. and . To this end, every single deflection history captured by a geophone (see the points in ) is approximated, in the temporal vicinity of the maximum deflection, by means of a best-fitting polynomial, see the line in . Differentiating the polynomial twice with respect to time, and evaluating the result at the time instant of the maximum deflection delivers the sought acceleration. The acceleration is quantified for all of the 240 recordings of the geophones ( in Appendix 1). 240 values of the inertia forces per unit area are computed by multiplying the acceleration values with the mass density of concrete and the thickness of the plate, see the points in . These data are approximated by means of the following bell-shaped function so that a smooth and continuous description of the inertia forces is obtained:
(21)
(21) where α, β and γ are optimisation variables. The optimal values read as
,
and
, see also the lines in . Finally, the expression for the effective modulus of subgrade reaction according to Equation (Equation20
(20)
(20) ) is extended towards consideration of the described field of inertia forces:
(22)
(22) see also . A comparison between the distribution of the modulus of subgrade reaction with and without accounting for inertia forces, compare and , shows that the consideration of inertia forces increases the effective modulus of subgrade reaction by less than 3.5%. Thus if high precision is requested, the consideration of inertia forces is recommended.
Figure 14. Deflection history recorded by a geophone located at the centre of the plate (points) and its approximation based on a polynomial (line), used to quantify the acceleration at the time instant of the maximum deflection.
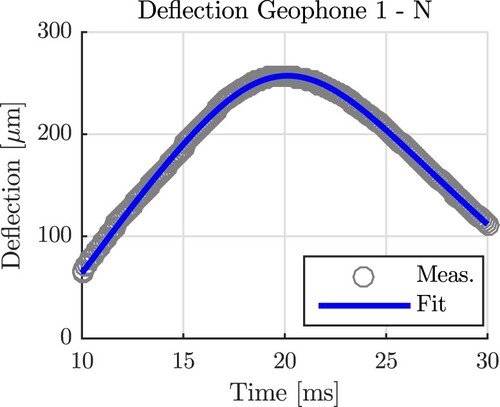
Figure 15. Inertia forces per area of the new plate, referring to the time instants of the maximum deflections, as quantified based on the readings of the geophones, see the points, and approximation based on Equation (Equation21(21)
(21) ), see the lines.
![Figure 15. Inertia forces per area of the new plate, referring to the time instants of the maximum deflections, as quantified based on the readings of the geophones, see the points, and approximation based on Equation (Equation21(21) pdyn(x,y)=αexp[−(xβ)2−(yγ)2],(21) ), see the lines.](/cms/asset/b24d726e-61b6-4abf-990f-4750a7ee856c/gpav_a_2006651_f0015_oc.jpg)
Figure 16. Results of dynamic structural analysis of the new plate: effective modulus of subgrade reaction, in [MPa/mm], computed according to Equation (Equation22(22)
(22) ) with (a)
and (b)
, see .
![Figure 16. Results of dynamic structural analysis of the new plate: effective modulus of subgrade reaction, in [MPa/mm], computed according to Equation (Equation22(22) keff(x,y)=ρgh+kw(x,y)−paux−pdyn(x,y)wρgh+w(x,y),(22) ) with (a) wρgh=0.026mm and (b) wρgh=0.018mm, see Table 9.](/cms/asset/e87c4b99-2452-4638-ae6f-4f9045f2a2b4/gpav_a_2006651_f0016_oc.jpg)
The corresponding distribution of the pressure exerted by the subgrade onto the inaccessible bottom surface of the plate is again double-symmetric and reads as: , see . The maximum pressure amounts to
. This is by
larger than the corresponding result of the static analysis, see above.
Figure 17. Results of dynamic structural analysis of the new plate: distribution of pressure exerted from the subgrade onto the bottom-surface of the plate: , in (MPa).
4. Conclusion
Based on the results from novel multi-directional FWD testing on two concrete plates, the following conclusions are drawn:
Multi-directional FWD testing allows for a more detailed assessment of the state of a plate and of its directional behaviour, as compared to traditional FWD tests which are limited to the driving direction.
Insight into the non-uniform degradation of the subgrade is particularly interesting for plates subjected to long-term non-symmetric loading.
The developed index for quantifying the asymmetry of the structural behaviour, see Equation (Equation4
Statistical hypothesis testing corroborated the expressiveness of the index. Values of the index smaller than 5% refer to virtually symmetric behaviour, values larger than 7% to asymmetric behaviour.
The new plate showed a virtually double-symmetric structural behaviour, although it was connected by means of dowels and tie bars to its neighbours along its Northern, Southern and Western edges, while the Eastern edge was a free boundary. The following conclusions are drawn:
As for multi-directional FWD tests carried out at the centre of a plate, values of the asymmetry index amounting to less than
Neither the dowels and tie bars nor potential plate-to-plate interaction had a significant influence on the FWD tests on the new plate.
Structural analysis of such FWD tests may be carried out based on the assumption that all four edges are free boundaries.
The old plate showed significantly larger deflections than the new plate. Moreover, significant asymmetries were found. The following conclusions are drawn:
The largest values of the asymmetry index amount to ≥12%. This emphasises that the old plate presents an asymmetric behaviour. If the old plate had not already been scheduled for replacement, the largest asymmetry indicators evaluated herein would suggest such a necessity for repair.
The largest directional asymmetries were found along the E–W and NW–SE axes. These asymmetries underline directional degradation of the subgrade of the plate resulting from long-term exposure to traffic running mainly along the Western edge of the plate.
Based on structural analysis of the new plate, using Kirchhoff–Love plate theory and the amendment by Höller et al. of Vlasov's approach, the following conclusions are drawn:
The assumption of a uniform modulus of subgrade reaction is not realistic enough for reproducing deflections measured during FWD testing, see and . Thus it was confirmed that a multi-layered subgrade behaves in a more complex fashion than described by a Winkler foundation.
Virtually double-symmetric deflections measured during multi-directional FWD testing were reproduced based on a uniform modulus of subgrade reaction and a uniform auxiliary surface load, see and . Thus a structural model based on a Winkler foundation is useful, provided that it is extended towards consideration of the auxiliary surface load.
The inclusion of the auxiliary surface load allows for quantifying a realistic spatial distribution of the modulus of subgrade reaction because the subgrade pressure is in equilibrium with the dead load of the plate and the falling weight, the plate's field equation and free-edge boundary conditions are fulfilled, and the deflections obtained from multi-directional FWD testing are reproduced accurately.
The extension of the presented mode of structural analysis towards consideration of inertia forces resulting from the dynamic nature of an FWD test was shown to be straightforward. The necessary accelerations can be computed simply from the measurements of the geophones.
The dynamic analysis can be focused on inertia forces occurring at the same time as the deflection maxima. A transient mode of simulation is dispensable.
Consideration of inertia forces has led to effective moduli of subgrade reaction which are by some 3.5% larger compared to those derived from static analysis. Thus if high precision is requested, consideration of inertia forces is recommended.
The method for quantification of double-symmetric distributions of the subgrade pressure and of the modulus of subgrade reaction is not limited to multi-directional FWD testing. It is also applicable to the evaluation of centric uni-directional FWD tests, under the assumption of a virtually double-symmetric structural behaviour.
Finally, the following limitations of the study are mentioned:
Multi-directional FWD testing requires more efforts than standard FWD tests. During standard FWD tests, operators usually stay inside their vehicle. Multi-directional FWD testing, in turn, requires hands-on work of the operators in order to position the geophone-bar in specific directions around the falling weight. Thus also safety precautions associated with multi-directional FWD testing must be more elaborate than in the case of standard testing.
Structural analysis was limited to the concrete plate. This allow for quantifying stresses inside the plate and at the interface between the plate and its subgrade. If properties of the individual layers underneath the plate are of interest, a multi-layered analysis is indispensable, such as the ones carried out, e.g.by Pan (Citation1989a, Citation1989b), Kausel and Roësset (Citation1981), Rahim and George (Citation2003) and Abd El-Raof et al. (Citation2018).
Acknowledgments
Help of Pia Mandahus (TU Wien, Vienna, Austria), Marek Milcevic, Roman Oblak and Harald Aigner (Nievelt Labor GmbH, Höbersdorf, Austria) as well as interesting discussions with Wolfgang Kluger-Eigl and Luis Zelaya-Lainez (TU Wien), Martin Peyerl and Gerald Maier (Smart Minerals GmbH, Vienna, Austria) as well as Reinhard Lohmann-Pichler and Karl Gragger (ASFINAG Bau Management GmbH) are gratefully acknowledged.
Disclosure statement
No potential conflict of interest was reported by the author(s).
Additional information
Funding
References
- Abd El-Raof, H.S., et al., 2018. Simplified closed-form procedure for network-level determination of pavement layer moduli from falling weight deflectometer data. Journal of Transportation Engineering, Part B: Pavements, 144 (4), 04018052.
- Aristorenas, G., and Gómez, J., 2014. Subgrade modulus—Revisited. Struct. Mag, 9–11.
- Biot, M.A., 1937. Bending of an infinite beam on an elastic foundation. Journal of Applied Mechanics, 4, A1–A7.
- Daloglu, A.T., and Vallabhan, C.G., 2000. Values of k for slab on Winkler foundation. Journal of Geotechnical and Geoenvironmental Engineering, 126 (5), 463–471.
- Eisenberger, M., 1990. Application of symbolic algebra to the analysis of plates on variable elastic foundation. Journal of Symbolic Computation, 9 (2), 207–213.
- Foyouzat, M., Mofid, M., and Akin, J., 2016. Free vibration of thin circular plates resting on an elastic foundation with a variable modulus. Journal of Engineering Mechanics, 142 (4), 04016007.
- Germain, P., 1972. Sur l'application de la méthode des puissances virtuelles en mécanique des milieux continus ([on the application of the method of virtual power in continuum mechanics)]. Comptes Rendus de l'Académie des Sciences Paris, 274, 1051–1055 (in French).
- Girija Vallabhan, C., Thomas Straughan, W., and Das, Y., 1991. Refined model for analysis of plates on elastic foundations. Journal of Engineering Mechanics, 117 (12), 2830–2843.
- Goktepe, A.B., Agar, E., and Lav, A.H., 2006. Advances in backcalculating the mechanical properties of flexible pavements. Advances in Engineering Software, 37 (7), 421–431.
- Gupta, A., 2021. Analytical investigations on short-paneled concrete pavements using finite element analysis. Iranian Journal of Science and Technology, Transactions of Civil Engineering, 1–16. Available from: https://doi.org/10.1007/s40996-021-00595-x.
- Han, C., et al., 2021. Application of a hybrid neural network structure for FWD backcalculation based on LTPP database. International Journal of Pavement Engineering, 1–14. Available from: https://doi.org/10.1080/10298436.2021.1883016.
- Hellmich, C., Mang, H.A., and Ulm, F.J., 2001. Hybrid method for quantification of stress states in shotcrete tunnel shells: combination of 3d in situ displacement measurements and thermochemoplastic material law. Computers & Structures, 79 (22–25), 2103–2115.
- Höller, R., et al., 2019. Rigorous amendment of Vlasov's theory for thin elastic plates on elastic winkler foundations, based on the principle of virtual power. European Journal of Mechanics – A/Solids, 73, 449–482.
- Kausel, E., and Roësset, J.M., 1981. Stiffness matrices for layered soils. Bulletin of the Seismological Society of America, 71 (6), 1743–1761.
- Khazanovich, L., 2000. Dynamic analysis of FWD test results for rigid pavements. In: E.O. Lukanen, ed. (Committee D04 on Road and Paving Materials) Nondestructive testing of pavements and backcalculation of moduli: Third volume. ASTM International, 398–412. doi:10.1520/STP14780S.
- Larkela, A., Mengelt, M., and Stapelfeldt, T., 2013. Determination of distribution of modulus of subgrade reaction. In: Proceedings of the 18th International Conference on Soil Mechanics and Geotechnical Engineering, French Society for Soil Mechanics and Geotechnical Engineering (CFMS), Paris, France, 1313–1315.
- Lehmann, E.L., and Romano, J.P., 2006. Testing statistical hypotheses. New York: Springer Science & Business Media. doi:10.1007/0-387-27605-X.
- Levenberg, E., 2013. Inverse analysis of viscoelastic pavement properties using data from embedded instrumentation. International Journal for Numerical and Analytical Methods in Geomechanics, 37 (9), 1016–1033.
- Li, M., and Wang, H., 2019. Development of ANN-GA program for backcalculation of pavement moduli under FWD testing with viscoelastic and nonlinear parameters. International Journal of Pavement Engineering, 20 (4), 490–498.
- Li, M., et al., 2017. Finite element modeling and parametric analysis of viscoelastic and nonlinear pavement responses under dynamic FWD loading. Construction and Building Materials, 141, 23–35.
- Loizos, A., and Scarpas, A., 2005. Verification of falling weight deflectometer backanalysis using a dynamic finite elements simulation. International Journal of Pavement Engineering, 6 (2), 115–123.
- Martin, U., et al., 2016. Abschätzung der Untergrundverhältnisse am Bahnkörper anhand des Bettungsmoduls. ETR-Eisenbahntechnische Rundschau, 5, 50–57.
- Mehta, Y., and Roque, R., 2003. Evaluation of FWD data for determination of layer moduli of pavements. Journal of Materials in Civil Engineering, 15 (1), 25–31.
- Murthy, V., 2011. Textbook of soil mechanics and foundation engineering. New Delhi: CBS Publishers & Distributors/Alkem Company (S).
- Nielson, F.D., Bhandhausavee, C., and Yeb, K.S., 1969. Determination of modulus of soil reaction from standard soil tests. Highway Research Record, 284, 1–12.
- Pan, E., 1989a. Static response of a transversely isotropic and layered half-space to general dislocation sources. Physics of the Earth and Planetary Interiors, 58 (2–3), 103–117.
- Pan, E., 1989b. Static response of a transversely isotropic and layered half-space to general surface loads. Physics of the Earth and Planetary Interiors, 54 (3–4), 353–363.
- Ping, W.V., and Sheng, B., 2011. Developing correlation relationship between modulus of subgrade reaction and resilient modulus for Florida subgrade soils. Transportation Research Record, 2232 (1), 95–107.
- Popper, K., 1962. Conjectures and refutations: the growth of scientific knowledge. London: Routledge.
- Putri, E.E., Rao, N., and Mannan, M., 2012. Evaluation of modulus of elasticity and modulus of subgrade reaction of soils using CBR test. Journal of Civil Engineering Research, 2 (1), 34–40.
- Rabcewicz, L.v., 1965. The new Austrian tunnelling method. Water Power, 511–515.
- Rahim, A., and George, K., 2003. Falling weight deflectometer for estimating subgrade elastic moduli. Journal of Transportation Engineering, 129 (1), 100–107.
- Roesler, J.R., et al., 2016. Concrete slab analyses with field-assigned non-uniform support conditions. International Journal of Pavement Engineering, 17 (7), 578–589.
- Sawant, V., 2009. Dynamic analysis of rigid pavement with vehicle–pavement interaction. International Journal of Pavement Engineering, 10 (1), 63–72.
- Schubert, W., and Lauffer, H., 2012. NATM – from a construction method to a system. Geomechanics and Tunnelling, 5 (5), 455–463. Available from: https://onlinelibrary.wiley.com/doi/abs/10.1002/geot.201200032.
- Sharma, S., and Das, A., 2008. Backcalculation of pavement layer moduli from falling weight deflectometer data using an artificial neural network. Canadian Journal of Civil Engineering, 35 (1), 57–66.
- Smith, I.M., 1970. A finite element approach to elastic soil–structure interaction. Canadian Geotechnical Journal, 7 (2), 95–105.
- Ullah, S., Pichler, B., and Hellmich, C., 2013. Modeling ground-shell contact forces in NATM tunneling based on three-dimensional displacement measurements. Journal of Geotechnical and Geoenvironmental Engineering, 139 (3), 444–457.
- Varma, S., Kutay, M.E., and Levenberg, E., 2013. Viscoelastic genetic algorithm for inverse analysis of asphalt layer properties from falling weight deflections. Transportation Research Record, 2369 (1), 38–46.
- Vesić, A.B., 1961. Bending of beams resting on isotropic elastic solid. Journal of the Engineering Mechanics Division, 87 (2), 35–53.
- Vlasov, V.Z., 1966. Beams, plates and shells on elastic foundation. Israel Program for Scientific Translation.
- Wang, H., and Li, M., 2016. Comparative study of asphalt pavement responses under FWD and moving vehicular loading. Journal of Transportation Engineering, 142 (12), 04016069.
- Winkler, E., 1867. Die Lehre von der Elasticität und Festigkeit mit besonderer Rücksicht auf ihre Anwendung in der Technik [lessons on elasticity and strength of materials with special consideration of their application in technology].
Appendix 1.
Results of multi-directional FWD testing on the new plate
Table A1. Maximum deflections measured during all FWD tests on the new plate (mm).
Appendix 2.
Results of multi-directional FWD testing on the old plate
Appendix 3.
Convergence analysis
A convergence analysis is performed for the structural simulation presented in Section 3.2. The structural analysis is repeatedly performed, whereby the number of deflections modes included in the ansatz (Equation15(15)
(15) ) is progressively increased. The convergence is assessed based on the deflection referring to the centre of the plate,
, see . The deflections can be treated as being virtually converged, if ≥256 deflection modes are used. This is equivalent to
in Equation (Equation15
(15)
(15) ).
Figure A1. Convergence study: computed deflection at the centre of the plate, normalised with the thickness of the plate, as a function of the deflection modes included into the Fourier ansatz (Equation15(15)
(15) ).
Appendix 4.
Fourier coefficients of the deflection ansatz of Equation (15), N=33
Table A3. Accelerations at the time instant when the maximum deflections occurred during all FWD tests on the new plate (m/s).
Table A4. Maximum deflections measured during all FWD tests on the old plate (mm).
Table A6. 324 Fourier coefficients describing the deflections illustrated in .