
ABSTRACT
The fast pace of our daily lives often prompts consumers to seek convenient and ready-to-eat snacks, such as cereal bars. This work aims to characterize the cereal bars available in the Portuguese market (Study 1), as well as consumers’ perceptions of different types of these products (Study 2). First, we collected data (e.g. nutritional information, price) on 277 cereal bars from two major Portuguese retailers. The results indicated that most of these products do not comply with the current guidelines for key nutrients like sugar, fat, and salt. Second, using an online survey, we asked participants (N = 373) to evaluate cereal bars from different categories (e.g. “energy/protein”) across eleven dimensions. Overall, the bars were rated as tasty but also unhealthy, highly caloric, processed, and unsuitable for athletes, children, and weight loss. Interestingly, participants overestimated the content of most nutrients contained in cereal bars. A content analysis revealed that participants indicated more reasons for not consuming (e.g. excessive sugar content) than consuming (e.g. convenience) these products. Given the increasing popularity of cereal bars, our findings call for action from multiple stakeholders toward improving cereal bars’ nutritional profile and advancing our understanding of consumers’ perceptions of these products to facilitate healthier choices.
Introduction
Current busy lifestyles have been associated with an increased demand for meals/snacks that are quick sources of nutrition (e.g., Sharma et al., Citation2014). Cereal bars – which, for streamlining, in this paper include all on-the-go bars (i.e., even those that include fruits or nuts as the main ingredient) – are a good example of these products. A recent market study reported that in 2020, one in every five Portuguese consumed cereal bars, with higher intake observed for women (vs. men) and younger people (Grupo Marketest, Citation2021). This popularity translates into the expectation of market growth in the coming years. Specifically, it is expected that between 2023 and 2028, this market will register a compound annual growth rate (CAGR) of 4.45% worldwide (Mordor Intelligence, Citation2023). The most common reasons for consuming these products include both convenience – namely cereal bars are practical, easy to carry and store, -and pleasure/liking factors, such as liking, craving, and good taste (Salazar et al., Citation2019). Moreover, cereal bars are often chosen as a way to reduce the consumption of sweets and are perceived as a healthier option than snacks like chocolate or cookies (Kosicka-Gębska et al., Citation2022). Still, several governmental organizations worldwide discourage their intake (e.g., New Zealand), not only because they are ultra-processed foods but also due to their overall nutritional profile (e.g., high content of saturated fat, (added) sugar and/or salt; Klerks et al. (Citation2022).
Despite this growing consumption, to our knowledge, the nutritional quality of cereal bars available in Portugal, as well as consumers’ perceptions about these products, remain little explored. Here, we aim to characterize the cereal bars available in two main Portuguese retailers – Study 1. This systematic characterization is an essential first step toward better understanding the nutritional profile of cereal bars available to Portuguese consumers, particularly concerning their compliance with current national salt, fat, and sugar guidelines. In Portugal, nutrition labeling is mandatory on all food packages (Regulation EU No 1169/2011). The guidelines in place follow international nutritional recommendations (e.g., WHO, Citation2015) and aim to contribute to lowering the intake of nutrients such as salt, sugar, and fat. For instance, a product low in these nutrients should contain less than 5 g of sugar, 3 g of fat, and 0.3 g of salt (per 100 g of product, PNPAS, Citation2015).
Besides describing the cereal bars available in the Portuguese marketplace, it is equally important to examine how consumers perceive these products and their nutritional quality. In Study 2, we assessed consumers’ perception across an extensive set of evaluative dimensions (e.g., perceived healthiness; caloric content) and explored whether they vary according to the specific cereal bar category (e.g., child-oriented) and individual characteristics (e.g., age). Moreover, we also explored the main motivations to consume (or not) cereal bars (qualitative analysis).
Previous studies have shown that ready-to-eat bars’ profile and nutritional quality are very variable. For example, Klerks et al. (Citation2022) analyzed the 50 most-sold cereal bars in German retail and drug stores in 2019 and found that half of these products were classified as “D” in Nutri-score, whereas none obtained an “A” score. Gilbert-Moreau et al. (Citation2021) also analyzed 310 granola bars available in the Canadian marketplace and found that, on average, they contain 27.6 g of sugar and 15 g of fat per 100 g of product. Although cereal bars usually present a higher nutritional quality than other options like chocolate bars, many of these products are high in sugar and fat, suggesting that improvements can be made (Klerks et al., Citation2022).
Consumers’ perceptions of products are determined by several factors, including packaging design (e.g., color, size, and shape; Hallez et al., Citation2020; Silayoi & Speece, Citation2007), mandatory labeling (e.g., list of ingredients, nutrition declaration; European Parliament, Citation2011) or other credence cues (e.g., brand, health claims, food origin; Fernqvist & Ekelund, Citation2014). Regarding cereal bars, the few studies examining consumer perceptions suggest the importance of flavor (Pinto et al., Citation2017) as well as labeling (Miraballes et al., Citation2014; Salazar et al., Citation2019). Importantly, the type of cereal bar may modulate how the product is perceived and which features are more relevant. For example, consumers tend to base their perception of meal replacement bars on messages related to the product’s function and the images included in the packaging and less so on nutritional information (Miraballes et al., Citation2014). Salazar et al. (Citation2019) compared the effect of the information presented on the front-of-package (FoP), namely fruit, chocolate, high protein, and caloric content. The authors found that chocolate and calories were the most important drivers of interest and that cereal bars without chocolate were rated the healthiest (see Tárrega et al., Citation2017, for similar results with a different product category). However, other drivers were found for specific groups – women valued attributes such as “with fruit,” and people who exercise valued attributes like “high protein.” Moreover, previous research concluded that claims about the presence (i.e., protein, fiber, calcium, and vitamin C) or absence (i.e., saturated fat and sodium) of some (micro)nutrients increase consumers’ perception of products’ healthfulness (Drewnowski et al., Citation2010). Fernan et al. (Citation2018) manipulated the claim presented – the product title (“Zing protein bar”), content claim (“good source of protein”), and control (“Zing bar”) – and observed higher healthfulness ratings for the product title and content claim conditions (vs. control). Also, Centurión et al. (Citation2019) investigated the influence of including nutritional warnings (i.e., excessive content of sugar and saturated fat), nutrient claims (i.e., fiber content), and fruit images on the perceived healthfulness of cereal bars. Interestingly, only nutritional warnings had a significant impact being rated as the least healthy. Notably, while these studies highlight the impact of packaging cues on cereal bars’ perceptions, most studies (e.g., Centurión et al., Citation2019; Drewnowski et al., Citation2010; Fernan et al., Citation2018) have only addressed healthfulness dimensions.
Study 1 characterized an extensive set of cereal bars available in the Portuguese market. Besides presenting an overall descriptive analysis of the product’s nutritional proprieties, we categorized the bars (e.g., “child-oriented;” “fruit, nuts, and seeds”) based on packaging features (e.g., cartoon characters; food claims) and analyzed compliance rates with national nutritional guidelines (e.g., recommended sugar, fat, or salt content; Department of Health (UK), Citation2013; Dispatch No 11418/2017, Citation2017; PNPAS, Citation2015). Study 2 takes a different approach by exploring how consumers perceived cereal bars according to the categories of products identified in Study 1. Importantly, we extended this analysis to other dimensions besides healthfulness (e.g., expected taste, calories, sugar content, processing level, and suitability for specific groups such as athletes or children). We also explored the role of individual characteristics in the product evaluations.
Study 1 – characterizing cereal bars available in the Portuguese market
Method
Data collection
We collected data from all available cereal bars on the websites of two major Portuguese retailers (i.e., retailers with the highest market share in Portugal, Silva, Citation2018). After removing duplicates, we identified 277 unique products from 38 brands, most of which − 82.7% - were name brands, and the remaining were own-label brands. All information was compared between retailers, and in the case of missing or inconsistent information, the brands’ websites were consulted. We registered the brand, variety, type of package (i.e., individual vs. pack), weight per serving size, as well as price and nutritional information per 100 g, namely energy in Kcal, grams of fat, saturated fat, carbohydrates, sugar, protein, fiber, and salt.
Products description
Based on packaging attributes (e.g., graphical aspects, ingredients or nutrients emphasized), we identified five categories: 1) child-oriented – e.g., those that contain cartoons; 2) energy/protein – e.g., sports, protein bars, such as endurance line; 3) fruits/nuts/seeds – e.g., those containing fruits, nuts, and seeds as main ingredients; such as date paste; peanuts, sesame seeds, 4) diet – e.g., light bars, meal-replacement bars; and 5) general – all the remaining bars. This categorization was made by two independent judges, and inconsistencies (16%) were solved in discussion with a third judge, who is a nutritionist. Most of the bars (60%) belong to the categories of fruits/nuts/seeds and “diet” (for the frequencies per category, see ).
Table 1. Descriptive information regarding price (€/g) and serving size (g/bar).
Data analytic plan
We present descriptive statistics for the price, serving size, energy in Kcal, and nutrients per 100 g of product, as well as Pearson correlations between these variables. To examine whether the different categories of bars differ in price, serving size, energy, and nutritional quality, we performed a one-way ANOVA and the respective post hoc tests with Bonferroni correction, with category as the independent variable for each dependent variable.
Results
Price and serving size according to product category
Most cereal bars (62.1%) were sold in packs of 3 to 18 bars. summarizes the information regarding price (Euro per 100 g) and weight (g per bar), illustrating the wide range observed for both criteria.
Price per 100 g varied between 0.32 and 6.3€ (M = 2.92, SD = 1.35) and according to the category of the bars, F(4,272) = 31.31, p < .001, ηp2 = .32. Bars in the energy/protein category were the most expensive (all ps ≤ .002), while those in the general category were the least expensive (all ps < .001; but not different from child-oriented ones, p = 1.000).
Serving size (weight per bar) varied between 9 and 100 g (M = 33.25, SD = 14.52) and significantly differed across product category, F(4,271) = 34.57, p < .001, ηp2 = .24. Energy/protein category bars presented the largest serving size (all ps < .001), while child-oriented bars had the smallest (all ps < .001; but not different from general and diet ones, ps = 1.000).
Nutritional profile of products
presents the nutritional characteristics of cereal bars in each category. Overall, nutritional characteristics varied significantly across product category. The descriptive statistics and inferential tests are presented in Appendix - .
Figure 1. Nutritional characterization (fat, saturated fat, total carbohydrates, sugar, fiber, and protein per 100 g) according to the type of bar.
The fruits/nuts/seeds bars were the highest in energy (all ps ≤ .030), fat (all ps < .001), and sugar content (ps < .001; but not different from general and child-oriented, ps = 1.000). These bars were also the lowest in salt (ps < .001; but not different from child-oriented, ps = .383) and contained less saturated fat than diet ones (p < .001, but not different from the other categories, ps ≥ .864). Diet bars contained the highest content of saturated fat (ps ≤ .039; but not different from child-oriented and energy/protein, ps = .192) and lower salt levels than fruits/nuts/seeds (p < .001, but not different from the other categories, ps = 1.00). Noteworthy, the energy/protein bars were lowest in energy (ps ≤ .025; but not different from child-oriented and diet ones, p ≥ .565), carbohydrates (ps < .001, but not different from fruits/nuts/seeds, p = .359), and sugar (ps < .001, but not different from child-oriented and diet, p ≥ .086). These bars also presented higher fiber (ps ≤ .002, but not different from fruits/nuts/seeds and diet, p ≥ .340) and protein content (all ps < .001). The child-oriented bars contained less fat than fruits/nuts/seeds (p < .001; but not different from the other categories, ps = 1.000), less fiber than energy/protein bars (p = .002, but not different from the other categories, ps ≥ .054), and less protein than energy/protein bars (p < .001; but not different from the other categories, ps ≥ .057). The bars of the general category were the highest in carbohydrates (ps < .001, but not different from the child-oriented, p = 1.000).
Compliance with current nutritional guidelines about fat, sugar, and salt content
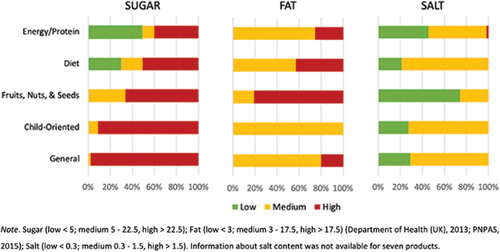
shows that only 18% of the products complied with the current national guidelines for sugar content – i.e., less than 5 g per 100 g of product. None of the products complied with the guidelines for fat content – i.e., less than 3 g per 100 g of product. Only about 44% of the products complied with the salt content guidelines – i.e., less than 0.3 per 100 g of product.
Figure 2. Categorization of sugar, fat, and salt levels according to the nutritional traffic light system (% of products).
Correlations
We also analyzed how price was associated with nutritional information (the correlations between nutrients are presented in Appendix – ). We found that more expensive products were associated with a higher content of fat, saturated fat, fiber, and protein, while the least expensive ones were associated with more carbohydrates and sugar content, ps < .001.
Study 2 – consumers’ perceptions about different types of cereal bars
This study explored how participants perceived the different types of bars identified in Study 1 across an extensive set of evaluative dimensions (e.g., healthfulness, expected taste) and how they assessed the products’ nutritional quality. We also examined if the perception of the products varied according to individual characteristics (e.g., frequency of consumption, education/profession related to health/nutrition).
Method
Participants
To participate in the study, participants had to be at least 18 years old and proficient in Portuguese. The sample included 373 participants (84.5% women, 15% men, 0.3% non-binary, and 0.3% preferred not to respond; Mage = 29.22, SD = 11.10) who volunteered to collaborate in this online study. Participants were recruited through social network websites, and the only incentive to participate was the possibility to enter a raffle to win a 50€ gift card. Most participants were students (n = 157, 42.1%) or active workers (n = 141, 37.8%). The majority reported having completed or still attending higher education (n = 316, 85%), with 35.6% (n = 129) having higher education in health-related areas (e.g., nursing, nutrition, public health, physiology, pharmaceutical sciences). Only 29.4% of the participants reported living with children.
Based on the reported weight and height, most participants’ Body Mass Index (BMI) was within the normal range (76.22% of 349 valid responses), 16.62% were overweight or obese (BMI >25), and 7.16% were underweight (BMI <18.5). Overall, using 7-point rating scales, participants considered their weight adequate compared to people of the same gender and age (M = 4.27; SD = 1.20; 95% CI [4.16, 4.40], reported a moderately active lifestyle (M = 4.61; SD = 1.68; 95% CI [4.43, 4.77]) and good health (M = 6.01; SD = 1.31; 95% CI [5.88, 6.14]), with 45% exercising 1–2 times a week. Only 26.3% reported not consuming cereal bars.
Materials
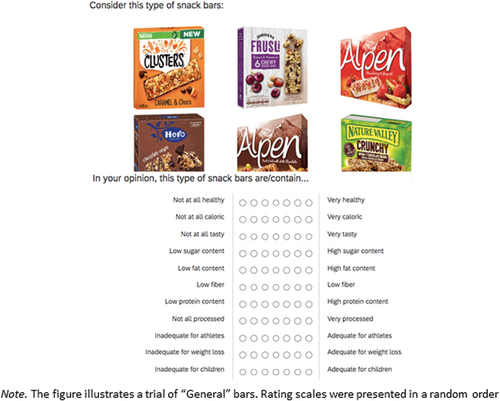
Materials were selected from the set of products analyzed in Study 1. For each category, we randomly selected six name-brand exemplars that were presented in a single image (see example in ). To minimize the possibility of order effects, three images per category were created by randomly varying the position of the six bars. The characteristics of each category are presented in Appendix - .
Figure 3. Example of a trial.
Procedure and measures
This study was approved by the Research Ethics Board of the [Blind for Review, approval #22/2019]. Participants were invited through social network websites to participate in an online survey (hosted in Qualtrics, in European Portuguese) on how consumers rate food products across several dimensions. The link to the survey was made available and disseminated across institutional mailing lists and professional networks (e.g., LinkedIn) until January 2022.
After reading and giving their informed consent, participants indicated their gender, age, occupation, level of education, field of study (e.g., arts, humanities, health), and the number of children in their household.
In the main task, participants were asked to provide their opinions regarding different types of cereal bars. This task included five trials – one per product category, and the presentation order of the product categories was randomized. Each trial included an image of six exemplars of a category and a set of 11 rating scales in randomized order presented immediately below the image, all on a single screen.
Then we asked participants to indicate their estimate of the sugar, fiber, fat, and protein content of each type of bar using a slider between 0% and 100% (an “I don’t know” option was also available), as well as the energy value (in kcal) and weight (in grams).
Participants were also asked about their overall frequency of consumption of cereal bars (“How often do you consume cereal bars?,” 1 = Never to 7 = More than once a day) and to indicate the reasons that lead them to consume (or not) these products. Finally, participants were asked about their interest in food and nutrition (1 = Very low to 7 = Very high), height, weight, and perceived weight (“Compared to people of your sex and age, you would say your weight is”… 1 = Low to 7 = High), lifestyle (1 = Sedentary to 7 = Very active), health status (1 = Very bad to 7 = Very good), and frequency of physical exercise (1 = Never to 7 = More than 5 times a week with sessions longer than 60 min each). On average the session took 10 minutes. At the end of the survey, participants were thanked and debriefed.
Data analytic plan
Specifically, participants were asked to evaluate the category regarding their perceived healthfulness, taste, caloric, fiber, protein, sugar, and fat content, level of processing, and their suitability for athletes, losing weight, and children, using 7-point rating scales with 1 representing the lowest evaluation (Not at all/Low/Inadequate) and 7 the highest (Very/High/Adequate; see ). First, to explore the impact of the bar category on consumers’ perceptions, we conducted a repeated-measures ANOVA for each of the 11 evaluative dimensions (results with Greenhouse-Geisser correction whenever the sphericity assumption was not verified; post hoc tests with Bonferroni correction). Moreover, we calculated the difference between participants’ estimates of nutritional content and the bar’s actual nutritional content. We then explored the influence of individual characteristics (i.e., gender, presence of children in the household, health-related education) on the general perceptions of the cereal bars (one-way ANOVAs). We also explored the associations (Pearson correlations) between these ratings, frequency of consumption, and individual characteristics (i.e., age and BMI). Finally, we present the main reasons for consuming (or not) cereal bars categorized with MAXQDA (a software for computer-assisted qualitative and mixed methods data).
Results
Nutritional quality ratings
presents participants’ ratings on the 11 evaluative dimensions. Overall, based on the 95% CI of the ratings for the cereal bars in general, participants rated the bars as unhealthy and unsuitable for athletes, children, and weight loss. Additionally, the products were rated as moderately tasty, processed, and caloric, as well as having moderate sugar, fat, and fiber but low protein content.
Table 2. Descriptive statistics for each evaluative dimension according to product category.
The main effect of the cereal bar category was significant across all evaluative dimensions (see ). Child-oriented bars were considered the least healthy, more caloric, tastier, higher in sugar and fat content, more processed, with lower fiber and protein content, and the least suitable for athletes and weight loss (all ps < .001 for all dimensions). The fruits/nuts/seeds bars were rated as the healthiest (ps < .001, but not different from protein/energy, p = 1.000), least caloric (ps < .001, but not different from protein/energy and diet, ps ≥ .845), higher in fiber content (all ps < .001), less processed (all ps < .001), more suitable for children (all ps ≤ .018) and for weight loss (ps < .001, but not different from protein/energy, p = 1.000). Finally, the protein/energy bars were evaluated as the least tasty (all ps < .001), as having lower sugar (all ps < .001) and fat content (all ps ≤ .002) but higher in protein (all ps < .001). The bars in this category were also rated as the most suitable for athletes (all ps < .001) and the least suitable for children (all ps < .001).
Nutritional content estimates
Overall, participants overestimated the nutritional content of the exemplars presented (see ) except for carbohydrates, which tended to be underestimated in most categories (not for fruit/nuts/seeds and energy/protein bars). Minor deviations to this overall trend were only observed in the estimations of sugar and carbohydrates for energy/protein category bars (which were quite accurate) and fat content estimates for the fruit/nuts/seeds bars (which tended to be underestimated).
Figure 4. Nutritional content estimates.
Additionally, we used participants’ estimates of the weight and calories of the cereal bars to calculate the estimated calories per 100 g of product. Participants tended to overestimate the caloric value of all types of bars, especially for child-oriented (+280 Kcal), general (+180 Kcal), and diet bars (+95 Kcal). This overestimation was less noticeable for energy/protein (+27 Kcal) and fruit/nuts/seeds (+9 Kcal) bars.
The impact of individual characteristics on the cereal bars’ evaluation
Ratings across the 11 evaluative dimensions were independent of gender (all ps ≥. 144)Footnote1 or having (or not) children in the household (all ps ≥ .135). Not surprisingly, we observed differences in most dimensions according to education in health-related areas (see Appendix - ). Specifically, those with (vs. without) education in health-related areas rated cereal bars as more caloric, F(1.316) = 6.19, p = .013, η2p = .019, more processed, F(1.316) = 13.43, p < .001, η2p = .041, higher in sugar, F(1.316) = 4.04, p = .045, η2p = .013, lower in protein, F(1.316) = 4.46, p = .035, η2p = .014, and lower in fiber, F(1.316) = 6.08, p = .014, η2p = .019. Moreover, these participants also rated the bars as less suitable for children, F(1.316) = 4.70, p = .031, η2p = .015, and for weight loss, F(1.316) = 1.93, p = .014, η2p = .019, than those without education in health-related areas.
We also observed that people consuming bars more frequently also rated them higher on healthiness (r = .234, p < .001), expected taste (r = .213, p < .001), protein content (r = .179, p < .001) and suitability for athletes (r = .138, p = .007), children (r = .215, p < .001) and weight loss (r = .202, p < .001). In contrast, frequent consumption was associated with lower ratings for caloric (r = −.195, p < .001) and sugar content (r = −.123, p = .018), and level of processing (r = −.137, p = .008) of these products. Additionally, age was negatively associated with ratings on the suitability dimension of cereal bars for children (r = −.211, p < .001), while BMI was negatively associated with ratings for sugar content (r = −.106, p = .049). In other words, older participants rated the bars as less suitable for children, and participants with a higher BMI provided lower ratings for sugar content. Finally, age was negatively associated with the frequency of bars consumption (r = −.119, p = .021).
Motives for consuming (or not) cereal bars
When asked to indicate the reasons for consuming cereal bars, participants (n = 246) provided 340 responses mostly related (n = 202) to convenience, for example, “Practical to eat between meals;” “Easier snack to take to work;” “Practical to carry;” “To replace a time-consuming snack.” The second most mentioned reason was the good taste of the bars (n = 46), for example, “Because they taste good;” “They are delicious;” “Pleasant taste.” The third referred to satiety-related motives (n = 26), for example “[when] hungry between meals;” “To take the edge off hunger;” “[to] Satiate.”
In contrast, when asked to indicate reasons for not consuming, participants (n = 328) provided 542 responses. The most frequent reason mentioned was the high sugar content (n = 115; “They have too much sugar;” “They are too sweet;” “High content of added sugars”), followed by the dislike of these products, namely taste and texture (n = 82; “I just don’t like them;” “not at all tasty;” “I don’t enjoy the texture”) and the degree of processing (n = 69; “Processed food;” “Unnatural;” “These are highly processed foods”).
Discussion
Current busy lifestyles increasingly demand ready-to-eat foods such as cereal bars. These products are becoming more popular, and their market share is expected to grow (Data Bridge Market Research, Citation2022). Besides convenience, some consumers also expect cereal bars to be healthier than other snacks (Klerks et al., Citation2022). In Study 1, we analyzed the nutritional profile of the cereal bars available in the Portuguese marketplace. Based on packaging cues and the list of ingredients, we organized the products into five categories. Overall, cereal bars were quite variable in serving size and price. Considering that the recommended serving size is one bar, this may assume important implications for consumer decision-making. For example, consuming one bar may imply ingesting 105 or 584 kcal. Moreover, cheaper cereal bars contained more sugar and less protein. This finding aligns with previous studies reporting that lower price is commonly associated with poor nutritional value (e.g., Prada et al., Citation2021). This is particularly relevant since price is a well-established driver of food choice (Zorbas et al., Citation2018) and one of the most frequent constraints (Epstein et al., Citation2010) to healthy eating. These data are important because consumers often looking for cheaper options may be ingesting more significant amounts of sugar with documented adverse health consequences (WHO, Citation2015).
Moreover, wide variation was also observed regarding nutritional profile (e.g., for sugar content, bars varied between less than one to 57% of the product’s composition). Critically, most products did not comply with the national guidelines for fat, sugar, and salt content. For example, all exemplars were categorized as “medium” or “high” in the nutritional traffic light for fat content. However, this indication needs to be interpreted with caution and consider the bar type, as it does not necessarily mean the products were unhealthy (e.g., almost 81% of the bars in the fruits/nuts/seeds category are in the “red”). For sugar, more than half of the exemplars were categorized as “high,” and only 18% of the products complied with the current sugar content guidelines (i.e., “low”), converging with previous studies regarding breakfast cereals available on the Portuguese market (Prada et al., Citation2021). Overall, these data call for the attention of manufacturers and regulators toward complying with current nutritional guidelines and providing consumers with healthier options.
In Study 2, we explored participants’ perceptions about different types of cereal bars and how these perceptions are shaped by their individual characteristics. Overall, participants rated the exemplars presented as unhealthy, highly caloric, and highly processed but also as tasty. Regarding the perceived nutritional profile, the bars were rated high in sugar, fat, and fiber but moderate in protein content. Overall, the bars were considered unsuitable for the intended targets, that is athletes, children, and people interested in losing weight. In light of this, it might not be surprising that participants indicated more reasons for not consuming these products (e.g., excessive sugar content; highly processed) than for their consumption. Still, convenience stands out as the main reason for eating cereal bars (for similar results, see Salazar et al., Citation2019).
As in previous studies, perceptions about the products may be modulated by the bar type (Miraballes et al., Citation2014). Interestingly, our results suggest that perceptions about child-oriented bars were particularly negative as they were rated as the least healthy, the most caloric, with the highest sugar content. This aligns with the results found in Study 1 with most products being “yellow” in fat, “red” in sugar, and even salt. Indeed, a recent scoping review suggests that a substantial proportion of products aimed at children are unhealthy (Elliott & Truman, Citation2020). Consumers may be aware of the poor nutritional quality of products for some categories – like child-oriented bars – but not as much for others. For instance, although participants rated “fruits/nuts/seeds” bars as healthier and the most adequate for weight loss, Study 1 showed that these types of bars are usually high in sugar and fat. Hence, consumers may be inadvertently ingesting higher amounts of such nutrients, which calls for increased nutritional literacy.
Critically, findings from Study 2, suggest that participants tend to overestimate the content of all nutrients, except carbohydrates. For example, fiber content was especially overestimated, regardless of the cereal bar category. Overestimation is particularly evident in the case of sugar and fat for child-oriented cereal bars. On the one hand, overestimating these nutrients can have positive outcomes, such as choosing healthier products as a way to avoid or reduce the intake of cereal bars. On the other hand, overestimating nutrients such as fiber or protein, may have the opposite result. For example, Drewnowski et al. (Citation2010) concluded that protein content could determine the perceived nutritional quality of foods and that information about protein or fiber enhances perceived healthfulness. Nonetheless, our results may merely indicate that individuals have difficulty in nutrient estimation tasks. For instance, prior research suggests that most people cannot accurately estimate the maximum daily amount of sugar recommended (e.g., Prada, Saraiva, et al., Citation2020; Tierney et al., Citation2017) or the sugar content of products (Miller et al., Citation2019). Future studies could address this potential caveat by providing judgment anchors (e.g., the typical content range of a given nutrient for a product category).
Overall, our participants seem to hold a negative view of cereal bars, which does not align with the popularity of this type of product. Importantly, this perception is relatively independent of individual characteristics (e.g., gender, having children in the household). We observed that ratings did not vary according to gender, although participants with a health-related background viewed cereal bars more negatively and reported consuming them less frequently. We also observed a negative association between frequency of consumption and age. Given the heterogeneity of the product’s nutritional profile, it is relevant to implement strategies to empower consumers to make healthier choices considering their needs (e.g., a fruit/nuts/seed bar may constitute an adequate and fast energy source).
Still, results regarding individual characteristics should be interpreted with caution given the higher proportion of women (85%). The high participation of women in our study is consistent with a volunteer bias – women are more likely to participate in nutrition-related studies than men (e.g., Andreeva et al., Citation2015; Prada, Rodrigues, et al., Citation2020). Therefore, our sample differs from the overall population since it is estimated that the percentage of women in Portugal is around 53% (INE, Citation2019). Another potential limitation of Study 2 is that we presented six exemplars per category simultaneously (selected from Study 1) to illustrate the different types of bars. Hence, participants’ ratings may reflect their evaluations of the specific sub-set of products and not the overall category. Despite that, in our view, this approach is preferable to other methodological options, like providing a verbal description of each category (e.g., “think about energy/protein bars”), as it is more ecologically valid. Another possibility would be to present a single exemplar. However, if it was a fictitious product construed to be prototypical of its category, ratings could be affected by the low familiarity of the stimulus. In contrast, presenting a single familiar exemplar could also be problematic, as consumers could base their perceptions on their prior experience with the product.
The current study constitutes the first attempt to systematically characterize the nutritional profile of cereal bars available in Portugal, as well as consumers’ perceptions of these products. Our results showed that the nutritional profile of these products is generally problematic because the majority do not comply with the current guidelines for key nutrients, namely fat and sugar. Even salt content was worrisome, with less than half of products complying with the guidelines. We also examined consumers’ perceptions of cereal bars across several categories and a wide range of evaluative dimensions, besides healthfulness. These findings contribute to a better understanding of which product characteristics and individual characteristics of consumers (e.g., age, health-related education) may facilitate or hinder healthier consumer choices.
Addressing these issues may require the involvement of multiple stakeholders (e.g., governments, industry, Evans, Citation2017) and strategies known to be well-received by consumers (e.g., Hagmann et al., Citation2018; Prada, Rodrigues, et al., Citation2020). Possible strategies may include changing the products’ composition to comply with the nutritional guidelines. Additionally, product labeling should seek to communicate nutritional information in a simple, but accurate, way to enable healthier choices. Our findings can provide insights to foster change, including intertwined strategies targeting consumers (e.g., identifying potential misleading packaging cues), societal health (e.g., the interplay between public policy and industry, namely enhancing the offer of products complying with nutritional guidelines), and marketing strategies (e.g., optimize packaging to help consumers identify healthier options).
Disclosure statement
No potential conflict of interest was reported by the author(s).
Data availability statement
The data supporting the findings of this study are available from the corresponding author upon reasonable request.
Additional information
Funding
Notes
1 In this analysis we only compared the participants who identified themselves as male or female because the remaining cases were residual.
References
- Andreeva, V. A., Salanave, B., Castetbon, K., Deschamps, V., Vernay, M., Kesse-Guyot, E., & Hercberg, S. (2015). Comparison of the sociodemographic characteristics of the large NutriNet-santé e-cohort with French census data: The issue of volunteer bias revisited. Journal of Epidemiology and Community Health, 69(9), 893–898. https://doi.org/10.1136/jech-2014-205263
- Centurión, M., Machín, L., & Ares, G. (2019). Relative impact of nutritional warnings and other label features on cereal bar healthfulness evaluations. Journal of Nutrition Education and Behavior, 51(7), 850–856. https://doi.org/10.1016/j.jneb.2019.01.021
- Data Bridge Market Research. (2022). Europe nuts and cereal snacks bar market size, share, growth, analysis, scope, & forecast by 2029. https://www.databridgemarketresearch.com/reports/europe-nuts-and-cereal-snacks-bar-market
- Department of Health (UK). (2013). Guide to creating a Front of Pack (FoP) Nutrition label for pre-packed products sold through retail outlets. UK Government.
- Dispatch No 11418/2017. (2017). Diário Da República, n.o 249/2017, Série II. https://dre.pt/pesquisa/-/search/114424591/details/normal?l=1
- Drewnowski, A., Moskowitz, H., Reisner, M., & Krieger, B. (2010). Testing consumer perception of nutrient content claims using conjoint analysis. Public Health Nutrition, 13(5), 688–694. https://doi.org/10.1017/S1368980009993119
- Elliott, C., & Truman, E. (2020). The power of packaging: A scoping review and assessment of child-targeted food packaging. Nutrients, 12(4), Article 4. 958. https://doi.org/10.3390/nu12040958
- Epstein, L. H., Dearing, K. K., Roba, L. G., & Finkelstein, E. (2010). The influence of taxes and subsidies on energy purchased in an experimental purchasing study. Psychological Science, 21(3), 406–414. https://doi.org/10.1177/0956797610361446
- European Parliament. (2011). Regulation (EU) No 1169/2011 of the European Parliament and of the council of 25 October 2011. Official Journal of the European Union, 18–63.
- Evans, C. E. L. (2017). Sugars and health: A review of current evidence and future policy. Proceedings of the Nutrition Society, 76(3), 400–407. https://doi.org/10.1017/S0029665116002846
- Fernan, C., Schuldt, J. P., & Niederdeppe, J. (2018). Health halo effects from product titles and nutrient content claims in the context of “protein” bars. Health Communication, 33(12), 1425–1433. https://doi.org/10.1080/10410236.2017.1358240
- Fernqvist, F., & Ekelund, L. (2014). Credence and the effect on consumer liking of food – A review. Food Quality and Preference, 32, 340–353. https://doi.org/10.1016/j.foodqual.2013.10.005
- Gilbert-Moreau, J., Pomerleau, S., Perron, J., Gagnon, P., Labonté, M.-È., & Provencher, V. (2021). Nutritional value of child-targeted food products: Results from the food quality observatory. Public Health Nutrition, 24(16), 5329–5337. https://doi.org/10.1017/S1368980021003219
- Grupo Marketest. (2021). 1 em cada 5 portugueses consome barras de cereais [1 in 5 Portuguese consume cereal bars]. https://www.marktest.com/wap/a/n/id~274e.aspx
- Hagmann, D., Siegrist, M., & Hartmann, C. (2018). Taxes, labels, or nudges? Public acceptance of various interventions designed to reduce sugar intake. Food Policy, 79, 156–165. https://doi.org/10.1016/j.foodpol.2018.06.008
- Hallez, L., Qutteina, Y., Raedschelders, M., Boen, F., & Smits, T. (2020). That’s my cue to eat: A systematic review of the persuasiveness of front-of-pack cues on food packages for children vs. adults. Nutrients, 12(4), 1062. Article 4. https://doi.org/10.3390/nu12041062
- INE. (2019). Mulheres em Portugal [Women in Portugal]. https://www.ine.pt/xportal/xmain?xpgid=ine_inst_infografia&INST=656026969&xpid=INE
- Klerks, M., Román, S., Verkerk, R., & Sanchez-Siles, L. (2022). Are cereal bars significantly healthier and more natural than chocolate bars? A preliminary assessment in the German market. Journal of Functional Foods, 89, 104940. https://doi.org/10.1016/j.jff.2022.104940
- Kosicka-Gębska, M., Jeżewska-Zychowicz, M., Gębski, J., Sajdakowska, M., Niewiadomska, K., & Nicewicz, R. (2022). Consumer motives for choosing fruit and cereal bars—Differences due to consumer lifestyles, attitudes toward the product, and expectations. Nutrients, 14(13), 2710. https://doi.org/10.3390/nu14132710
- Miller, C., Wakefield, M., Braunack-Mayer, A., Roder, D., O’Dea, K., Ettridge, K., & Dono, J. (2019). Who drinks sugar sweetened beverages and juice? An Australian population study of behaviour, awareness and attitudes. BMC Obesity, 6(1), 1. https://doi.org/10.1186/s40608-018-0224-2
- Miraballes, M., Fiszman, S., Gámbaro, A., & Varela, P. (2014). Consumer perceptions of satiating and meal replacement bars, built up from cues in packaging information, health claims and nutritional claims. Food Research International, 64, 456–464. https://doi.org/10.1016/j.foodres.2014.07.028
- Mordor Intelligence. (2023). Snack bars market—Growth, trends, and forecasts (2023—2028). https://www.mordorintelligence.com/industry-reports/global-snack-bars-market
- Pinto, V. R. A., Freitas, T. B. D. O., Dantas, M. I. D. S., Della Lucia, S. M., Melo, L. F., Minim, V. P. R., & Bressan, J. (2017). Influence of package and health-related claims on perception and sensory acceptability of snack bars. Food Research International, 101, 103–113. https://doi.org/10.1016/j.foodres.2017.08.062
- PNPAS. (2015). Descodificador de Rótulos [Label Decoder]. Direção-Geral da Saúde. https://alimentacaosaudavel.dgs.pt/descodificador-de-rotulos/
- Prada, M., Rodrigues, D. L., Godinho, C. A., Lopes, D., & Garrido, M. V. (2020). Knowledge and acceptance of interventions aimed at reducing sugar intake in Portugal. Public Health Nutrition, 23(18), 3423–3434. https://doi.org/10.1017/S1368980020002165
- Prada, M., Saraiva, M., Garrido, M. V., Rodrigues, D. L., & Lopes, D. (2020). Knowledge about sugar sources and sugar intake guidelines in Portuguese consumers. Nutrients, 12(12), 3888. https://doi.org/10.3390/nu12123888
- Prada, M., Saraiva, M., Viegas, C., Cavalheiro, B. P., & Garrido, M. V. (2021). Examining the relationship between sugar content, packaging features, and food claims of breakfast cereals. Nutrients, 13(6), 1841. https://doi.org/10.3390/nu13061841
- Salazar, N. A., Fiszman, S., Orrego, C. E., & Tarrega, A. (2019). Evaluation of some ingredients and energy content on front-of-pack cereal bar labeling as drivers of choice and perception of healthiness: A case study with exercisers. Journal of Food Science, 84(8), 2269–2277. https://doi.org/10.1111/1750-3841.14726
- Sharma, C., Kaur, A., Aggarwal, P., & Singh, B. (2014). Cereal bars—A healthful choice a review. Carpathian Journal of Food Science & Technology, 6(2), 29–36.
- Silayoi, P., & Speece, M. (2007). The importance of packaging attributes: A conjoint analysis approach. European Journal of Marketing, 41(11/12), 1495–1517. https://doi.org/10.1108/03090560710821279
- Silva, N. M. (2018, September). Quota de mercado da Sonae MC aproxima-se dos 22% [Sonae MC market share increases up to 22%]. O Jornal Económico, 4. https://jornaleconomico.sapo.pt/noticias/quota-de-mercado-da-sonae-mc-aproxima-se-dos-22-350698
- Tárrega, A., Marcano, J., & Fiszman, S. (2017). Consumer perceptions of indulgence: A case study with cookies. Food Quality and Preference, 62, 80–89. https://doi.org/10.1016/J.FOODQUAL.2017.07.001
- Tierney, M., Gallagher, A. M., Giotis, E. S., & Pentieva, K. (2017). An online survey on consumer knowledge and understanding of added sugars. Nutrients, 9(1), 37. https://doi.org/10.3390/nu9010037
- WHO. (2015). Guideline: Sugars intake for adults and children. World Health Organization.
- Zorbas, C., Palermo, C., Chung, A., Iguacel, I., Peeters, A., Bennett, R., & Backholer, K. (2018). Factors perceived to influence healthy eating: A systematic review and meta-ethnographic synthesis of the literature. Nutrition Reviews, 76(12), 861–874. https://doi.org/10.1093/nutrit/nuy043
Appendices
Table A1. Descriptive statistics of nutritional characteristics (i.e., energy in Kcal; and grams of fat, saturated fat, total carbohydrates, sugar, fiber, and protein per 100 g of product) according to type of bar.
Table A2. Correlations.
Table A3. Nutritional profile, weight, and price of the products used in study 2 (M, SD).
Table A4. Impact of having (or not having) education in health-related areas on the participants’ perception of the cereal bars across evaluative dimensions.