
ABSTRACT
Background
Drop foot is common post-stroke, elevating fall risks and mobility limitations. It is caused by weakness and lack of control of the tibialis anterior muscle (TA), for which various rehabilitation treatments are used. A reliable objective estimate of changes in TA muscle morphology and composition can enhance treatment optimization.
Objectives
We aimed to ascertain 3D freehand ultrasound (3DfUS) reliability in measuring TA muscle volume, length, and echo intensity in stroke patients and healthy controls and its validity by comparing these features across legs, between patients and controls, and between clinical subgroups (i.e. patients with and without ankle contracture, spastic muscle overactivity, and foot dorsiflexor paresis).
Methods
We included 9 stroke patients and 9 healthy controls to define reliability and 26 stroke patients and 28 healthy controls to define validity. For reliability, data were collected and processed by 2 different operators and processors. For inter- and intra-rater reliability, intra-class correlation coefficient (ICC) and standard error of measurement (SEM) were used. For validity, Wilcoxon-Signed-Ranked and Mann-Whitney U tests were used for comparisons between groups and subgroups.
Results
All measurements showed good to excellent inter- and intra-rater reliability (ICC: 0.816 to 0.997, SEM: 0.5% to 7.8%). Comparison analyses revealed no differences in muscle features among legs, groups, or subgroups.
Conclusion
While the 3DfUS is a reliable method to define TA morphology and composition, its clinical validity needs further investigation into factors influencing muscle property changes across various age groups and post-stroke time points.
MeSH terms
Stroke; Skeletal muscle morphology; muscle composition; 3D freehand ultrasonography, Anterior Tibial Muscle
Introduction
Drop foot, a common gait deviation in stroke patients, contributes to fall risks and reduced mobility.Citation1,Citation2 It is caused in part by weakness and lack of control of the tibialis anterior muscle (TA).Citation2 Stroke-induced central nervous system changes lead to neural symptoms (e.g. muscle weakness, spastic muscle overactivity (SMO), impaired selective muscle control) and secondary soft tissue alterations, affecting joint range of motion (ROM) and intrinsic muscle properties, such as muscle morphology and composition.Citation3 Understanding these changes is crucial for refining rehabilitation strategies to optimize gait, mobility and gross motor function.
The morphology and composition of a muscle largely determine its functional capacity.Citation4 Muscle size is a key determinant of strength,Citation5 but strength also relies on muscle composition, representing the intrinsic quality of the tissue.Citation5 The more contractile tissue within a muscle, the higher its intrinsic quality and strength potential. Another important muscle feature is muscle belly length (ML), influencing joint ROM and contraction velocity.Citation5 Muscle morphology and composition adapt to stimuli like training and disuse. Muscles are a common target in post-stroke rehabilitation.Citation3,Citation6 Enhancing clinical rehabilitation algorithms necessitates a deeper understanding of post-stroke changes in lower leg muscle morphology and composition.
The morphology of a muscle can be evaluated in vivo with soft tissue imaging techniques, such as 2D ultrasound (US). In addition, muscle composition can be evaluated indirectly by determining Echo intensity (EI) for specific regions of the muscle. However, 2D US presents challenges because it lacks visualization of the entire muscle and direct measurement of muscle belly length or volume. To date, previous studies with US in stroke patients have not reported uniform findings on muscle thickness (MT), muscle and tendon length and EI in the hemiplegic leg.Citation3 A studyCitation7 on 14 chronic stroke patients found no difference in TA MT between affected and unaffected legs using US. Another studyCitation8 observed no discrepancy in EI but did find significant MT difference in TA. Nevertheless, there is evidence of reduced MT measured with US of the hemiplegic, spastic leg in stroke patients.Citation3 A recent trend in research involves three-dimensional freehand ultrasound (3DfUS), a technique enhancing conventional US with motion tracking, allowing direct quantification of muscle volume (MV) ML and EI.Citation9 While 3DfUS has proven to be effective in assessing muscle morphology and composition in children with cerebral palsy,Citation5 its application in studying adaptive changes in TA morphology and composition in stroke patients remains unexplored, presenting an avenue for clinical investigation.
Therefore, the objective of this study was to:
to define the reliability of 3DfUS for determining TA MV, ML, and EI in chronic stroke patients and healthy controls.
to define the discriminative validity of 3DfUS outcomes by comparing these parameters in chronic stroke patients and healthy controls.
We hypothesized that 3DfUS is a reliable assessment of TA muscle morphology and composition, and expected significant parameter differences between groups, as well as between both legs within a group.
Materials and methods
Study design
To achieve the first goal of this study, the intra- and inter-reliability for in vivo muscle acquisition of the TA, as well as processing of the TA imaging data was defined by using 3DfUS in stroke patients and healthy controls. Thereby, the reliability of extensively and moderately experienced operators was compared. In addition, we defined the magnitude of acquisition and processing errors of MV, ML and EI. An outline of the study design is presented in .
Figure 1. Overview of the reliability study design.
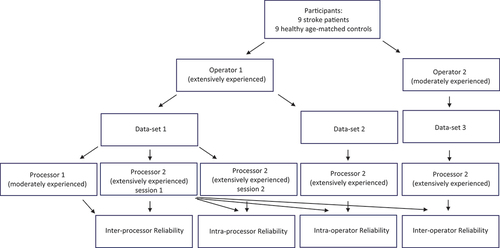
For the operator reliability AA (moderate experience, 1 year of clinical practice with 2D ultrasound) and FS (extensive experience, >5 years of clinical practice with 2D ultrasound) collected data in randomly chosen, predetermined sequences defined prior to each measurement. Subjects rested for 10 minutes in supine position, following the “sarcopenia guidelines for ultrasound,”Citation10 with the same resting knee and ankle angles at each measurement. Each operator successively measured both legs, with a walking pause in between. The order of leg measurements was determined by coin tossing ((heads or tails). Measures for intra-processor reliability were performed by FS (extensive experience) by analyzing all data twice with at least two-week interval. Extra measures for inter-processor reliability were performed by SVP (moderate experience). Standardized 15-h training for 3DfUS (Hanssen et al.Citation5) was followed by all operators and processors prior to acquisition and processing. In addition to this 15-h training, each operator and processor had performed at least 50 3DfUS measurement of the muscle of interest.
To define the discriminative validity, a cross-sectional study design with chronic stroke patients and healthy age-matched controls was established comparing affected versus unaffected legs (stroke patients), both legs (healthy controls), legs of stroke patients versus healthy controls. In addition, clinically relevant subgroups with/without ankle contracture (Plantarflexion <0°), SMO (Modified Ashworth Scale (MAS) > 0.5) and TA paresis (Medical Research council Motor Assessment Scale (MRC) < 5) were created in the stroke group. All data were obtained and processed by FS.
Study methodology aligned with STROBE,Citation11 ensuring transparency and quality through checklist adherence (supplementary data).
Participants
Stroke patients were recruited through the inpatient and outpatient rehabilitation departments of the University Hospitals Leuven. Healthy controls were recruited through hospital staff. shows criteria for bias reduction and group matching. Data collection, approved by the University Hospitals Leuven ethical committee (Protocol ID S60153, ClinicalTrials.gov ID NCT04607486), was part of an ongoing PhD project with written participant consent.
Table 1. Overview of in- and exclusion data for stroke patients and healthy age-matched controls.
Clinical scales
Subjects’ age and body mass index were recorded. Lower extremity muscle strength was assessed using the MRC (composite weakness: sum of weakness scores of the hip flexors and extensors, the knee flexors and extensors, and the ankle plantar and dorsiflexors) and the Timed Chair-Stand-Test. Activities of daily living were evaluated using the Bartel IndexCitation9 and the Functional Independence Measure.Citation9 Gait speed was measured with the 5-meter walk test.Citation9 The Rivermead Mobility Index and Modified Ranking Scale were used to assess functional mobility and the degree of disability in stroke patients, respectively.Citation9
3DfUS acquisition
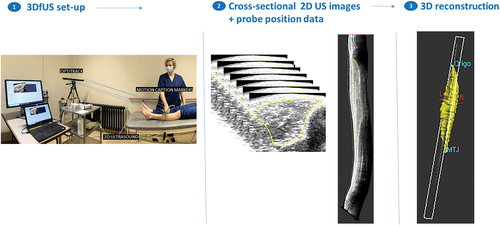
A 3DfUS method, as previously reported,Citation5 utilized a Telemed-Echoblaster 128 Ext-1Z system with a 5.9 cm 10 MHz linear US transducer. The system recorded data at a 30 Hz sample rate with constant acquisition settings (frequency 10 MHz, depth 5 cm, focus 3 dynamics, gain 64%, and dynamic range 56 dB). A motion-tracking system, OptiTrack V120 Trio, with three optical cameras, tracked four markers on the US probe. This resulted in a stack of B-mode images with known position and orientation, synchronized using STRADWIN software (version 6.0; Mechanical Engineering, Cambridge University).
US images of both legs were obtained in a single sweep in the transverse plane, from the origin over the muscle belly to the distal muscle-tendon junction of the TA. The probe was held perpendicular to the deep aponeurosis, and ample gel was used. If muscle contraction was suspected, the acquisition was repeated.
3DfUS data processing
Three-dimensional reconstructions were performed with STRADWIN software and quality control followed the standardized protocol of Peeters et al.. Citation5MV (in milliliters) was calculated by manually segmenting the transverse plane of the TA. The minimum number of segmented images was set at 10%, Citation5and linear interpolation filled gaps to determine MV. ML (in millimeters) was measured from the fronto-lateral surface of the tibia to the distal muscle-tendon junction. To account for anthropometric differences, MV was normalized to body weight (MV in ml/kg) and ML was normalized to body weight multiplied by length (ML in mm/kg*m). For the entire TA muscle, each centimeter was segmented to determine the average EI expressed as a gray value of 256 values (arbitrary units) of the interpolated muscle reconstruction. gives an overview of acquisition and processing of 3DfUS.
Figure 2. Overview of acquisition and processing of 3DfUS.
Statistics
For the cross-sectional validity study, sample sizes were determined using G*Power 3.1.9.7 with a power of 0.80, p < 0.05 and r = 1.02 based on previous 2D US studies.Citation12 The estimated sizes were a minimum of 18 participants for stroke patients versus healthy subjects and a minimum of 9 patients for subgroup comparisons. For the reliability study, 9 participants were included based on previous intra-class correlation coefficients (ICC) in children with cerebral palsyCitation5,Citation9 and a power of 0.80.
To assess normality of data distribution and homogeneity of variances, Shapiro Wilk and Levene tests were used, respectively. Demographic and anthropometric data were compared using the Mann-Whitney U test.
ICC (2.1) with 95% CI was used to assess intra- and inter-operator, and intra- and inter-processor reliability. ICC scores < 0.500 indicated poor reliability, 0.500–0.750 indicated moderate; 0.750–0.900 indicated good; >0.900 indicated excellent. Standard error of measurement (SEM) and relative SEM (SEM%) were calculated, and Bland-Altman plots were used to control for systematic bias (see supplementary data). To delineate the minimum clinically relevant change, Clinical Minimum Detectable Change (CMDC) was quantified using the distribution method and a 95% confidence interval, using the formula: CMDC = SEM x 1.96.
The Wilcoxon Signed-Ranked test was used to compare MV, ML and total EI between legs, and Mann-Whitney U test was used to test muscle properties between legs in patients and controls and between subgroup analysis.
Data, not normally distributed, were presented as median and interquartile range (IQR). All data were analyzed with IBM SPSS software, presenting Z-scores, p-values, R-values (effect size), U-values (difference between rank totals) and SE (standard errors). Significance was set at p ≤ 0.0016 (after Bonferroni correction).
Results
Participants
The study included 26 stroke patients (6 to 24 months post-stroke) and 28 healthy, age-matched controls . Nine stroke patients and 9 healthy subjects participated in the reliability study. summarizes comparable demographic and anthropometric data, while presents clinical characteristics for stroke patients and healthy subjects. The TA muscle could be assessed in a single sweep for all participants. Seven participants were excluded: three due to poor image quality and four because the study was interrupted for individual reasons.
Figure 3. Participant flow diagram.
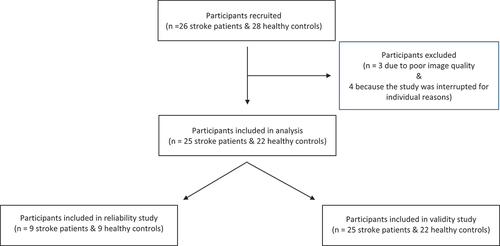
Table 2. Demographic and anthropometric information of participants. Medians (inter quartile ranges) or frequencies are given.
Table 3. Clinical scales for stroke patients & healthy subjects.
Reliability study
summarizes TA MV, ML and EI reliability. Both extensively and moderately experienced researchers demonstrated consistent ICCs across intra- and inter-operator, as well as intra- and inter-processor conditions. 3DfUS for TA MV exhibited excellent inter- and intra-rater reliability (ICC: 0.928 to 0.997 for stroke patients; 0.904 to 0.991 for healthy subjects). ML ICCs ranged from 0.816 to 0.984 for stroke patients and from 0.908 to 0.967 for healthy controls, while EI ICCs ranged from 0.966 to 0.977 for stroke patients and 0.875 to 0.994 for healthy controls. In intra-operator and intra-processor conditions, SEM% for 3DfUS ranged from 0.5% to 4.4% for stroke patients and 0.4% to 4.2% for healthy controls. Between extensive and less experienced researchers, inter-operator and inter-processor SEM% ranged from 2.2% to 7.8% for stroke patients and 1.7% to 7.6% for healthy controls. Bland Altman plots revealed no systematic bias in intra- or inter-rater analyses.
Table 4. Overview of reliability results for tibial anterior normalized muscle volume, normalized muscle length and echo-intensity for stroke patients and healthy controls.
Comparison of TA properties between legs, groups and subgroups
shows the results of the comparisons between the affected versus non-affected leg in stroke patients and between the left versus right leg in healthy subjects, between the affected leg of stroke patients versus the left leg of healthy subjects and between the non-affected leg of stroke patients versus the left leg of healthy subjects. In addition, subgroup analyses are shown in . Wilcoxon signed-rank test revealed no significant difference between the affected and the non-affected leg of stroke patients for MV (z = −0,87, p = 0,93 with a weak effect size r = −0,12), for ML (z = −0,19, p = 0,85 with a weak effect size r = −0,03) and for EI (z = −066, p = 0,51 with a weak effect size r = −0,09). Likewise, Wilcoxon signed-rank test revealed no significant difference between both legs of healthy controls for MV (z = −1,64, p = 0,10 with a weak effect size r = −0,25), for ML (z = −1,90, p = 0065 with a weak effect size r = −0,29) and for EI (z = −068, p = 0,01 with a weak effect size r = −0,10). Therefore, the left legs was used for further analyses between groups. Also for subgroup analyses, Wilcoxon signed-rank test test revealed similar, non-significant findings. Mann-Withney U test revealed no significant difference between the affected leg of stroke patients in comparison with the left leg for healthy controls for MV (U = 248, z = −0,58, p = 0,56 with a weak effect size r = −0,11), for ML (U = 148, z = −1,94, p = 0,052 with a weak effect size r = −0,28) and for EI (U = 64, z = −0,06, p = 0,98 with no effect size r = −0,00). Likewise, Mann-Withney U test revealed no significant difference between the non-affected leg of stroke patients in comparison with the left leg for healthy controls for MV (U = 248, z = −0,58, p = 0,56 with a weak effect size r = −0,11), for ML (U = 148, z = −1,94, p = 0,052 with a weak effect size r = −0,28) and for EI (U = 58, z = −0,43, p = 0,66 with a weak effect size r = −0,06). Also for subgroup analyses, Mann-Withney U test revealed similar, non-significant findings.
Table 5. Comparisons between leg of stroke patients (affected/non-affected, with/without SMO, with/without TA paresis, with/without contracture) versus left leg of healthy controls (mann-whitney U test).
Table 6. Comparisons between affected versus non-affected leg in stroke patients & between left versus right leg in healthy subjects (Wilcoxon signed-rank test).
Discussion
To the best of our knowledge, this is the first study that investigated TA MV, ML and EI using 3DfUS in patients with first chronic stroke in comparison to healthy controls.
This study supports the reliability of using a clinically feasible 3DfUS method to quantify TA MV, ML and EI in stroke patients and healthy controls. US acquisition and processing demonstrated high repeatability, showing excellent ICCs and small SEMs for intra-rater conditions with the same extensively experienced researcher. Inter-operator and inter-processor reliability, involving different (extensive and moderately experienced) researchers, also showed promising, good to excellent ICCs. However, for MV and ML, the SEM% range was larger compared with the intra-operator and intra-processor SEM%, emphasizing the importance of standardized researcher training, as previously described by Hanssen et al.Citation5 Notably, reliability outcomes did not significantly differ between the two cohorts.
The second aim of this study was to compare TA MV, ML and EI between legs within groups and between groups and subgroups. The study included 26 chronic stroke patients, naïve to botulinum toxin injections, and 28 healthy age-matched controls (40 to 60 years old) with similar demographic and anthropometric data. Significant differences in TA muscle morphology (MV, ML) and composition (EI) between sides, groups and subgroups were hypothesized. Overall, data on muscle morphology in healthy controls were in good agreement with previously published data.Citation13 Surprisingly, the present study found no difference in TA MV, ML, and EI between legs, groups, and subgroups.
Existing literature on TA morphological muscle properties after stroke presents limited and conflicting results. Similar to the current investigation, a study on 14 chronic stroke patients with spastic hemiparesisCitation7 found no difference in TA MT between the affected and unaffected leg, defined by 2D US. Another US studyCitation8 found no difference in TA EI, but did find a significant difference in MT at the level of the proximal third of the muscle belly of the TA between both legs of chronic stroke patients without SMO.
Caution is advised when comparing current 3DfUS results with previous 2D US studies. While reliable,Citation7,Citation8,Citation14 2D US evaluates the muscle at a single point, potentially missing intramuscular homogeneity in spastic and/or paretic muscles.Citation7 3DfUS directly quantifies parameters for the entire muscle, including MV,ML and EI.
The absence of differences in TA muscle morphology and composition in this study may be attributed to muscle-specific changes. Muscle mass, indicative of the balance between protein synthesis and breakdown,Citation15 reflects disruptions in stroke-related neural activation, leg immobilization, and metabolic alterations, potentially resulting in muscle atrophy. However, several factors, such as altered reflex mechanisms, co-contraction, bilateral overuse of TA during walking,Citation16 and/or increased recruitment to counter spastic plantar flexorsCitation2 might stimulate protein synthesis in the TA, reducing atrophy. Additionally, muscles with postural function, like the TA, have higher proportions of Type I fibers,Citation7 known for resistance to atrophy during aging,Citation17 suggesting relatively less atrophy in TA compared to other muscles. Overall, further examination of the TA with 3DfUS holds promise in uncovering potential adverse alterations in muscle morphology and composition. Specifically, it may shed light on whether the use of an AFO and/or/or casting after, for example, botulinum toxin treatment of the calf muscles exacerbates atrophy and subsequent weakening of the foot dorsiflexors in stroke patients.
Changes in muscle architecture have been suggested as early as three weeks after stroke with muscle atrophy due to disuse in particular.Citation14 A previous US study reported significantly smaller MT on the affected side compared to the unaffected side in acute stroke patients with spastic hemiparesis and smaller thickness compared to healthy control subjects.Citation14 Unlike the patients in the current study, the patients in this studyCitation14 were acute stroke patients, for whom spontaneous neurological recovery was not been completed. Today, consensus lacks about possible morphological changes in the chronic phase.Citation3 Increased muscle tone and stiffness in the lower leg during this phase may lead to adaptive changes in intrinsic muscle properties. Factors like muscle weakness, SMO severity, and compensatory strategies are believed to contribute to morphological changesCitation3 in this later stage post-stroke, though their relationships remain unclear.Citation3 It is therefore interesting to investigate changes in muscle morphology and their longitudinal evolution over time after stroke using 3DfUS. This could potentially guide the timing of different rehabilitation treatments according to changes in muscle morphology present at that time.
Since most US studies in stroke patients involve older individualsCitation7,Citation8,Citation14 accounting for age-related sarcopenia is crucial when comparing results. Future research should explore different muscle groups with varied activity patterns and fiber type compositions, considering multiple age groups,Citation17 to enhance the study’s generalizability and explore the discriminative validity of 3DfUS in stroke patients fully. In stroke, lesions in diverse brain areas can affect specific fiber tracts,Citation18 resulting in a mix of clinical syndromes and varied symptoms like SMO.Citation18 Stroke patients are heterogeneous due to these diverse lesions, potentially explaining the absence of significant differences in this study. The complex interplay between central pathophysiology and peripheral muscle morphology remains insufficiently investigated.
The hemiparetic leg’s plantar flexors in stroke patients are prone to contracture.Citation19,Citation20 However, it remains unclear if their immobilization affects MV and ML of its main antagonist, TA, and contributes to drop foot development. Investigating the impact of medial gastrocnemius muscle immobilization in a shortened position on TA tendon length would be insightful. This study found no TA MV and ML differences in stroke patient subgroups, suggesting a predominant role of neuromuscular control pathology in drop foot development, with limited secondary effects on muscle morphology and composition.
This study focused on MV, ML and EI as morphological outcome parameters affecting muscle force generation. Fascicle length and pennation angle are two other well-established parameters that contribute muscle force generation. Moreover, literature has documented changes in these muscle properties after stroke.Citation3 Therefore, it is interesting to include the assessment of both fascicle length and pennation angle using the 3DfUS technique in future research.
This study has several limitations.
Repeated 3DfUS measurements on the same day raise caution about generalizing reliability for long-term use. On the other hand, the repeated acquisition was performed after allowing the patient to walk around and the sarcopenia guidelines for US measurements were followed.Citation10 If participants follow consistent measurement guidelines and leg resting positions, 3DfUS appears reliable for longitudinal use.
The relatively small sample size in groups and subgroups increases the risk of Type II errors.Citation21 However, this is the first 3DfUS study investigating TA parameters in this specific stroke patient group, therefore the sample size was based on previous research with 3DfUS in children with Cerebral palsy and 2D US studies in stroke patients. This may limit generalizability, emphasizing the need for large-scale studies to establish relationships between muscle properties and factors like weakness, SMO, ankle contracture severity, and compensatory strategies.
The current findings lack generalizability to different muscles or age groups. Extending this technique to larger, diverse cohorts and other muscle groups would be insightful.
Conclusion
This is the first study to establish 3DfUS as a reliable method for quantifying TA muscle morphology and composition in chronic stroke patients and healthy controls. No observed differences in these studied groups indicate a need for further investigation into factors influencing muscle property changes. Additional studies across various age groups and post-stroke time points are necessary to explore evolution of TA muscle morphology and composition, and their correlation with muscle weakness, SMO, ankle contracture, and compensation strategies. Overall, the current 3DfUS technique is promising for longitudinal monitoring of TA muscle morphology and composition changes depending on immobilization duration and changes in patient mobility during the first days after stroke, as well as for improving the understanding of functional muscle recovery after intervention.
Abbreviations
| EI | = | Echo-intensity |
| MAS | = | Modified Ashworth Scale |
| MMT | = | Morphological Muscle and Tendon |
| MG | = | Medial Gastrocnemius Muscle |
| MV | = | Muscle Volume |
| ML | = | Muscle Length |
| ROM | = | Range of Motion |
| SMO | = | Spastic Muscle Overactivity |
| TA | = | Tibial Anterior Muscle |
| US | = | Ultrasonography |
Supplemental Material
Download MS Word (793 KB)Acknowledgments
The authors acknowledge Aron Claessen and Kaya De Ceuster for their practical support.
Disclosure statement
No potential conflict of interest was reported by the author(s).
Supplementary material
Supplemental data for this article can be accessed online at https://doi.org/10.1080/10749357.2024.2333184
Additional information
Funding
References
- Hu C, Hu H, Mai X, WLA L, Li L. Correlation between muscle structures and electrical properties of the tibialis anterior in subacute stroke survivors: a pilot study. Front Neurosci. 2019;13:1270. doi:10.3389/fnins.2019.01270.
- Ramsay JW, Wessel MA, Buchanan TS, Higginson JS. Poststroke muscle architectural parameters of the tibialis anterior and the potential implications for rehabilitation of foot drop. Stroke Res Treat. 2014;2014:1–5. doi:10.1155/2014/948475.
- Schillebeeckx F, DEG A, DEB N, Desloovere K, Verheyden G, Peers K. Muscle and tendon properties of the spastic lower leg after stroke defined by ultrasonography: a systematic review. Eur J Phys Rehabil Med. 2021;57(4):495–510. doi:10.23736/S1973-9087.20.06462-X.
- Hanssen B, Peeters N, Vandekerckhove I, De Beukelaer N, Bar-On L, Molenaers G, et al. The contribution of decreased muscle size to muscle weakness in children with spastic cerebral palsy. Front Neurol. 2021;12:692582. doi:10.3389/fneur.2021.692582.
- Hanssen B, De Beukelaer N, Schless SH, Cenni F, Bar-On L, Peeters N, et al. Reliability of processing 3-D freehand ultrasound data to define muscle volume and echo-intensity in pediatric lower limb muscles with typical development or with spasticity. Ultrasound Med Biol. 2021;47(9):2702–12. doi:10.1016/j.ultrasmedbio.2021.04.028.
- Schillebeeckx F, Mills PB, Ip A, et al. Worldwide survey of clinician practice on use of adjunctive therapies following botulinum toxin injection for spasticity. J Rehabil Med [Internet]. 2022 09;54:jrm00320. http://europepmc.org/abstract/MED/35801863, https://medicaljournalssweden.se/jrm/article/download/334/7050, https://doi.org/10.2340/jrm.v54.334, https://europepmc.org/articles/PMC9511365, https://europepmc.org/articles/PMC9511365?pdf=render10.2340/jrm.v54.334
- Mathevon L, Michel F, Aubry S, Testa R, Lapole T, Arnaudeau LF, et al. Two-dimensional and shear wave elastography ultrasound: a reliable method to analyse spastic muscles? Muscle And Nerve. 2018;57(2):222–8. doi:10.1002/mus.25716.
- Monjo H, Fukumoto Y, Asai T, Shuntoh H. Muscle thickness and echo intensity of the abdominal and lower extremity muscles in stroke survivors. J Clin Neurol. 2018;14(4):549–54. doi:10.3988/jcn.2018.14.4.549.
- Cenni F, Schless SH, Bar-On L, et al. Reliability of a clinical 3D freehand ultrasound technique: analyses on healthy and pathological muscles. Comput Methods Programs Biomed. 2018;156:97–103. doi:10.1016/j.cmpb.2017.12.023.
- Perkisas S, Bastijns S, Baudry S, Bauer J, Beaudart C, Beckwée D, et al. Application of ultrasound for muscle assessment in sarcopenia: 2020 SARCUS update. Eur Geriatr Med. 2021;12(1):45–59. doi:10.1007/s41999-020-00433-9.
- von Elm E, Altman DG, Egger M, Pocock SJ, Gøtzsche PC, Vandenbroucke JP. The Strengthening the Reporting of Observational Studies in Epidemiology (STROBE) statement: guidelines for reporting observational studies. J Clin Epidemiol. 2008;61(4):344–9. doi:10.1016/j.jclinepi.2007.11.008.
- Dias CP, Freire B, Goulart NB, Onzi ES, Becker J, Gomes I, et al. Muscle architecture and torque production in stroke survivors: an observational study. Top Stroke Rehabil. 2017;24(3):206–213. doi:10.1080/10749357.2016.1210873.
- Arts IM, Pillen S, Schelhaas HJ, Overeem S, Zwarts MJ. Normal values for quantitative muscle ultrasonography in adults. Muscle Nerve. 2010;41(1):32–41. doi:10.1002/mus.21458.
- Liu P, Wang Y, Hu H, Mao Y, Huang D, Li L. Change of muscle architecture following body weight support treadmill training for persons after subacute stroke: evidence from ultrasonography. Biomed Res Int. 2014;2014:270676. doi:10.1155/2014/270676.
- Kalyani RR, Corriere M, Ferrucci L. Age-related and disease-related muscle loss: the effect of diabetes, obesity, and other diseases. Lancet Diabetes Endocrinol. 2014;2(10):819–29. doi:10.1016/S2213-8587(14)70034-8.
- García-Bernal MI, González-García P, Madeleine P, Casuso-Holgado MJ, Heredia-Rizo AM. Characterization of the structural and mechanical changes of the biceps brachii and Gastrocnemius Muscles in the subacute and chronic stage after stroke. Int J Environ Res Public Health. 2023;20(2):1405. doi:10.3390/ijerph20021405.
- Maden-Wilkinson TM, McPhee JS, Rittweger J, Jones DA, Degens H. Thigh muscle volume in relation to age, sex and femur volume. Age (Dordr). 2014;36(1):383–93. doi:10.1007/s11357-013-9571-6.
- Wissel J, Manack A, Brainin M. Toward an epidemiology of poststroke spasticity. Neurology. 2013;80(3 Suppl 2):S13–9. doi:10.1212/WNL.0b013e3182762448.
- Jalal N, Gracies JM, Zidi M. Mechanical and microstructural changes of skeletal muscle following immobilization and/or stroke. Biomech Model Mechanobiol. 2020;19(1):61–80. doi:10.1007/s10237-019-01196-4.
- Gray V, Rice CL, Garland SJ. Factors that influence muscle weakness following stroke and their clinical implications: a critical review. Physiother Can. 2012;64(4):415–26. doi:10.3138/ptc.2011-03.
- Merkus J Reproduceerbaarheid, repliceerbaarheid en herhaalbaarheid. Scribbr. https://www.scribbr.nl/onderzoeksmethoden/reproduceerbaarheid-repliceerbaarheid2021, 22 april