
ABSTRACT
Background
Research findings on skeletal muscle degeneration in post-stroke sarcopenic obesity are limited. Thus, this study aimed to investigate the association between post-stroke sarcopenic obesity and quantitative and qualitative changes in skeletal muscles.
Methods
This was a cross-sectional study conducted on patients with stroke admitted to the convalescent rehabilitation ward. For skeletal muscle assessment, an ultrasound system was used to measure quadriceps muscle thickness and echo intensity (QMT and QEI) on the paretic and non-paretic sides. Sarcopenic obesity was defined as the presence of both sarcopenia and obesity. Multiple regression analysis was performed to determine the relationships between sarcopenic obesity and QMT and QEI.
Results
A total of 130 patients with stroke were included in this study (mean age: 69.4 ± 12.7 years). The prevalence of sarcopenic obesity was 23.1%. The multiple regression analysis showed that sarcopenic obesity was significantly negatively associated with QMT on both the paretic and non-paretic sides (paretic side: β = −0.28, p < 0.001; non-paretic side: β = −0.37, p < 0.001) and significantly positively associated with QEI (paretic side β = 0.21, p = 0.034; non-paretic side: β = 0.20, p = 0.029).
Conclusions
Post-stroke sarcopenic obesity was independently associated with quantitative and qualitative changes in skeletal muscles on both the paretic and non-paretic sides.
Introduction
Recently, sarcopenic obesity has received increasing attention in stroke rehabilitation. Sarcopenic obesity is a coexisting condition of sarcopenia and obesity. The prevalence of sarcopenic obesity has been reported to range from 2.9% to 44.9% in rehabilitation patientsCitation1,Citation2 and from 4.5% to 28.0% in patients with stroke.Citation3–5 Sarcopenic obesity is associated with all-cause mortality, fractures, cognitive decline, and frailty.Citation6–8 Furthermore, it is also associated with reduced activities of daily living (ADL) and home discharge rates in patients with stroke.Citation3,Citation5 Sarcopenia with obesity caused poorer ADL outcomes at discharge than sarcopenia without obesity in patients with stroke.Citation9
Patients with stroke have been reported to develop muscle atrophy of the lower limbs from early onset.Citation10–12 Thus, sarcopenia is considered to occur secondarily. The overall prevalence of sarcopenia in patients with stroke has been reported to be 42%,Citation13 with higher rates reported in convalescent rehabilitation wards (41.8%–57.6%).Citation14–18 Obesity is one of the risk factors for strokeCitation19 with increasing prevalence.Citation20 The prevalence of obesity in patients with stroke ranges from 14.0% to 24.3%.Citation21,Citation22 Thus, sarcopenic obesity may be observed in patients with stroke because of the comorbidity of sarcopenia and obesity.
In sarcopenic obesity, skeletal muscle mass loss and intramuscular fat accumulation are considered to be associated with decreased physical function.Citation3,Citation4 Intramuscular fat accumulates because of obesity, causing inflammation and lipotoxicity in the muscles, inhibiting muscle regeneration, muscle contractility, and muscle protein synthesis, and promoting sarcopenia.Citation23,Citation24 Furthermore, previous studies on patients with stroke have reported that muscle mass loss and intramuscular fat accumulation are negatively associated with muscle strength, walking independence, and ADL.Citation25–28 Therefore, skeletal muscle degeneration may also lead to a decline in physical function in post-stroke sarcopenic obesity. However, no studies have examined the association between post-stroke sarcopenic obesity and quantitative and qualitative characteristics of skeletal muscles, and the pathogenesis of skeletal muscle degeneration in sarcopenic obesity is unknown. Therefore, this study aimed to clarify quantitative and qualitative characteristics of skeletal muscles in post-stroke sarcopenic obesity.
Methods
Study design and subjects
This was a cross-sectional study. A total of 178 patients with stroke admitted to the convalescent rehabilitation ward between July 2021 and July 2022 were enrolled. Inclusion criteria included cerebral infarction, intracerebral hemorrhage, and subarachnoid hemorrhage in patients aged 20 years or older. Exclusion criteria included a history of stroke, coexisting orthopedic diseases of the lower limbs, surgical procedures, death, insertion of metal devices such as pacemakers, inability to understand the purpose of the study due to impaired consciousness or higher brain dysfunction, bilateral lesions, and missing data. This study conforms to the STROBE guidelines.
Participant characteristics
Participants’ characteristics, including age, sex, body mass index (BMI), diagnosis, number of days from onset of stroke to admission to the convalescent rehabilitation ward, motor paralysis, nutritional intake, and pre-morbid ADL were collected from electronic records. The presence and severity of lower limb motor paralysis were assessed by the Stroke Impairment Assessment Set Leg Motor items (SIAS-LM),Citation29 which were scored on a 15-point scale, with 5 points each for hip, knee, and ankle joint voluntariness.Citation29 Nutritional intake was assessed by the energy intake for the first three days after admission to the convalescent rehabilitation ward. Energy intake was calculated by a nurse visually by assessing the intake ratio from the amount provided to the patient, and the registered dietitian calculated the average energy intake for the first three days after admission to the convalescent rehabilitation ward. Energy intake per body weight was calculated by dividing the energy intake by the current body weight. Pre-morbid ADL was assessed using the modified Rankin scale.Citation30 Assessments were performed within one week of admission to the convalescent rehabilitation ward.
Outcomes
Skeletal muscle assessment was performed using an ultrasound system (Noblus, Hitachi, Ltd., Tokyo, Japan). Ultrasound is a low-cost, low-risk, noninvasive, portable device,Citation31 and muscle thickness and echo intensity assessed by ultrasound is associated with skeletal muscle assessed by computed tomography (CT) and magnetic resonance imaging.Citation32,Citation33 Instrument settings were set to 20 dB gain, 70 Hz dynamic range, 9.0 MHz frequency, and 7.0 cm depth for all subjects, and only the focus was set at the lower end of each muscle for each subject. The right and left quadriceps femoris were the target muscles (). The rectus femoris, vastus intermedius, and vastus lateralis muscles were drawn at the midpoint between the greater trochanter and lateral femoral condyle, and the vastus medialis was drawn at 30%.Citation34 Patients’ limbs were placed in the supine position with the hip joint in mid-extension and the knee joint in extension, and the images were taken after a resting period of at least 5 min.Citation35 Water-soluble gel was applied to the patients’ thigh, and the probe was lightly pressed perpendicularly to the thigh to avoid muscle deformation. The quantitative index of skeletal muscles was quadriceps muscle thickness (QMT), and the qualitative index was quadriceps echo intensity (QEI). QEI reflects non-contractile tissues, such as intramuscular fat and connective tissue in skeletal muscles, and is considered as a qualitative skeletal muscle index.Citation33 QMT and QEI were calculated as the average of the rectus femoris, vastus intermedius, vastus lateralis, and vastus medialis. Images were analyzed using free image analysis software (Image J, version 1.53, National Institutes of Health, Bethesda, MD, USA). Muscle thickness was measured as the linear distance from the superficial fascia to each muscle’s deep fascia or bone surface. QEI was quantified using an 8-bit grayscale with 256 shades of gray, with 0 for black and 255 for white, and the average echo intensity within the region of interest was calculated. The region of interest was set to the entire muscle belly, not including the fascia or bone. Measurements were taken three times for each muscle, and the average value was calculated. QMT and QEI were measured by a single examiner (intra-rater correlation coefficient [1. 1] = 0.98–0.99 on paretic and non-paretic sides). Skeletal muscle evaluation was performed within one week of admission to the convalescent rehabilitation ward.
Figure 1. Ultrasound images of the quadriceps muscle.
Definition of sarcopenic obesity
Sarcopenic obesity was defined as a condition where an individual has both sarcopenia and obesity at the same time. Sarcopenia was diagnosed based on the Asian Working Group for Sarcopenia 2019 diagnostic criteria.Citation36 Skeletal muscle mass was assessed by bioelectrical impedance analysis using InBody S10 (InBody, Tokyo, Japan), and the skeletal muscle index was calculated based on the appendicular muscle mass. Muscle strength was evaluated using a Smedley grip strength meter (Tsutsumi Corporation, Tokyo, Japan), and right and left-hand grip strength was measured. Grip strength was measured in the sitting or standing position, with the upper limb hanging down toward the body, depending on the patient’s physical condition. Measurements were taken twice on each side, and the maximum value was used for analysis. Sarcopenia was defined as a skeletal muscle index of less than 7.0 kg/m2 and grip strength of less than 28.0 kg for men, and less than 5.7 kg/m2 and 18.0 kg for women.Citation36 Obesity has varied diagnostic criteria. The European Society for Clinical Nutrition and Metabolism (ESPEN) and the European Association for the Study of Obesity (EASO) have reported international diagnostic criteria.Citation37 However, previous studies on Japanese patients have reported low prevalence rates and have not reached a particular view on the relationship with ADL.Citation1,Citation2 Therefore, in this study, obesity was diagnosed based on the report by Yoshimura et al.Citation2 Obesity is a body fat percentage of 30% or more in men and 35% or more in women.Citation2 This cutoff value has been reported to be associated with ADL and home discharge rate among Japanese admitted to convalescent rehabilitation wards.Citation2 Participants were classified into four groups: normal if neither sarcopenia nor obesity was present, sarcopenic obesity if both sarcopenia and obesity were present, and sarcopenia and simple obesity if only sarcopenia and obesity were present. All assessments were performed within one week of admission to the convalescent rehabilitation ward.
Sample size calculation
The sample size was calculated using G*Power 3.1. The effect size (f2) was set at 0.15, alpha error at 0.05, and power at 0.80. The number of independent variables was set to 9, resulting in a total sample of 114 participants for multiple regression analysis.
Statistical analysis
Statistical analysis was performed using IBM SPSS version 28 (IBM, Armonk, NY, USA). Parametric data were presented as mean and standard deviation, and non-parametric data were presented as median and interquartile range. The participants’ characteristics and QMT and QEI were compared between groups using the chi-square test, Fisher’s exact test, one-way analysis of variance, and the Kruskal – Wallis test. Multiple comparisons were performed using the Tukey method. Multiple regression analysis was also performed to eliminate the influence of potential confounders on the association between sarcopenic obesity and QMT and QEI. Sarcopenic obesity has two pathogenesis, sarcopenia and obesity. Therefore, to examine the association of each group with the QMT and QEI, the dependent variables were QMT and QEI, and the independent variables were simple obesity, sarcopenia, and sarcopenic obesity. Previous studies have reported age, sex, and energy intake to be related to muscle thickness and echo intensity.Citation10,Citation38–40 Pre-morbid ADL, BMI, and severity of motor paralysis may also have a relationship with muscle thickness and echo intensity. Therefore, the covariates included age, sex, BMI, energy intake, pre-morbid mRS, and SIAS-LM as factors related to QMT and QEI. Multicollinearity was assessed using the variance inflation factor (VIF). A VIF < 3 indicated no multicollinearity. The significance level was set at 0.05.
Ethical considerations
This study was approved by the Ethical Review Committee of the Akita Cerebrospinal and Cardiovascular Center (Approval No. 22–7) and conducted in accordance with the Declaration of Helsinki. Consent was obtained from the patients or their legal guardians.
Results
Of the 178 patients who were admitted to the convalescent rehabilitation ward, 48 patients were excluded based on exclusion criteria (): a history of stroke (18 patients), coexisting orthopedic disease of the lower limbs (15 patients), surgical procedures (4 patients), in-hospital death (1 patient), pacemakers or metal insertions (3 patients), impaired consciousness (4 patients), missing data (2 patients), and bilateral lesions (1 patient). Thus, a total of 130 patients were included in the final analysis (mean age: 69.4 ± 12.7 years; male: 80). The prevalence of sarcopenic obesity at admission to the convalescent rehabilitation ward was 23.1% (mean age: 76.8 ± 10.2 years; male: 19).
Figure 2. Flow diagram of participants.
shows a comparison of the basic information among the four groups. The sarcopenic obesity group was significantly older than the normal and simple obesity groups (p < 0.001). BMI was significantly different among all groups. The energy intake was significantly lower in the simple obesity and sarcopenic obesity groups than in the normal and sarcopenia groups (p < 0.001).
Table 1. Participant characteristics.
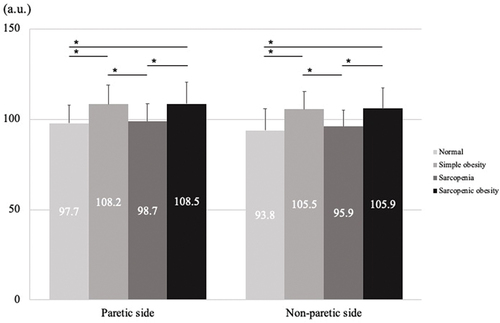
shows a comparison between QMT and QEI among the four groups. The QMT values were significantly lower in the sarcopenia and sarcopenic obesity groups than in the normal and simple obesity groups on both the paretic and non-paretic sides (p < 0.001). Conversely, the QEI values were significantly higher in the simple obesity and sarcopenic obesity groups than in the normal and sarcopenia groups on both the paretic and non-paretic sides (p < 0.001).
Figure 3. One-way analysis of variance for QMT.
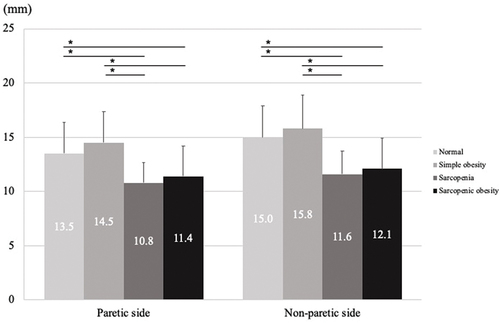
Figure 4. One-way analysis of variance for QEI.
show the results of the multiple regression analysis. The VIF was less than 3 for all variables. Furthermore, no multicollinearity was observed. Multiple regression analysis showed that sarcopenic obesity was significantly negatively associated with QMT on both the paretic and non-paretic sides (paretic side: β = −0.28, p < 0.001; non-paretic side: β = −0.37, p < 0.001) and significantly positively associated with QEI (paretic side: β = 0.21, p = 0.034; non-paretic side: β = 0.20, p = 0.029).
Table 2. Multiple regression analysis for QMT.
Table 3. Multiple regression analysis for QEI.
Discussion
In this study, the association between sarcopenic obesity and quantitative and qualitative changes in skeletal muscles was examined in patients with stroke admitted to the convalescent rehabilitation ward. The prevalence of sarcopenic obesity was 23.1%, and sarcopenic obesity was associated with low QMT and high QEI.
No consensus has been reached on the prevalence of sarcopenic obesity in patients with stroke. In this study, the cutoff value for obesity was based on a previous study on Japanese patients admitted to a convalescent rehabilitation ward.Citation2 By this cutoff value, sarcopenic obesity in the convalescent rehabilitation ward was 23.1%, meaning that approximately one in four patients had sarcopenic obesity. Currently, no clear cutoff value for the diagnosis of sarcopenic obesity has been established, and the ESPEN and EASO statements recommend screening for BMI as a preliminary step to diagnosis.Citation37 The prevalence of sarcopenic obesity based on ESPEN and EASO criteria in Japanese patients admitted to convalescent rehabilitation wards has been reported to be 4%–5%Citation1 and 4%–6%Citation5 in patients with stroke. The prevalence of sarcopenic obesity varies widely depending on whether BMI screening is performed. Therefore, further studies using various criteria are needed.
Sarcopenic obesity was associated with low QMT and high QEI on both the paretic and non-paretic sides. To the best our knowledge, this is the first study to reveal skeletal muscle degeneration in post-stroke sarcopenic obesity using ultrasound. Previous studies show that sarcopenic obesity was associated with reduced muscle quantity and quality as assessed by CT.Citation41 In addition, muscle thickness and echo intensity are significantly related to muscle quantity and quality assessed by CT and are considered quantitative and qualitative indices of skeletal muscle.Citation33 Therefore, the results of this study in patients with stroke support the findings of previous studies. Sarcopenic obesity has two pathogeneses: sarcopenia and obesity. The definition of sarcopenia includes loss of muscle mass,Citation36 and obesity causes the accumulation of intramuscular fat.Citation23,Citation24 Therefore, sarcopenic obesity was associated with low QMT and high QEI. Additionally, previous studies in the acute phase of stroke have shown a decrease in muscle thickness and a slight increase in echo intensity on both the paretic and non-paretic sides,Citation12,Citation40 and the results of this study may reflect such skeletal muscle changes in the acute phase of stroke. In healthy older adults, decreasing muscle thickness and increasing echo intensity are associated with a decline in physical functions, such as muscle strength and walking speed,Citation34,Citation42,Citation43 muscle strength, walking independence, and ADL in patients with stroke.,Citation25–28 Particularly for ADL in patients with stroke, muscle echo intensity is more involved than muscle thickness.Citation27 Additionally, muscle echo intensity is considered to represent intramuscular fat accumulation. Intramuscular fat accumulation has been reported to cause insulin resistance.Citation44,Citation45 Hyperinsulinemia is known to increase serum myostatin, which negatively affects skeletal muscle growth.Citation46 Based on the results of this study and previous studies, sarcopenic obesity after stroke may have quantitative and qualitative characteristics of skeletal muscles that can lead to decline the physical function. The results of this study will help improve understanding of the pathogenesis of skeletal muscle in post-stroke sarcopenic obesity and suggest the importance of assessment for sarcopenic obesity in stroke rehabilitation. Future longitudinal studies are needed to clarify the causal relationship between skeletal muscle changes and ADL in sarcopenic obesity.
This study has several limitations. First, this was a single-center study. Second, this was a cross-sectional study, and the causal relationship between sarcopenic obesity and skeletal muscle degeneration after stroke was unknown. Further studies on skeletal muscle changes in sarcopenic obesity are needed through high-quality prospective longitudinal studies.
Conclusions
In this study, the quantitative and qualitative characteristics of skeletal muscle in post-stroke sarcopenic obesity were examined. The results showed that post-stroke sarcopenic obesity was associated with low QMT and high QEI. The study findings demonstrate the importance of assessing sarcopenic obesity in stroke rehabilitation.
Acknowledgments
We thank staff members who helped with this study.
Disclosure statement
No potential conflict of interest was reported by the author(s).
Data availability statement
The data that support the findings of this study are available from the corresponding author upon reasonable request.
Additional information
Funding
References
- Shimizu A, Maeda K, Ueshima J, et al. Prevalence of sarcopenic obesity based on newly proposed diagnostic criteria and functional outcomes in older adults undergoing rehabilitation. Mech Ageing Dev. 2022;208:111728. doi:10.1016/j.mad.2022.111728.
- Yoshimura Y, Wakabayashi H, Nagano F, et al. Sarcopenic obesity is associated with activities of daily living and home discharge in post-acute rehabilitation. J Am Med Dir Assoc. 2020;21(10):1475–1480. doi:10.1016/j.jamda.2020.03.029.
- Matsushita T, Nishioka S, Taguchi S, et al. Sarcopenic obesity and activities of daily living in stroke rehabilitation patients: a cross-sectional study. Healthcare (Basel). 2020;8(3):255. doi:10.3390/healthcare8030255.
- Nagano F, Yoshimura Y, Matsumoto A, et al. Muscle strength gain is positively associated with functional recovery in patients with sarcopenic obesity after stroke. J Stroke Cerebrovasc Dis. 2022;31(6):106429. doi:10.1016/j.jstrokecerebrovasdis.2022.106429.
- Yoshimura Y, Wakabayashi H, Nagano F, et al. The applicability of the ESPEN and EASO-defined diagnostic criteria for sarcopenic obesity in Japanese patients after stroke: prevalence and association with outcomes. Nutrients. 2022;14(19):4205. doi:10.3390/nu14194205.
- Chuan F, Chen S, Ye X, et al. Sarcopenic obesity predicts negative health outcomes among older patients with type 2 diabetes: the ageing and body composition of diabetes (ABCD) cohort study. Clin Nutr. 2022;41(12):2740–2748. doi:10.1016/j.clnu.2022.10.023.
- Ozkok S, Aydin CO, Sacar DE, et al. Sarcopenic obesity versus sarcopenia alone with the use of probable sarcopenia definition for sarcopenia: associations with frailty and physical performance. Clin Nutr. 2022;41(11):2509–2516. doi:10.1016/j.clnu.2022.09.005.
- Someya Y, Tamura Y, Kaga H, et al. Sarcopenic obesity is associated with cognitive impairment in community-dwelling older adults: the Bunkyo health study. Clin Nutr. 2022;41(5):1046–1051. doi:10.1016/j.clnu.2022.03.017.
- Kim NY, Choi YA. Obesity impairs functional recovery of older stroke patients with possible sarcopenia: a retrospective cohort study. J Clin Med. 2023;12(11):3676. doi:10.3390/jcm12113676.
- Kokura Y, Kato M, Taniguchi Y, et al. Energy intake during the acute phase and changes in femoral muscle thickness in older hemiplegic inpatients with stroke. Nutrition. 2020;70:110582. doi:10.1016/j.nut.2019.110582.
- Kokura Y, Nishioka S. Nutritional risk indicators for predicting a change in quadriceps muscle thickness in acute patients with stroke. JMA J. 2022;5(1):62–71. doi:10.31662/jmaj.2021-0107.
- Nozoe M, Kanai M, Kubo H, et al. Changes in quadriceps muscle thickness in acute non-ambulatory stroke survivors. Top Stroke Rehabil. 2016;23(1):8–14. doi:10.1179/1945511915Y.0000000002.
- Su Y, Yuki M, Otsuki M. Prevalence of stroke-related sarcopenia: a systematic review and meta-analysis. J Stroke Cerebrovasc Dis. 2020;29(9):105092. doi:10.1016/j.jstrokecerebrovasdis.2020.105092.
- Jang Y, Im S, Han Y, et al. Can initial sarcopenia affect poststroke rehabilitation outcome? J Clin Neurosci. 2020;71:113–118. doi:10.1016/j.jocn.2019.08.109.
- Kameyama Y, Ashizawa R, Honda H, et al. Sarcopenia affects functional independence measure motor scores in elderly patients with stroke. J Stroke Cerebrovasc Dis. 2022;31(8):106615. doi:10.1016/j.jstrokecerebrovasdis.2022.106615.
- Matsushita T, Nishioka S, Taguchi S, et al. Sarcopenia as a predictor of activities of daily living capability in stroke patients undergoing rehabilitation. Geriatr Gerontol Int. 2019;19(11):1124–1128. doi:10.1111/ggi.13780.
- Shiraishi A, Yoshimura Y, Wakabayashi H, et al. Prevalence of stroke-related sarcopenia and its association with poor oral status in post-acute stroke patients: implications for oral sarcopenia. Clin Nutr. 2018;37(1):204–207. doi:10.1016/j.clnu.2016.12.002.
- Yao R, Yao L, Rao A, et al. Prevalence and risk factors of stroke-related sarcopenia at the subacute stage: a case control study. Front Neurol. 2022;13:899658. doi:10.3389/fneur.2022.899658.
- Rundek T, Sacco RL. Risk factor management to prevent first stroke. Neurol Clin. 2008;26(4):1007–1045, ix. doi:10.1016/j.ncl.2008.09.001.
- Kernan WN, Inzucchi SE, Sawan C, et al. Obesity: a stubbornly obvious target for stroke prevention. Stroke. 2013;44(1):278–286. doi:10.1161/STROKEAHA.111.639922.
- Aparicio HJ, Himali JJ, Beiser AS, et al. Overweight, obesity, and survival after stroke in the Framingham heart study. J Am Heart Assoc. 2017;6(6):e004721. doi:10.1161/JAHA.116.004721.
- Doehner W, Schenkel J, Anker SD, et al. Overweight and obesity are associated with improved survival, functional outcome, and stroke recurrence after acute stroke or transient ischaemic attack: observations from the TEMPiS trial. Eur Heart J. 2013;34(4):268–277. doi:10.1093/eurheartj/ehs340.
- Batsis JA, Villareal DT. Sarcopenic obesity in older adults: aetiology, epidemiology and treatment strategies. Nat Rev Endocrinol. 2018;14(9):513–537. doi:10.1038/s41574-018-0062-9.
- Kalinkovich A, Livshits G. Sarcopenic obesity or obese sarcopenia: a cross talk between age-associated adipose tissue and skeletal muscle inflammation as a main mechanism of the pathogenesis. Ageing Res Rev. 2017;35:200–221. doi:10.1016/j.arr.2016.09.008.
- Akazawa N, Harada K, Okawa N, et al. Relationships between muscle mass, intramuscular adipose and fibrous tissues of the quadriceps, and gait independence in chronic stroke survivors: a cross-sectional study. Physiotherapy. 2018;104(4):438–445. doi:10.1016/j.physio.2017.08.009.
- Akazawa N, Harada K, Okawa N, et al. Muscle mass and intramuscular fat of the quadriceps are related to muscle strength in non-ambulatory chronic stroke survivors: a cross-sectional study. Plos One. 2018;13(8):e0201789. doi:10.1371/journal.pone.0201789.
- Akazawa N, Kishi M, Hino T, et al. Increased intramuscular adipose tissue of the quadriceps is related to decreased activities of daily living in patients who have had a stroke. Nutrition. 2021;90:111277. doi:10.1016/j.nut.2021.111277.
- Maeda H, Imada K, Ishida K, et al. Quadriceps thickness and echo intensity predict gait independence in individuals with severe and mild hemiparetic stroke. Eur Neurol. 2020;83(2):167–173. doi:10.1159/000507548.
- Chino N, Sonoda S, Domen K, et al. Stroke impairment assessment set (SIAS): a new evaluation instrument for stroke patients. Jpn J Rehabil Med. 1994;31(2):119–125. doi:10.2490/jjrm1963.31.119.
- Banks JL, Marotta CA. Outcomes validity and reliability of the modified Rankin scale: implications for stroke clinical trials: a literature review and synthesis. Stroke. 2007;38(3):1091–1096. doi:10.1161/01.STR.0000258355.23810.c6.
- Sheean P, Gonzalez MC, Prado CM, et al. American society for parenteral and enteral nutrition clinical guidelines: the validity of body composition assessment in clinical populations. JPEN J Parenter Enteral Nutr. 2020;44(1):12–43. doi:10.1002/jpen.1669.
- Mechelli F, Arendt-Nielsen L, Stokes M, et al. Validity of ultrasound imaging versus magnetic resonance imaging for measuring anterior thigh muscle, subcutaneous fat, and fascia thickness. Methods Protoc. 2019;2(3):58. doi:10.3390/mps2030058.
- Watanabe Y, Ikenaga M, Yoshimura E, et al. Association between echo intensity and attenuation of skeletal muscle in young and older adults: a comparison between ultrasonography and computed tomography. Clin Interv Aging. 2018;13:1871–1878. doi:10.2147/CIA.S173372.
- Rech A, Radaelli R, Goltz FR, et al. Echo intensity is negatively associated with functional capacity in older women. Age (Dordr). 2014;36(5):9708. doi:10.1007/s11357-014-9708-2.
- Lopez P, Pinto MD, Pinto RS. Does rest time before ultrasonography imaging affect quadriceps femoris muscle thickness, cross-sectional area and echo intensity measurements? Ultrasound Med Biol. 2019;45(2):612–616. doi:10.1016/j.ultrasmedbio.2018.10.010.
- Chen LK, Woo J, Assantachai P, et al. Asian working group for sarcopenia: 2019 consensus update on sarcopenia diagnosis and treatment. J Am Med Dir Assoc. 2020;21(3):300–307 e2. doi:10.1016/j.jamda.2019.12.012.
- Donini LM, Busetto L, Bischoff SC, et al. Definition and diagnostic criteria for sarcopenic obesity: ESPEN and EASO consensus statement. Obes Facts. 2022;15(3):321–335. doi:10.1159/000521241.
- Caresio C, Molinari F, Emanuel G, et al. Muscle echo intensity: reliability and conditioning factors. Clin Physiol Funct Imaging. 2015;35(5):393–403. doi:10.1111/cpf.12175.
- Fukumoto Y, Ikezoe T, Yamada Y, et al. Age-related ultrasound changes in muscle quantity and quality in women. Ultrasound Med Biol. 2015;41(11):3013–3017. doi:10.1016/j.ultrasmedbio.2015.06.017.
- Kokura Y, Kato M, Kimoto K, et al. Relationship between energy intake and changes in thigh echo intensity during the acute phase of stroke in older patients with hemiplegia. Med Princ Pract. 2021;30(5):493–500. doi:10.1159/000517950.
- Cho YK, Jung HN, Kim EH, et al. Association between sarcopenic obesity and poor muscle quality based on muscle quality map and abdominal computed tomography. Obesity (Silver Spring). 2023;31(6):1547–1557. doi:10.1002/oby.23733.
- Akima H, Yoshiko A, Tomita A, et al. Relationship between quadriceps echo intensity and functional and morphological characteristics in older men and women. Arch Gerontol Geriatr. 2017;70:105–111. doi:10.1016/j.archger.2017.01.014.
- Fukumoto Y, Ikezoe T, Yamada Y, et al. Skeletal muscle quality assessed from echo intensity is associated with muscle strength of middle-aged and elderly persons. Eur J Appl Physiol. 2012;112(4):1519–1525. doi:10.1007/s00421-011-2099-5.
- Barazzoni R, Bischoff SC, Boirie Y, et al. Sarcopenic obesity: time to meet the challenge. Clin Nutr. 2018;37(6 Pt A):1787–1793. doi:10.1016/j.clnu.2018.04.018.
- Hong SH, Choi KM. Sarcopenic obesity, insulin resistance, and their implications in cardiovascular and metabolic consequences. Int J Mol Sci. 2020;21(2):494. doi:10.3390/ijms21020494.
- Tanaka M, Masuda S, Yamakage H, et al. Role of serum myostatin in the association between hyperinsulinemia and muscle atrophy in Japanese obese patients. Diabetes Res Clin Pract. 2018;142:195–202. doi:10.1016/j.diabres.2018.05.041.