
 ?Mathematical formulae have been encoded as MathML and are displayed in this HTML version using MathJax in order to improve their display. Uncheck the box to turn MathJax off. This feature requires Javascript. Click on a formula to zoom.
ABSTRACT
Water, energy, and food (WEF) security has become a key area of research in sustainable development. Prompted by the United Nations’ Sustainable Development Goals, a large body of research highlights the inter-connectedness of WEF systems and the dangers of their siloed treatment. Simultaneously, more attention is being placed on the WEF security of remote populations in the Arctic, especially for areas like Alaska, where WEF insecurities are prevalent, yet obscured by national reporting. This research developed a WEF Nexus Security Index for the state of Alaska that can be used by policy-makers to consider plausible causes for regional inequalities and why some regions of Alaska, and not others are exposed to higher levels of WEF insecurity. Beyond the conceptual value of the index, an on-line Arctic WEF Nexus Security portal was developed that further enables policy-makers and community leaders to track changes in WEF security and monitor the effects stemming from future interventions, be they policy or technological in nature. By bridging nexus thinking and nexus doing, we hope to provide policy-makers with a novel and accessible tool for achieving WEF security in Alaska.
Introduction
In 2019, the Global Index for Water, Energy and Food (WEF) Security was released (www.wefnexusindex.org). The Global Index for WEF Security was born from the recognition that WEF systems are inherently interconnected and trying to improve the security of one sector will have implications for the others. The Global WEF Security Index serves as a means of integrating WEF sectors, which are often measured in different units and time scales, into a single composite score (Simpson et al., Citation2022). For example, based on the ranking of 181 nations, Iceland was ranked 1st globally in their WEF security whereas St. Vincent and the Grenadines was ranked at the opposite end of the security continuum (for Nations with available WEF data). The objective of the global ranking is not to disparage lagging nations but rather to make visible the areas in which disparities exist, which can then be used to inform policy actions that lead to equity in WEF security among all nations (Simpson et al., Citation2022).
As valuable as these national rankings are, they do obscure the variability that can exist within nations, for example between rural and urban settings, or in remote regions with numerically small populations. In these cases, the regional variability that may exist can be concealed in national reporting. This in turn can challenge mitigation efforts that could potentially alleviate regional and sub-regional inequalities that would otherwise go unobserved. For this reason, McGrane et al. (Citation2018) have stressed the need for more targeted nexus studies capable of identifying sub-national inequalities, which can be used for more focused interventions. It is in this context that we set out to develop a WEF nexus security index for the State of Alaska in the United States.
The focus on Alaska was motivated by two factors. First, the United States (US) ranks 5th globally in its WEF security (Simpson et al., Citation2020a). However, Alaska has been characterized as a region challenged by high rates of WEF insecurity relative to the US national averages (Hicks, Citation2017; Quinn, Citation2021). For example, the estimated rate of food insecurity in the United States is 10.2% (USDA, Citation2023) whereas some regions (interior) of Alaska report rates of food insecurity as high as 22% (Feeding America, Citation2019). Alaska is also among US states with the highest dependence on energy imports (Murkowski & Scott, Citation2014). Alaska’s rural communities also suffer from frequent incidences of contaminated water stemming from poorly designed wastewater disposal systems (Alaska Department of Environmental Conservation, Citation2008). However, due to the state’s small population (est. pop. 732,673) relative to the continental US (est. pop. 331 million) (United States Census Bureau, Citation2023), the WEF insecurities of Alaska are obfuscated by national averages. This is particularly true for 60% (439,604) of the population that lives outside the state’s most populated centers (Anchorage, Fairbanks, Juneau), including those who reside in one of the 229 Alaska Native villages dispersed across the state (United States Census Bureau, Citation2023). Hennessy and Bressler (Citation2016) acknowledge this disparity and note that the high rates of insecurity in Alaska can be hard to discern due to the national estimates that mask the substantial service inequalities in the state. By focusing on Alaska, this research makes visible the disparities that exist between Alaska and US as well as the regional variability that exist within the state.
The second factor that motivated this research was its inclusion in a larger international study supported by the Arctic Council’s Sustainable Development Working Group (SDWG). Collaborators on the project include research teams from Canada, Iceland, Finland, Sweden, and Norway who are conducting similar regional assessments in their respective countries. As noted by the Chair of the SDWG, WEF insecurity is a challenge faced by all Arctic Nations, and the benchmarking of security conditions is a necessary first step to advance WEF security from an aspirational to a transformative policy agenda across the Arctic (Arctic Council, Citation2020). The inclusion of Alaska therefore makes an important contribution towards pan-Arctic representation.
Following this introduction we provide a description of our study area, including Alaska’s economic conditions and brief descriptions of its five geographical subregions. We then discuss our methodology, including the procedures used to establish the Alaska WEF Nexus Security Index. Our results are then presented followed by a discussion of the inter-regional differences found, and potential causes and implications. Our discussion also describes the practical application (nexus doing) that arose from the index findings (nexus thinking). We conclude with a brief summary. Our ultimate goal is to offer practical tools that can be used to mitigate the WEF insecurities found in Alaska.
Study area
Alaska officially joined the United States as a territory after it was purchased from Russia in 1867. At a cost of $7.2 million USD (2 cents per acre), or roughly $125 million in current dollar terms, the purchase of Alaska was criticized by some US politicians who questioned the economic value that such a remote and barren land could provide (Golder, Citation1920). Despite initial reticence, Alaska has since proven its financial, as well as its strategic worth many times over (Cook, Citation2011).
Alaska’s economic significance has been demonstrated most notably through the production of oil and gas from the Prudhoe Bay Oil Fields, which at its peak (1989) produced as much as two million barrels per day (bpd) and has since averaged 500,000 bpd (AKRDC, Citation2023b). This production has generated over $180 billion in state tax revenue (AKRDC, Citation2023b). Despite slowdowns in domestic energy production, oil and gas revenues continue to be Alaska’s largest source of unrestricted income ($2.7 billion in 2019). Beyond the energy sectors, Alaska’s fisheries provide direct employment for 58,700 people, with an additional 10,000 secondary jobs, and generate more than $5 billion in economic activity annually across the state (AKRDC, Citation2023a). These and other resource related sectors, such as forestry, mining, and tourism, remain the cornerstone of the Alaskan economy (Greenberg, Citation2008).
Notwithstanding the resource revenues that are generated in Alaska, the Alaskan economy shows some of the poorest performance (relative to the other states) in the US. In a 2022 report prepared by the University of Alaska Center for Economic Development, Klouda (Citation2022), found that Alaska has underperformed relative to US national averages in nearly all areas of the economy. For example, whereas the US, until 2022, had experienced employment growth, Alaska’s employment declined by 8%. In fact, Alaska shows the second-highest rate of employment decline of all states in the US, surpassed only by North Dakota (−8.4%). This decline occurred during the same period where the US GDP grew by 12.8%. These conditions have contributed in part to a net migration rate of −8.8 per 1000 residents, which is the lowest among all US states, and is forecasted to continue until the state makes significant investments in its public services (Klouda, Citation2022). This includes public investment to reduce the high rates of WEF insecurity experienced across the state (ERS, Citation2021; Feeding America, Citation2019).
Geographically, the State of Alaska covers over 1.7 million km2, making it the largest state in the US. The state’s population is 732,673 residents, with nearly half (357,803) residing in the regional centers of Anchorage (pop. 292,545), Fairbanks (pop. 33,018), and the capital city of Juneau (pop. 32,240). The remaining population resides in relatively small and remote communities, including 229 federally recognized Alaska Native Villages that are dispersed across the state (United States Census Bureau, Citation2023).
Alaska is divided into five regions: Far North, Interior, Southcentral, Southeast, and Southwest (). However, there are no administratively defined demarcations between regions, rather regions are spatially distinguished by major river drainages and mountain ranges. For example, the Far North, also known as the North Slope, extends north from the Brooks Mountain Range and is the only region of the state that extends north of the Arctic Circle. In terms of geography, the Far North is the largest of the state’s five regions yet is the least populated. Road access to the Far North consists exclusively of the Dalton Highway, which was built in 1974 to support oil production in the Prudhoe Bay oil fields. The Dalton Highway extends 666 km north from Fairbanks to Deadhorse, near the Arctic Ocean.
Figure 1. Study area of Alaska and its five regions.
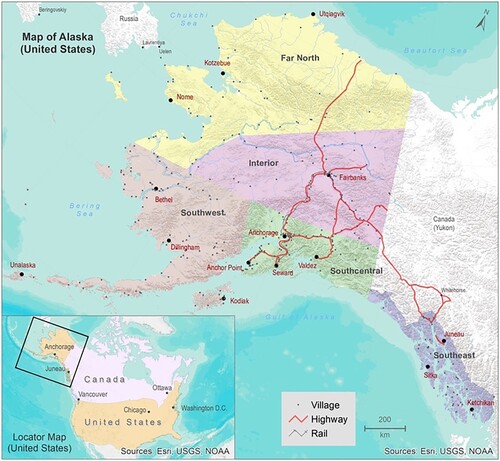
The interior region is demarcated in the north by the Brooks Mountain Range and the Alaska Mountain range to the south. The Yukon River bisects the interior region, which extends 3190 km from the Bering Sea, through the Yukon Flats, and into Yukon, Canada. The southcentral is the most populated region of the state, with Anchorage being home to nearly 40% of the state’s population. Also located in southcentral region are the cities of Wasilla and Palmer, which are located north of Anchorage in the Matanuska-Susitna Valley, which is considered Alaska's agricultural heartland (WRCC, Citation2022). The southeast region includes the state’s capital of Juneau. Like the other communities in the southeast region, Juneau is accessible by air or water only. Much of the southeast region is designated as the Tongass National Forest, which includes 16.9 million acres of protected land. Last, is the southwest region, which includes the Aleutian Islands that stretch 1,609 kilometers into the Pacific Ocean towards Asia. The southwest region is also home to Bristol Bay, which serves as the world’s most important sockeye salmon fishery (Oncorhynchus nerka) (EPA, Citation2022).
Methodology
Global WEF Nexus Security Index
The development of WEF nexus composite indices has gained prominence in national policy making (Nhamo et al., Citation2020; Shu et al., Citation2021). The value of composite indices rests in their statistical compilation of multiple indices to create a single and overall representation (Fernandez-Rios et al., Citation2021). The Global WEF Nexus Security Index is notable among composite indices. Launched in 2019, the Global WEF Nexus Security Index has provided quantitative and transparent estimations of national-level WEF security scores based on a common set of indicators (Simpson et al., Citation2020a). The Global WEF Nexus Security Index was derived from a statistical audit of 60 global indices, including the Environmental Performance Index, the Multidimensional Poverty Assignment Tool, UN International Fund for Agricultural Development, the Global Competitiveness Index, and the Corruption Perceptions Index. Additional WEF indicators were drawn from national statistical offices and international organizations such as the World Bank, International Energy Agency (IEA), Food and Agriculture Organization of the United Nations (FAO), and the World Health Organization (WHO). Based on this review, 87 potential indicators were selected and were further screened for data availability, reliability, and global coverage. For example, to be considered for inclusion in the Global WEF Security Index, an indicator required a minimum of 65% of all countries to have comparable and comprehensive data (Saisana et al., Citation2018). Based on these conditions, together with a correlation analysis to identify possible aggregation issues or double-counting (Simpson et al., Citation2020a), 21 indicators were selected. These include 7 indicators for water security, 6 indicators for energy security, and 8 indicators for food security. Each of the WEF pillars is further delineated by access and availability sub-pillars as shown in . As defined by Simpson et al. (Citation2020a) availability reflects the physical presence of water, energy, or food resources, while accessibility relates to their distribution (equitable or not). For example, water availability is partially indicated by average precipitation, which can reveal how much water is available in the overall system whereas water access is partially indicated by the percentage of people using basic drinking water sources. Now in its fourth iteration (2019–2022), the Index has proven successful at tracking country-level change, which allows for the benchmarking of security improvements (Simpson & Jewitt, Citation2019) .
Table 1. WEF Indicators and their weighting (adapted from Simpson et al., Citation2020b).
Data collection
To locate WEF indicator data for Alaska, State Agency Databases were reviewed, including the Alaska State Government’s Division of Community and Regional Affairs (DCRA) Open Data, Alaska Census, Planning and Land Management, and Subsistence Searchable Databases. Additional searches included federal data repositories in the US Department of Agriculture, US Department of Energy, US Census, and US Geological Survey.
Following the data validation procedures used by Bogdan et al. (Citation2023), all data were assessed on their completeness, timeliness, granularity, and credibility. For example, in terms of timeliness, the WEF data used to calculate the composite score for Alaska ranged from 2015 to 2021, but some regional data required more temporal lenience, with dates ranging from 2011 to 2021. When a suitable substitute indicator could not be found, or failed to meet quality control conditions, the indicator was excluded. This was the case for two indicators – average precipitation and percentage of children under 5 years of age who are stunted. In all other cases, sufficient data were found, with 90.5% of indicator data found for Alaska and 81–85.7% of data found the sub-regions (). As in the case of the Global WEF Nexus Security Index, our methodology allows for substitutions/exclusions, with the condition that 65% of indicators are used in the calculations per the guidance of Simpson et al. (Citation2020a), which was satisfied for the state and each of the five regional scores.
Data analysis
To calculate the WEF security index scores for Alaska and its subregions, the Composite Indicator (COIN) tool developed by the European Commission’s Competence Centre on Composite Indicators and Scoreboards was used. The COIN Tool is licensed under the Creative Commons allowing its use if the conditions of the Creative Commons are followed. Those conditions are that a person can share and adapt the material and must acknowledge the original source, use the material only for non-commercial purposes, and to share alike so that contributions can benefit the use of others (Simpson et al., Citation2020a).
Respecting these conditions, the COIN Tool was used to treat and normalize the WEF data into a uniform scale using a min–max method. Outliers are treated if any are found to be outside the generally accepted range of |<2| skewness and |<3.5| kurtosis of an indicator’s data set. The averages of each sub-pillar are calculated with the WEF pillar score being the average of their two sub-pillars. The overall WEF Nexus Index score is the average of the WEF pillar scores on a 0–100 scale with 100 being the highest possible score. As each pillar and sub-pillar has an unequal number of indicators, an equal weighting is applied to preserve the integrity of the WEF nexus approach, such that each resource sector is considered to have equal importance (Simpson et al., Citation2020a). The final weights used here are consistent with those of Simpson et al. (Citation2020a) in to preserve replicability.
The arithmetic mean is used to calculate the scores as it accommodates the substitutability and compensability of the indicators (Simpson et al., Citation2020b). Mathematically, the methodology can be described as shown in Equation (1): First, data are normalized for the state/region (i) and for each indicator (j) using the min–max method (Equation (1)) where the xmin and xmax represent the minimum and maximum values of indicator (j) across the entire sample, xobs representing the found indicator, and then multiplied by 100 as seen in Equation (2). All equations follow Ingram et al. (Citation2021)’s study.
(1)
(1)
(2)
(2)
This normalization converts all the data in the sample to a uniform, unit-less scale from 0 to 100, allowing for aggregation across indicators and subsequent ranking. As described above, each sub-pillar (SPi) of access and availability for water, energy, and food for each of the state and regions is then calculated as the weighted arithmetic average of the calculated normalized indicator values:
(3)
(3)
All indicators are weighted in such a way as to contribute equally to the overall WEF Index score so wj is the assigned weight of indicator j with the exact weights reported in and n is the number of indicators within the sub-pillar. The sum of wj through wn for each sub-pillar is 1/6 so that all sub pillars contribute equally to the arithmetic average of the overall WEF Nexus Index number. The WEF pillar scores for water (WP), energy (EP), and food (FP) are then calculated as the arithmetic average of their access and availability sub-pillars.
(4)
(4)
(5)
(5)
(6)
(6)
Table 2. Coverage of WEF indicators.
Finally, the WEF Nexus Index (WNI) score for the state/region i is then calculated as the arithmetic average of each of its pillars (WP, EP, FP):
(7)
(7)
Research oversight
This research benefited from the involvement of the Social, Economic and Cultural Expert Group (SECEG) that served as a Project Advisory Committee. SECEG is the science advisory committee to the SDWG and is composed of social scientists and Indigenous knowledge holders from all Arctic Council member states. While Covid and the self-imposed pause of the Arctic Council following Russia’s invasion of Ukraine limited our opportunities for in-person engagement, we were nonetheless able to communicate remotely with SECEG representatives and receive important direction on our methods, deliverables, and policy communication strategies.
To further ensure our research would reflect the interests of Indigenous communities, an Indigenous Steering Committee (ISC) was formed with representatives of the Arctic Athabaskan Council (AAC) and Inuit Circumpolar Council (ICC). As Permanent Participants of the Arctic Council, the involvement of AAC and ICC was critical for ensuring our methodology was sound, our approaches were collaborative, and our research findings would be disseminated in ways that are most relevant to the real-world needs of Arctic resident.
Results
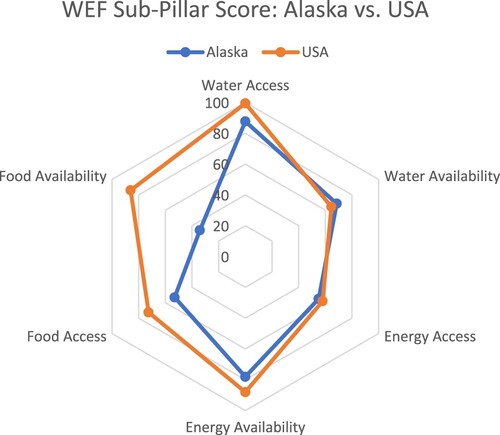
In the Global WEF Nexus Security Index, the United States was ranked 5th globally with an overall WEF security score of 78.08 (out of possible 100). This score was derived from sub-index scores of 81.95 for water, 73.01 for energy, and 79.28 for food. The results of this research found that Alaska’s WEF index is 62.73, which is approximately 16 points below the US WEF Security score, with sub-index scores ranging from 3.87 to 35.73 points lower than the US. Notwithstanding the overall WEF index deficit, Alaska is performing comparable to the US in its Water (−3.87) and Energy (−6.48) pillars, whereas the greatest variability was found in Alaska’s Food sub-index, which is 35.73 points lower than the US.
While some similarities were found between US and Alaska water and energy sub-pillars, important differences can be observed. For example, the US reports near universal access to water (99.37) yet Alaska’s water access score is 87.66 (11.71 below US), despite water availability exceeding the US score by 4.01. The lower water access score can be attributed to inadequate water delivery and treatment systems across the state (ACEP, Citation2022; Sohns, Citation2020). Alaska’s energy security is also constrained more by accessibility (54.98) than availability (78.05). Alaska has an energy-intensive economy and is one of the largest producers of oil and natural gas in the US (EIA, Citation2022). Yet despite being a significant energy producer, most energy resources are not available to Alaska communities due to limited refinement and distribution capacity to satisfy in-state demand. For much of Alaska, the energy being produced in-state is inaccessible to most rural communities, requiring substantial energy imports. The most significant disparity between Alaska and the US was found in food security. The Food sub-index for Alaska was calculated to be 43.55, or more than 35 points below the US sub-index (79.28). Whereas Alaska food access is considerably lower than the US (19.53), Alaska’s food availability is markedly lower (35.73). Unlike with water and energy security, the low food score would appear to show the greatest weakness in availability rather than access. This score can be attributed to the fact that Alaska imports 95% of its food (ACEP, Citation2022), at an estimated annual cost of $2 billion (Alaska Office Governor’s, Citation2022). shows the divergence between Alaska and US WEF sub-pillar scores.
Figure 2. Radar chart of the WEF sub-pillar scores for Alaska and the USA.
Regional variability
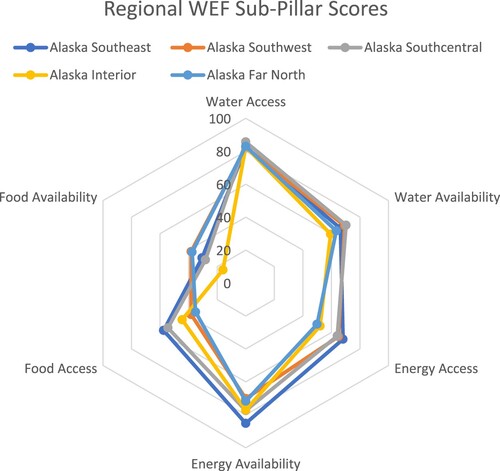
Whereas significant differences were found between Alaska and the continental US, inter-regional differences were also found within the state. highlights these regional differences, most notably in food availability, food access, and energy access. These differences can be attributed to a host of economic, political, and ecological constraints that limit the access and availability of WEF resources to Alaska communities. Here again, access refers to the equitable distribution whereas availability relates to the physical presence of the WEF resources.
Figure 3. Radar chart of the WEF sub-pillar scores for Alaska’s regions.
Water insecurity
It is estimated that 50% of Alaska’s population sources its water from groundwater reserves, including 83% of public and 90% of private drinking water systems (Alaska Department of Environmental Conservation, Citation2008). In some regions (e.g. Far North) environmental conditions, such as permafrost limit water availability (Alaska Department of Environmental Conservation, Citation2008). In these cases, communities rely on truck delivery or require residents haul water from distribution centers or watering points (Reiff, Citation2014).
With only 58% of communities in Alaska having household piped water and wastewater systems (Hennessy & Bressler, Citation2016), many residents without these systems must rely on rudimentary sewage systems that lack treatment capacity such as ‘honey bucket’ and lagoon disposal systems. Even in communities with piped water systems, honey buckets and lagoons are commonly used (Reiff, Citation2014). For example, across the Far North region, 45% of households in 17 communities are not served by piped, septic, or well systems. In these cases, households haul their own water from community watering points and transport and dispose household waste in sewage lagoons (ITK, Citation2021). For one community of roughly 250 residents, this involves transporting bags/buckets of waste up to 5 miles to the community’s overfilled waste lagoon, which negatively impacts the water access score (Rosen, Citation2021).
Communities that lack water and wastewater services use considerably less water than households in urban centers or communities with piped services. Hennessy and Bressler (Citation2016) found Alaska households without piped water systems use roughly 5.7 L per day, well short of the WHO standard of 20 L or the US household average of 302–379 L (Sohns, Citation2020). Even among other Arctic countries that face similar infrastructure and weather-related challenges, Alaskan households use considerably less water due to a lack of access, for example compared to northern Greenland where households average ∼35 L of daily water use (Sohns, Citation2020).
The lack of adequate infrastructure and in-home water services has contributed to poor health (Penn et al., Citation2017), including increased incidences of hepatitis A and B and other enteric diseases (Fusco et al., Citation2019). For example, in the southwest region, inadequate water infrastructure has been attributed to respiratory syncytial virus outbreaks and other respiratory problems that are especially severe for babies and young children (Rosen, Citation2021). These health concerns have spurred boil water advisories (BWA) in more than 34 rural communities across the state, with more than a third remaining in place for more than a year (ITK, Citation2021). In the absence of investment by the state, communities will likely have to absorb the high social, economic, and health related burdens of water insecurity (Sohns, Citation2020) – a requirement some say reflects the state’s prioritization of economic prudence over public health or equity (Penn et al., Citation2017).
Energy insecurity
As in the case of water, Alaska’s energy security is constrained more by accessibility (54.98) than availability (78.05). Alaska has an energy-intensive economy and is one of the largest producers of oil and natural gas in the United States (EIA, Citation2022). According to the US Energy Information Administration (EIA, Citation2022), Alaska’s energy production is generated largely from non-renewable sources, including natural gas (42%), petroleum (16%), and coal (12%). The remaining 31% of energy production is generated from hydroelectric (28%) and other renewables (3%). While Alaska is a significant producer of energy, Alaska also ranks fourth among US states in energy consumption and third nationally in gross natural gas withdrawals (EIA, Citation2022).
There is, however, regional variability in energy access and availability. For example, in the southcentral region, communities are serviced by the Railbelt electrical grid. Extending from the Kenai Peninsula in the south to Fairbanks in the north, the Railbelt accounts for roughly 80% of the state’s electric energy output (EIA, Citation2022). The Railbelt is, however isolated from other electric grids, both in Canada and the continental US, and relies on fossil fuels for approximately 80% of its electrical generation, with the remaining 20% derived from hydropower (Denholm et al., Citation2022). The Southcentral region also benefits from the Cook Inlet natural gas fields, which is supported by over 4828 km of pipelines that service regional communities (REAP, Citation2020). Together these sources of energy contribute to a relatively high Energy Sub-Index score (70.78) for the Southcentral region. The other region of note is the southeast region where the availability of energy (85.19) is being met from four hydroelectric dams that produce 76 MW of electricity annually. It is estimated that the power generated from hydroelectric sources has offset the use of 20 million gallons of diesel annually (REAP, Citation2020).
For other regions of the state, and particularly in rural communities, energy needs are met largely from diesel, most of which is barged to Alaska from suppliers in the continental US (REAP, Citation2020). This is particularly problematic for rural communities that are essentially ‘islanded’ and forced to rely on diesel to power local microgrids (ACEP, Citation2022). This type of dependence places Alaska in the company of other energy exporting nations that lacks the necessary infrastructure, policies, or political will to ensure the energy needs of its residents are being met (Hossain et al., Citation2016). The implications likely mean a continued dependence on non-renewable energy sources and a continuation of energy insecurity in rural communities.
Food insecurity
As noted above, most of Alaska’s foods are imported and arrive by air and water. These transportation networks are subject to disruptions in global supply chains, transportation and labor disputes, rising energy costs, geopolitical uncertainty, and the seasonal and weather-related conditions unique to Alaska’s northern environment (Sohns, Citation2020). Road shipments have proven vulnerable to delays, for instance the 2018 earthquake and the 2022 flooding that damaged and closed the Alaska Highway for extended periods. As the only land route to and from Alaska, natural hazards such as these serve as formidable challenges to maintaining a robust road transportation network to Alaska, which negatively impacts food access (Zak, Citation2018). Further challenging food availability is the fact that most communities in Alaska are not connected to the road system, which means additional air or water transport is required. These transportation constraints add considerably to time and costs, which further affect food availability (Sohns, Citation2020). While vulnerable to disruptions, the southcentral region benefits from road, rail, and reliable sea shipments. Other regions of the state, most notably the interior, rely on air transport, which are subject to weather delays, compromised food quality, and added costs associated with storage and shipment.
Although some agricultural production does occur in the southcentral region (Matsu Valley), growing seasons are short (est. 80−110 days) (WRCC, Citation2022), while the costs of production are high (labor, inputs, transports) (Meter & Goldenberg, Citation2014). These constraints limit the potential for growth in the agricultural sector, making food imports the most cost-effective strategy to meet local food needs. Whereas availability constrains the southcentral region due to little agricultural production, food accessibility is the most significant constraint in the southeast and southwest regions. Both regions enjoy thriving commercial fisheries that provide direct employment for 58,700 people, with an additional 10,000 secondary jobs, and generate more than $5 billion in economic activity annually across the state (AKRDC, Citation2023a). In terms of commercial harvest, the fishery processes an average of 160 million fish annually. However, most of that harvest is exported to the continental US or other international markets, making much of the harvest unavailable to Alaskan consumers (Meter & Goldenberg, Citation2014). Whereas salmon and other wild food sources are also procured through sport and subsistence harvesting, opportunities are also constrained by the economic costs of harvesting, subsistence policies that prioritize rural residents, and environmental changes that influence the seasonal and spatial availability of wild food sources (Fall & Kostick, Citation2018). These conditions have led Meter and Goldenberg (Citation2014) and Fall and Kostick (Citation2018) to conclude that Alaska’s high rate of food insecurity is due to a combination of factors, including limited capacity to produce commercial and subsistence-based foods, an overreliance on food imports, and the costs and logistical constrains associated with servicing the state’s remote and isolated population.
below shows the calculated WEF index scores for the US, Alaska, and each of the five sub-regions. To aid in visualization, scores are shown by a color gradient, with green representing the 90th percentile, yellow the 50th percentile, and red the 10th percentile of scores. As shown, US scores are almost entirely in the 90th percentile (green), whereas Alaska has only three scores in this range.
Table 3. Heat Map of National, State, and Regional WEF security scores.
Discussion
In developing a WEF security index for Alaska, we were aware that condensing Alaska and its region’s WEF security into a single composite value is not unproblematic. Santeramo (Citation2015), for example, has warned that composite indices are most often left to the discretion of the developer who chooses the most appropriate indicators, thereby influencing the findings and ultimately the conclusions drawn. This is particularly true in the case of food security, where various indices employ different indicators that often lack reliable and accessible data (Saisana, Citation2004). We acknowledge that data availability, particularly for measuring food security in Alaska, required adjustments. Yet such adjustments are not uncommon in cases where heterogeneous data are used to track multiple indicators (Deléglise et al., Citation2022). In our case, data availability required the exclusion (N = 1) and substitution (N = 3) of four food security indicators. This included the percentage of children under 5 years of age who are stunted (Indicator 16), which is defined as impaired growth and development that children experience from chronic, long-term nutritional deficiencies (World Health Organization, Citation2015). However, Alaska and the US do not track child stunting rates. Nor could we identify an acceptable proxy for substitution. For this reason, the stunting indicator was excluded from our analysis. Substitutions and adjustments were needed for three other food security indicators. Data on the prevalence of undernourishment and the percentage of children under five affected by wasting (sometimes referred to as acute malnutrition) were also not available (Indicator 15). However, data reflecting the rates of food insecurity among children under five are available and was deemed to be an appropriate substitute. In another case, cereal production (Indicator 19), which is of marginal consequence to the food security needs of Alaska residents, was substituted with subsistence harvest data (e.g. harvest and consumption of country foods), where cereal yield (kg/hectare) was replaced with wild harvest yield by kg of consumable food weight per capita (Fall & Kostick, Citation2018). The inclusion of subsistence harvest data is more in keeping with Indigenous and rural Alaskan ways of life (Fall, Citation2016), and proved to be a more accurate measure of food production. For Average Protein Supply (Indicator 18) and Average Dietary Energy Supply Adequacy (ADESA) (Indicator 20), data were re-calculated in a similar fashion where the average value of food production was based on agriculture, wildlife harvesting, and commercial fisheries production values. This adjustment resulted in a more accurate assessment of protein and dietary energy supply than had we considered cereal production alone. Our decision to substitute some indicator data for others does not negate its overall value. Rather our adjustments proved successful in demonstrating that the high rate of food insecurity in Alaska is attributable to both access and availability constraints. As imperfect as these indicators may be, they have nonetheless allowed for calculated estimations to be made, which can now be used by policy-makers to explore targeted interventions.
Another concern raised about national and global indices is their inability to capture the social and political dimensions that influence WEF security. In fact, McGrane et al. (Citation2018) and others (Santeramo, Citation2015; Munda & Nardo, Citation2009) have questioned the practical value of global and national indices, where abstractions can lead to uncertainty and inaction (Kaiser et al., Citation2021), or worse to the conclusion that a single solution or mitigation strategy is suitable for all scales. Others have been more adamant about the potential risks of indices, arguing that simplistic comparisons that are used to create rankings can cause stigma for those deemed less secure, which can lead to undesirable and unintended outcomes (Schmidt et al., Citation2022). A more effective strategy, according to opponents, is to conduct local level analyzes. For example, Schmidt et al. (Citation2022) sought to understand how residents of Cordova (population 2528), Kongiganak (population 478), and Igiugig (population 60), perceive their own availability, access, preference, and quality of WEF resources. In their research, 114 residents (4% of population) were asked to respond to 35 statements that reflected each WEF sector and each of the four security dimensions. The response to these statements involved a Likert scale from 1 (very low security) to 5 (very high security) to identify which WEF sector was considered the most/least secure in their respective communities. Despite some areas of consensus, significant pairwise differences were found in 26 of the 35 statements. According to Schmidt et al. (Citation2022), this variability demonstrates the heterogeneity that exists between rural Alaska communities, which can be obscured in regional or state-wide aggregation.
We too agree that local or community-level analyzes provide important context for understanding how WEF insecurities are experienced locally. However, community-level analyzes are not without their own limitations. For example, the replication of community-level studies, which is necessary to monitor change, would be difficult to achieve. The constraints, including financial costs, time, and participatory burden if an adequate sample is achieved, may limit the possibility for longitudinal tracking and scalability. The use of subjective measurements, such as experience-based insecurity scales that use direct responses, are also subject to bias and misreporting due to unobservable social desirability effects (Tadesse et al., Citation2020). Self-reported questions pertaining to household food insecurity in particular risk misreporting when implemented through direct interviews. For example, questions that directly ask respondents if they experience food shortages force respondents to weigh the social implications of their response (i.e. potentially overstating security to avoid shame and protect pride). In cases where respondents experience frequent food or cash shortfalls, they may be inclined to misreport actual conditions (Tadesse et al., Citation2020). These biases can then misrepresent local WEF conditions and propagate misdirected policy responses. The Alaska WEF Nexus Security Index was developed to overcome these limitations by making visible regional disparities, which can then be used as a starting point for policy-makers to consider the causes of regional inequalities. This represents a form of nexus thinking that can serve as an entry point for understanding the scalar dimensions of WEF security in Alaska. Used in this way, the index can promote dialogue among policy-makers and local officials who together can explore regional or community-specific interventions (Naidoo et al., Citation2021).
While the conceptual value of WEF nexus is considerable, it is not mutually exclusive from equally important analytical applications. As noted by Naidoo et al. (Citation2021) the operationalization of WEF nexus theory through analytical applications is critical to the pursuit of sustainable pathways towards resource security. For this reason, we set out to conjoin the conceptual (nexus thinking) and analytical (nexus doing) applications through complementary pursuits. The practical application of this research (nexus doing) was the development of an on-line open access data management portal. Hosted by the University of Saskatchewan’s Canadian Hub for Applied Social Research (CHASR), the portal serves as a visualization and information-sharing platform focused on making WEF Security Index data more readily available to end users. The WEF Nexus Portal contains data for each of the 21 WEF indicators, with interactive capacity, allowing point and click and search functions. The portal is a visualization and data management tool for the Alaska WEF Nexus Security Index and supports a robust methodology for making WEF security data more accessible to researchers, communities, and decision-makers.
In addition to data management and visualization capabilities, the portal allows users to enter and calculate their own WEF security scores, be it at local or regional scales. This was achieved by modifying the COIN Tool, permissible by the conditions of the open platform. The COIN Tool's first iteration was an Excel template that supported macros, but its use of closed-source macros (code not available for viewing or modifying), prevented the tool from being customized or be made readily accessible to end-users. A modified version of the tool (COINr) was then developed by using the R programming language. Our team made use of this R package to incorporate it into the WEF Nexus portal, and using JavaScript and C# modified its performance by increasing its accessibility and speed. To satisfy the unique characteristics of Alaska (and other Arctic regions), we then modified the COIN tool to perform independent calculations of indices, which allows regional datasets to be analyzed independently of one another and over time. By linking nexus thinking and nexus doing, our intention is to aid policy makers in Alaska, and the Arctic more generally, as they strive to improve the WEF security of Alaska residents. While the tool itself does not identify specific policy recommendations, it does offer a more informed starting point for policy-makers as they consider, implement, and then track to the outcomes of targeted interventions over time.
Conclusion
This research set out to establish a WEF Security Index for the State of Alaska. Our motivation was to reveal the disparity that might exist between Alaska and the continental US. As anticipated, our results indicate that despite the high level of WEF security enjoyed by the US (ranked 5th globally in their WEF security), Alaska and its five remote regions suffer from considerably higher rates of WEF insecurity. Compared to the US, Alaska faces major challenges accessing clean water, affordable energy, and healthy food. Overall, Alaska’s WEF Index is 15.35 points lower than the overall score for the US. Whereas the sub-indices for water and energy were marginally lower (3.85 and 6.47 points lower respectively), considerable disparity was found between Alaska and US’s food sub-index, with Alaska scoring 35.73 points lower. The greatest constraint to water and energy security was in access, while Alaska’s food security is hampered by limited availability (−51.98). Influenced by local and global change processes, Alaska’s WEF insecurity is a product of an over-dependency on southern supply chains, reliance on export driven economy, and poorly developed and degraded infrastructure, all of which will likely require considerable public investment to reverse.
The objective of this research was to use the Alaska WEF security index as a point for comparison (nexus thinking) that would allow for the identification of positive and negative outliers, which would then allow policy-makers to consider plausible causes for inequalities and why some regions, and not others are exposed to higher levels of WEF insecurity. While this approach does not capture the scalar complexity at which WEF insecurity is experienced (e.g. community, household), it does offer a more nuanced assessment of the variability that exists within the state. Beyond its conceptual contribution of the index, an analytical tool was then developed that will allow policy-makers and community leaders track change in WEF security and monitor the effects stemming from future interventions, be they policy or technological in nature. By bridging nexus thinking and nexus doing, we hope to provide policy-makers with a novel and accessible tool for achieving WEF security in Alaska.
Disclosure statement
No potential conflict of interest was reported by the author(s).
Additional information
Funding
References
- ACEP. (2022). Alaska Center for Energy and Power. University of Alaska Fairbanks. Retrieved January 12, 2023, from https://www.uaf.edu/acep/
- Alaska Department of Environmental Conservation. (2008). Groundwater in Alaska. State of Alaska.
- Alaska Resource Development Council (AKRDC). (2023a). Alaska’s Fishing Industry. AKRDC. Retrieved April 16, 2023, from https://www.akrdc.org/fisheries
- Alaska Resource Development Council (AKRDC). (2023b). Alaska’s Oil & Gas Industry. AKRDC. Retrieved April 16, 2023, from https://www.akrdc.org/oil-and-gas
- Alaska’s Office of Governor. (2022). Administrative Order No. 334. State of Alaska. Retrieved January 12, 2023, from https://gov.alaska.gov/admin-orders/administrative-order-no-334/
- Arctic Council. (2020). Finding the Nexus between Water, Energy, and Food in the Arctic. Retrieved April 16, 2023, from https://arctic-council.org/news/nexus-between-water-energy-and-food-in-the-arctic/
- Bogdan, A.-M., Shah, T., Sidloski, M., Lu, X., Li, M., Ingram, S., & Natcher, D. (2023). What gets measured gets done: Challenges in monitoring water, energy, and food security in northern Canada. Arctic, 76(2), 225–233. https://doi.org/10.14430/arctic77896
- Cook, M. A. (2011). Manifest opportunity: The Alaska purchase as a bridge between United States expansion and imperialism. Alaska History, 26(1), 1–10. http://alaskahistoricalsociety.org/wp-content/uploads/2016/12/Article-on-purchase.pdf
- Deléglise, H., Bazié, Y. G., Bégué, A., Interdonato, R., Roche, M., Teisseire, M., & Maître d’Hôtel, E. (2022). Validity of household survey indicators to monitor food security in time and space: Burkina Faso case study. Agriculture & Food Security, 11(1). https://doi.org/10.1186/s40066-022-00402-4
- Denholm, P., Schwarz, M., DeGeorge, E., Stout, S., & Wiltse, N. (2022). Renewable portfolio standard assessment for Alaska’s Railbelt. National Renewable Energy Laboratory. https://www.nrel.gov/docs/fy22osti/81698.pdf
- DOE/EIA. (2022). State Energy Consumption Estimates. DOE/EIA. Retrieved July 11, 2022, from https://www.eia.gov/state/seds/sep_use/notes/use_print.pdf. DOE/EIA – 0214(2020)
- Economic Research Service. (2021). Food Security and Nutrition Assistance. U.S. Department of Agriculture. https://www.ers.usda.gov/data-products/ag-and-food-statistics-charting-the-essentials/food-security-and-nutrition-assistance/
- EPA. (2022). About Bristol Bay. EPA. Retrieved April 16, 2023, from https://www.epa.gov/bristolbay/about-bristol-bay
- Fall, J. A. (2016). Regional patterns of fish and wildlife harvests in cotemporary Alaska. Arctic, 69(1), 47–64. https://doi.org/10.14430/arctic4547
- Fall, J. A., & Kostick, M. L. (2018). Food Security and Wild Resource Harvests in Alaska. Alaska Department of Fish and Game Division of Subsistence. Retrieved July 11, 2022, from http://www.adfg.alaska.gov/static/home/subsistence/pdfs/food_security_whitepaper.pdf
- Feeding America. (2019). Food Insecurity in Alaska. Feeding America. Retrieved July 11, 2022, from https://map.feedingamerica.org/county/2019/overall/alaska
- Fernández-Ríos, A., Laso, J., Campos, C., Israel Ruiz-Salmón, I., Hoehn, D., Cristóbal, J., Batlle-Bayer, L., Bala, A., Fullana-I-Palmer, P., Puig, R., Aldaco, R., & Margallo, M. (2021). Towards a Water-Energy-Food (WEF) nexus index: A review of nutrient profile models as a fundamental pillar of food and nutrition security. Science of The Total Environment, 789, 147936. https://doi.org/10.1016/j.scitotenv.2021.147936
- Fusco, G., Anastasio, A., Kingsley, D. H., Amoroso, M. G., Pepe, T., Fratamico, P. M., Cioffi, B., Rossi, R., La Rosa, G., Boccia, F. (2019). Detection of hepatitis A virus and other enteric viruses in shellfish collected in the Gulf of Naples, Italy. International Journal of Environmental Research and Public Health, 16(14), 2588. http://doi.org/10.3390/ijerph16142588
- Golder, F. A. (1920). The purchase of Alaska. The American Historical Review, 25(3), 411. https://doi.org/10.2307/1836879
- Greenberg, J. (2008). Alaska Natural Resources and Economic Sustainability. REEIS at the U.S. Department of Agriculture. https://portal.nifa.usda.gov/web/crisprojectpages/0212799-alaska-natural-resources-and-economic-sustainability.html
- Hennessy, T. W., & Bressler, J. M. (2016). Improving health in the Arctic region through safe and affordable access to household running water and sewer services: An Arctic council initiative. International Journal of Circumpolar Health, 75(1), 31149. https://doi.org/10.3402/ijch.v75.31149
- Hicks, S. (2017). Climate and Energy Security in Alaska. American Security Project. www.jstor.org/stable/resrep05969
- Hossain, Y., Loring, P. A., & Marsik, T. (2016). Defining energy security in the rural north - historical and contemporary perspectives from Alaska. Energy Research and Social Science, 16, 89–97. https://doi.org/10.1016/j.erss.2016.03.014
- Ingram, S., Bogdan, A., Shah, T., Lu, X., Li, M., Sidloski, M., & Natcher, D. (2021). Unpacking the WEF nexus index: A regional and Sub-regional analysis of northern Canada. Sustainability, 13(21), 13338. https://doi.org/10.3390/su132313338
- ITK. (2021). Access to Drinking Water and Sanitation Infrastructure in Inuit Nunaat. Inuit Circumpolar Council and Inuit Tapiriit Kanatami. Retrieved April 16, 2023, from https://www.itk.ca/wp-content/uploads/2021/08/20210816-ICC-ITK-Access-to-Drinking-Water-and-Sanitation-Infrastructure.pdf
- Kaiser, M., Chen, A. T., & Gluckman, P. (2021). Should policy makers trust composite indices? A commentary on the pitfalls of inappropriate indices for policy formation. Healthy Research Policy and Systems, 19(40). https://doi.org/10.1186/s12961-021-00702-4
- Klouda, N. (2022). Alaska’s Economic Performance in National Context. University of Alaska Center for Economic Development. Retrieved April 16, 2023, from https://static1.squarespace.com/static/59f6b60bcf81e02892fd0261/t/63755223ed155a341638d13b/1668633124243/ak-econ-performance.pdf
- McGrane, S. J., Acuto, M., Artioli, F., Chen, P. Y., Comber, R., Cottee, J., Farr-Wharton, G., Green, N., Helfgott, A., Larcom, S., Mccann, J. A., O'Reilly, P., Salmoral, G., Scott, M., Todman, L. C., van Gevelt, T., & Yan, X. (2018). Scaling the nexus: Towards integrated frameworks for analysing water, energy and food. Geographical Journal, 185, 419–431. https://doi.org/10.1111/geoj.12256
- Meter, K., & Goldenberg, M. P. (2014). Building Food Security in Alaska. Alaska Department of Health and Social Services. Retrieved January 12, 2023, from https://www.crcworks.org/akfood.pdf
- Munda, G., & Nardo, M. (2009). Noncompensatory/nonlinear composite indicators for ranking countries: A defensible setting. Applied Economics, 41(12), 1513–1523. https://doi.org/10.1080/00036840601019364
- Murkowski, L., & Scott, T. (2014). Plenty at Stake: Indicators of American Energy Insecurity. Senate Committee on Energy and Natural Resources. https://www.energy.senate.gov/services/files/075f393e-3789-4ffe-ab76-025976ef4954
- Naidoo, D., Nhamo, L., Mpandeli, S., Sobratee, N., Senzanje, A., Liphadzi, S., Slotow, R., Jacobson, M., Modi, A. T., & Mabhaudhi, T. (2021). Operationalising the water-energy-food nexus through the theory of change. Renewable and Sustainable Energy Reviews, 149, 111416. https://doi.org/10.1016/j.rser.2021.111416
- Nhamo, L., Mabhaudhi, T., Mpandeli, S., Nhemachena, C., Senzanje, A., Naidoo, D., Liphadzi, S., & Modi, A. T. (2020). An integrative analytical model for the water-energy-food nexus: South Africa case study. Environmental Science & Policy, 109, 15–24. https://doi.org/10.1016/j.envsci.2020.04.010
- Penn, H. J. F., Loring, P. A., & Schnabel, W. E. (2017). Diagnosing water security in the rural North with an environmental security framework. Journal of Environmental Management, 199, 91–98. https://doi.org/10.1016/j.jenvman.2017.04.088
- Quinn, E. (2021, April 21). Climate change is worsening water scarcity in rural Alaska says study. Radio Canada International. https://www.rcinet.ca/eye-on-the-arctic/2021/04/21/climate-change-is-worsening-water-scarcity-in-rural-alaska-says-study/
- REAP. (2020). Alaska’s Energy Infrastructure. REAP. Retrieved April 16, 2023, from https://alaskarenewableenergy.org/ppf/alaskas-energy-infrastructure/
- Reiff, F. (2014). Drinking Water Safety and the Alaska Native People. Water Quality and Health Council. Retrieved April 16, 2023, from https://waterandhealth.org/safe-drinking-water/drinking-water/drinking-water-safety-alaska-native-people/
- Rosen, Y. (2021). For some Alaska villages, the lack of modern water and sewer service means more health risks. Arctic Today. https://www.arctictoday.com/for-some-alaska-villages-the-lack-of-modern-water-and-sewer-service-means-more-health-risks/?wallit_nosession = 1
- Saisana, M. (2004). Composite Indicators – A review [Conference presentation]. Workshop on Composite Indicators of Country Performance, OECD, Paris, France. https://www.oecd.org/sti/ind/29398640.pdf
- Saisana, M., Alberti, V., Alvarez, M., Becker, W., Caperna, G., Cocco, C., Damioli, G., De Pedraza, P., Del Sorbo, M., D’Hombres, B. & Dominguez-Torreiro, M. (2018). 16th JRC Annual Training on Composite Indicators and Scoreboards. Joint Research Centre: Competence Centre on Composite Indicators and Scoreboards, Ispra, Italy.
- Santeramo, F. G. (2015). On the composite indicators for food security: Decisions matter!. Food Reviews International, 31(1), 63–73. https://doi.org/10.1080/87559129.2014.961076
- Schmidt, J. I., Johnson, B., Huntington, H. P., & Whitney, E. (2022). A framework for assessing food-energy-water security: A FEW case studies from rural Alaska. Science of Total Envrionment, 821, 153355. https://doi.org/10.1016/j.scitotenv.2022.153355
- Shu, Q., Scott, M., Todman, L., & McGrane, S. J. (2021). Development of a prototype composite index for resilience and security of water-energy-food (WEF) systems in industralised nations. Envrionmental and Sustainability Indicators, 11, 100124. https://doi.org/10.1016/j.indic.2021.100124
- Simpson, G. B., & Jewitt, G. P. W. (2019). The development of the water-energy-food nexus as 761 a framework for achieving resource security: A review. Frontiers in Environmental Science, 7. https://doi.org/10.3389/fenvs.2019.00008.763
- Simpson, G. B., Jewitt, G. P. W., Becker, W., Badenhorst, J., Masia, S., Neves, A. R., Rovira, P., & Pascual, V. (2022). The water-energy-food nexus index: A tool to support integrated resource planning, management and security. Frontiers in Water, 4. https://doi.org/10.3389/frwa.2022.825854
- Simpson, G. B., Jewitt, G. P. W., Becker, W., Badenhorst, J., Neves, A. R., Rovira, P., & Pascual, V. (2020a). The Water-Energy-Food Nexus Index. https://www.wefnexusindex.org
- Simpson, G. B., Jewitt, G. P. W., Becker, W., Badenhorst, J., Neves, A. R., Rovira, P., & Pascual, V. (2020b). The Water-energy-food Nexus Index: A Tool for Integrated Resource Management and Sustainable Development. OSF Preprints. https://doi.org/10.31219/osf.io/tdhw5.
- Sohns, A. (2020). Household water vulnerability in the Arctic [Ph.D. Dissertation]. McGill University. https://escholarship.mcgill.ca/concern/theses/fq9780340
- Tadesse, G., Abate, G. T., & Zewdie, T. (2020). Biases in self-reported food insecurity measurement: A list experiment approach. Food Policy, 92, 101862. https://doi.org/10.1016/j.foodpol.2020.101862
- United States Census Bureau. (2023). State Population Totals and Components of Change: 2020-2023. https://www.census.gov/data/tables/time-series/demo/popest/2020s-state-total.html
- United States Department of Agriculture. (2023). Agriculture in Alaska. Climate Hubs. Retrieved January 12, 2023, from https://www.climatehubs.usda.gov/hubs/northwest/topic/agriculture-alaska
- World Health Organization. (2015). Stunting in a Nutshell. https://www.who.int/news/item/19-11-2015-stunting-in-a-nutshell
- WRCC. (2022). Climate of Alaska. Western Regional Climate Center. Retrieved April 16, 2023, from https://wrcc.dri.edu/Climate/narrative_ak.php
- Zak, A. (2018). How one cargo ship delay sends ripples through Alaska’s food supply chain. Anchorage Daily News. Retrieved April 16, 2023, from https://www.adn.com/business-economy/2018/02/10/how-one-cargo-ship-delay-sends-ripples-through-alaskas-food-supply-chain/