
 ?Mathematical formulae have been encoded as MathML and are displayed in this HTML version using MathJax in order to improve their display. Uncheck the box to turn MathJax off. This feature requires Javascript. Click on a formula to zoom.
ABSTRACT
Five varieties of beans from Laibin, Guangxi, China, including mung beans, soybeans, black beans, red beans, and adzuki beans, were chosen as study subjects for multi-index determination and full assessment. Data on the fat, ash, crude fiber, trace element, thermogravimetric analysis and combustion heat of five different types of beans were gathered. The results showed that the order of combustion heat of the 5 kinds of beans was black beans>soybeans>mung beans>adzuki beans>red beans, the order of combustion stability was soybeans>mung beans>black beans>red beans>adzuki beans, the order of fat content was soybeans>red beans>adzuki beans>black beans>mung beans, the order of ash content was black beans>soybeans>adzuki beans>mung beans>red beans, the order of crude fiber content was red beans>soybeans>adzuki beans, and the order of multi-index stoichiometric analysis was soybeans>red beans>black beans>mung beans>adzuki beans. The quality of the food was assessed and classified using the stoichiometric approach, while the food nutrition was assessed from the perspectives of fat, ash, crude fiber, trace elements, thermogravimetric analysis and combustion heat. This work provides a solid scientific foundation for the assessment and investigation of the thermo gravimetric analysis of food combustion stability. This study’s multi-index comprehensive evaluation approach offers a novel concept for food nutrition.
Introduction
Beans are one of the favorite foods.[Citation1] With the continuous improvement of human material living standards, people’s dietary structure[Citation2–8] and daily recipes are also constantly changing.[Citation9–11] [Citation12]Soybean is an important oilseed crop in both China and the USA owing to its nutritional and functional characteristics. Nutrient formation in soybeans is influenced by the genetic composition of the variety and environmental conditions. Proteins, isoflavones, lipids, soluble sugars, and fatty acids were measured in two hundred eighty Chinese and one hundred fifteen American soybean cultivars farmed for two years at three sites in China. Overall soluble sugar (109 mg·g−1) and overall isoflavone (3161.8 μg·g−1) levels were greater in American species, while protein (42.4%) and fatty acid (23.2%) levels were greater in Chinese species. Principal component analysis revealed that protein, linoleic acid, lipids, fatty acids, and isoflavones were the key identified features in soybean cultivars. Furthermore, correlation analysis revealed numerous favorable connections among the various nutritional features. The nutritional features differed in their relationships with geographical parameters (altitude, longitude, and latitude), demonstrating that cultivar origin has a significant impact on nutritional attributes. The nutritional profiles of Chinese and American soybean cultivars were revealed in this study, along with the identification of distinctive cultivars that can be used for a variety of industrial applications and breeding programs aimed at enhancing soybean nutritional qualities.[Citation13–15] In addition to protein and oil, nutritional and bioactive elements play a variety of important roles in determining the quality and nutritional value of soybeans. Volume estimations of foods are used in cutting-edge technology-based nutritional assessment approaches to evaluate dietary intake.[Citation16–18] However, typical databases base their nutrient content on the weight of the product.[Citation19–22] The study of food combustion heat and thermogravimetric analysis has significant theoretical and practical implications[Citation23–28] and can provide a scientific foundation and research importance for food quality research. Fat, ash, crude fiber, micronutrients, thermogravimetric parameters and energy are key factors affecting the nutrition and quality of food.[Citation29–32] It is important to establish a comprehensive multi-indicator evaluation system for the nutrition and quality of food[Citation33–38] for five different types of beans. Food nutrition, as well as the quality of food measured by a stoichiometric approach, can provide a solid scientific foundation for the large-scale development of food resources and food classification research.
Materials and methods
Five kinds of beans, including mung beans (Latin name: Vigna radiata (Linn.) Wilczek; manufactured in June 2018.), soybeans (Latin name: Glycine max, manufactured in September 2018.), black beans (Latin name: Glycine max (Linn.) Merr; manufactured in September 2018.), adzuki beans (Latin name: Vigna angularis (Willd.) Ohwi et Ohashi, manufactured in September 2018.) and red beans (produced in July 2017, Latin name: Vigna angularis) were selected as analytical samples from Laibin, Guangxi, China. Five kinds of beans were authenticated and stored at Guangxi Normal University of Science and Technology. In a mortar, the samples were ground into a fine powder and sieved through pharmacopoeas with a 40 mesh hole.
The materials used included an iCAP7200 ICP‒OES (America, Thermo Scientific), an experimental combustion heat measurement tool from the BH-series (Changsha Changxing Higher Education Instrument Equipment Co., Ltd.), a Thermo gravimetric analyzer, model STA 2500 (NETZSCH, Germany), (China Jinan Alva Instrument Co., Ltd.) and an SE206 fat analyzer, an automatic fiber tester model F1600 from China’s Jinan Alva Instrument Co., Ltd. For five different types of beans, the combustion heat determination method,[Citation39] thermogravimetric analysis method,[Citation40] fat determination method,[Citation41–44] crude fiber determination method,[Citation45] ash determination method,[Citation46] and trace element analysis method[Citation47,Citation48] were used.
Multi-indicator analysis research methodology
Based on the heat of combustion, thermogravimetric parameters, the amount of fat and crude fiber, the amount of trace elements, and the amount of ash, multiple indicators for five different types of beans were analyzed in Guangxi, China, using the entropy method, factor analysis, gray pattern recognition, and gray correlation coefficient cluster analysis.
Results and discussion
Determination of the combustion heat of bean food
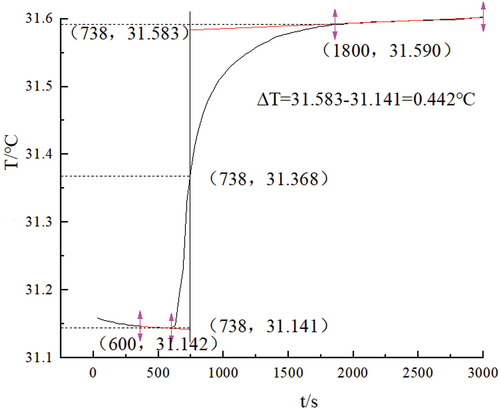
The mung bean combustion heat measurement curve was constructed based on the experimental data. The experiment was carried out three times. depicts the Reynolds temperature ΔT curve. Sample name: the original samples were used in the mung bean experiment. At Wcal = 14466.140 J/℃ and = 20265.7760 J/g, the actual mass of the ignition wire was 0.0098 g, the sample had a mass of 0.2586 g, and the mass of the empty capsule was 0.9999 g, in accordance with ΔmsampleQv=WcalΔT-Qignition wireΔmignition wire-Qcapsule mcapsule, Qmung beans = 16843.6002 J/g.
Figure 1. Reynolds temperature ∆T curve of mung beans.
Analysis of the combustion heat of five different bean species
displays the combustion heat values of the five beans. The order of combustion heat is displayed in for mung beans, soybeans, black beans, red beans, and adzuki beans: black beans>soybeans>mung beans>adzuki beans>red beans. The combustion heat of the five grain samples ranged from 14,444.66 to 32,151.61 J/g, with a CV% ranging from 0.6% to 3.82%. The combustion heat of the black bean was 32,151.6 J/g, while the red bean had a relatively low combustion heat of 14,444.7 J/g The heat of combustion can also reflect the energy value of legumes to some extent. Combustion heat is employed as a significant physical indicator of food quality, and the nutritional value of food is assessed in terms of energy, which provides a measurement of that quality.
Table 1. Combustion heat values of five types of beans (n = 3).
Thermogravimetric analysis
The mung bean thermogravimetric data are given in , and displays the thermogravimetric analysis results. This is possibly due to thermal desorption of lingering small molecules in the sample, resulting in a slight mass loss of the material with a loss rate of 10.10%. After heating, the temperature reached 197.2°C, and the decomposition process progressed to the second step. The sample lost mass significantly at a loss rate of 55.71% until 413.9°C. The mass of the remaining sample was 25.46% after further degradation as a result of an increase in temperature.
Figure 2. TG and DTG curves for mung beans.
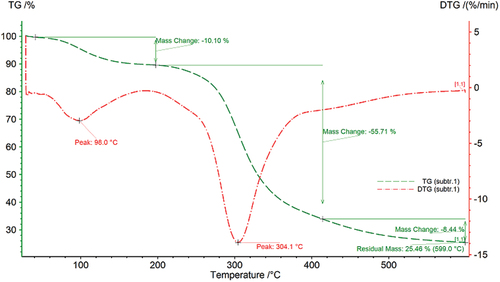
Figure 3. Curves for the differential thermal analysis of mung beans.
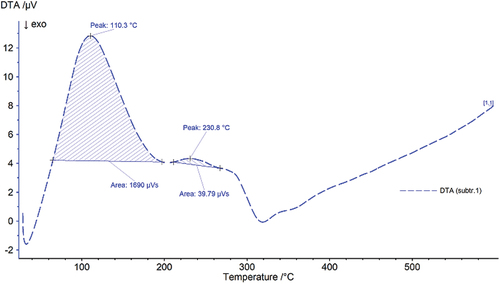
Table 2. Data from mung bean TG-DTG.
As the temperature increased, the DTG curve displayed two peaks, with inflection points at 98.0°C and 304.1°C. Furthermore, the DTA curve of the mung beans displayed two exothermic peaks as the temperature increased, with peak values of 110.3°C and 230.8°C, temperature ranges of 64.6–196.8°C and 211.1–267.0°C, and peak areas of 1690.0 μVS and 39.8 μVS.
show the thermal gravimetric data for soybeans, and shows the thermogravimetric analysis results. Decomposition commenced at 41. 2°C, as shown in , possibly owing to thermal desorption of residual small molecules in the sample, resulting in a loss rate of 7.46%, and the sample quality loss decreased. After heating, the temperature reached 145.4°C, and the decomposition process entered the next stage. Below 464.0°C, the sample began to rapidly lose mass at a rate of 64.06%. The sample was then further degraded as the temperature increased, and the residual sample mass was 20.42%.
Figure 4. TG and DTG curves for soybeans.
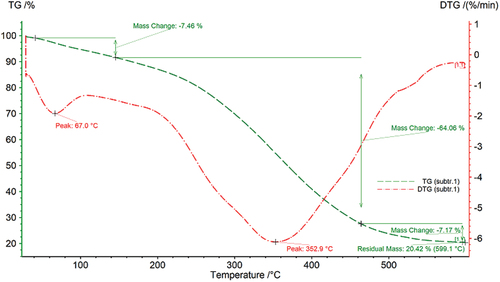
Figure 5. Soybean differential thermal analysis curves.
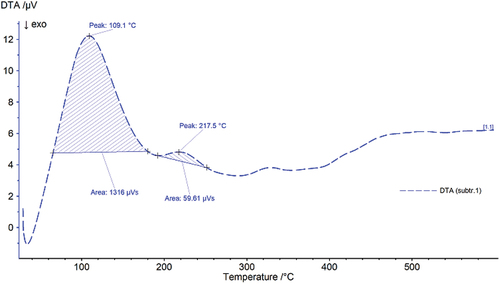
Table 3. Data on soybean TG-DTG.
As the temperature increased, the DTG curve exhibited two peaks, with inflection points at 67.0°C and 352.9°C. Furthermore, as the temperature increased, the DTA of the soybeans revealed two endothermic peaks, with peak values of 109.1°C and 217.5°C, temperature ranges of 65.4–179.7°C and 191.9–251.2°C, and peak areas of 1316.0 μV and 59.6 μV, respectively.
show the thermal gravimetric data for black beans, and shows the thermogravimetric analysis results. As shown in , decomposition occurred at 33.1°C, which may have been caused by thermal desorption of the sample’s remaining small molecules. This resulted in a relatively small mass loss, with an 8.39% loss rate. After heating, the temperature reached 159.2°C, at which point the second step of the decomposition process started. By 466.8°C, the samples rapidly lost mass, with a loss rate of 59.54%. The sample was then further degraded as the temperature rose, with a mass of 25.62% for the sample that was left over.
Figure 6. TG and DTG curves for black beans.
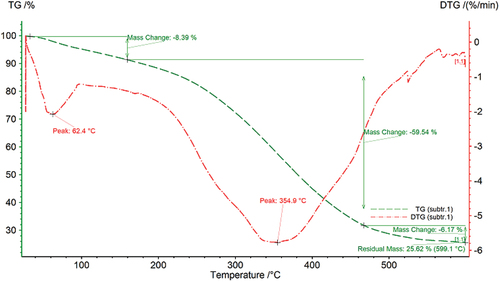
Figure 7. Differential thermal analysis curves of black bean.
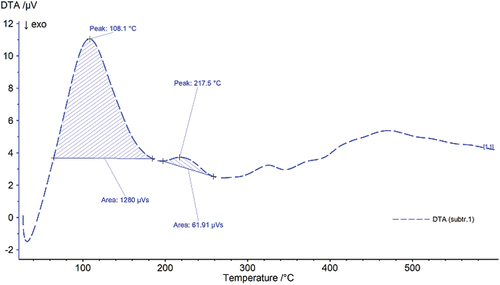
Table 4. Data on black beans from TG-DTG.
The DTG curve revealed two peaks as the temperature increased, with inflection points at 62.4°C and 354.9°C. Furthermore, the DTA curve of black beans displayed two large exothermic peaks as the temperature increased; the extrema were 108.1°C and 217.5°C, the temperatures ranged from 64.6–184.3°C and 196.9–258.5°C, and the peak areas were 1280.0 VS and 61.9 VS, respectively.
display the red bean thermogravimetric data, and displays the thermogravimetric analysis results. show that decomposition started at approximately 41.5°C, possibly as a result of thermal desorption of the remaining small molecules, resulting in a very small mass loss of the sample (12.88% loss rate). The temperature increased for a while before reaching 188.7°C and entering the next stage of disintegration. The sample lost a substantial amount of mass at a rate of 52.76% at temperatures up to 404.4°C. The sample progressively broke down as the temperature increased, and at all tested temperatures, only 24.09% of the original mass remained.
Figure 8. TG and DTG curves for red bean.
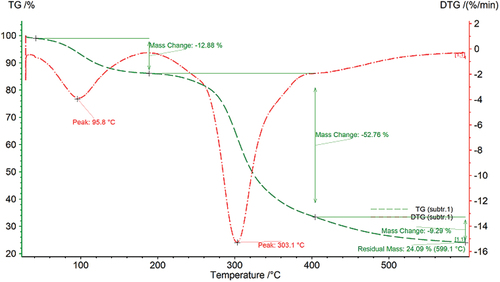
Figure 9. Red bean differential thermal analysis curves.
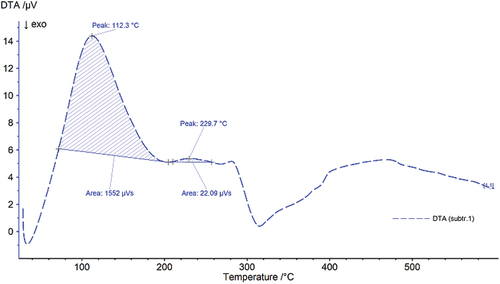
Table 5. Red bean TG-DTG data.
The DTG curve showed two peaks as the temperature increased, with inflection points at 95.8°C and 303.1°C. Furthermore, the DTA curve of red beans displayed two wide exothermic peaks as the temperature increased, with peak values of 112.3°C and 229.7°C, temperature ranges of 71.9–204.3°C and 210.8–257.1°C, and peak areas of 1552.0 μVS and 22.1 μVS, respectively.
show the thermal gravimetric data for the adzuki beans, and shows the thermogravimetric analysis results. Decomposition commenced at approximately 45.7°C, as shown in , and possible thermal desorption of any residual minuscule molecules caused the sample’s small mass loss, with a loss rate of 6.59%. The decomposition process entered the second stage when the temperature reached 156.5°C after a period of heating. The sample started to lose a large amount of mass at a rate of 51.82% at 450.8°C. The sample was then further degraded as the temperature increased, and the remaining sample’s mass was 34.96%.
Figure 10. TG and DTG curves of the adzuki beans.
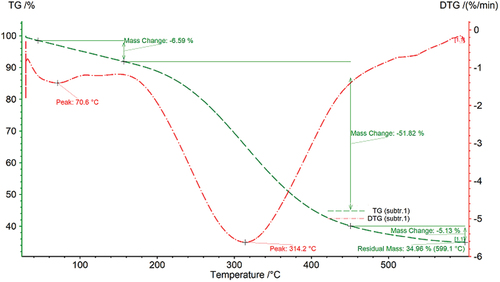
Figure 11. Differential thermal analysis curves for the adzuki beans.
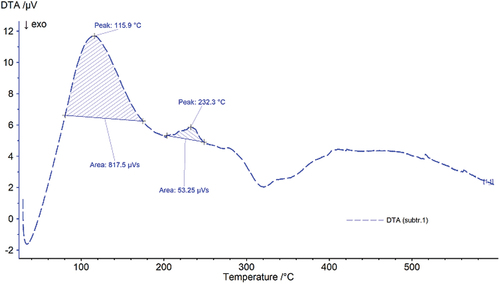
Table 6. TG-DTG data from the adzuki beans.
With increasing temperature, the DTG curve displayed two peaks, and the turning points were 70.6°C and 314.2°C. Furthermore, the DTA curve of the adzuki beans displayed two wide exothermic peaks as the temperature increased, with peak values of 115.9°C and 232.3°C, temperature ranges of 80.6–174.3°C and 203.3–248.2°C, and peak areas of 817.5 μVS and 53.3 μVS.
Combustion stability analysis
Based on the combustion parameters of five distinct varieties of beans, a system for multiple-index evaluation[Citation49] for studying combustion stability was created. A thermogravimetric analyzer was used to examine the food combustion properties at various heating rates to assess the food stability during combustion. The greater the dispersion of an index is, the greater its influence (weight) on the overall evaluation, and the smaller the entropy value. Entropy values are calculated to assess the randomness and disorder degree of an event and when used to assess the dispersion degree of an index. Five legumes were weighted using the entropy method[Citation50–52] to determine the total score F. The greater the sample effect is, the greater the comprehensive score F is. To reach the evaluation conclusion, all the F values are then compared. The F values of mung beans, soybeans, black beans, red beans, and adzuki beans calculated by Excel were 0.5114, 0.5385, 0.5110, 0.4841, and 0.2558, respectively. According to the findings, soybeans outperformed mung beans, black beans, red beans, and azuki beans in terms of combustion stability. Strong scientific ground for the study of food combustion stability evaluation was provided by the application of the thermogravimetric analysis method.
Ash, crude fiber and fat content analyses of 5 kinds of beans
According to , the fat content (%) of mung beans, soybeans, black beans, red beans, and adzuki beans was as follows: soybeans>red beans>adzuki beans>black beans>mung beans, and the crude fiber content was as follows: red beans>soybeans>adzuki beans, while mung beans and black beans were not detected. The ash content of black beans was greater than that of soy beans, adzuki beans, mung beans, and red beans. The fat content ranged from 0.49% to 15% in the five grain samples, with a CV% of less than 3%. The fat content of black beans, red beans, and adzuki beans was approximately 1.5%, soybean had the highest fat content at 14.77%, and mung beans had the lowest fat content at 0.50%. To some extent, the fat content of legume foods can reflect their nutritional value. Fat content is an essential physical factor for assessing food nutrition, and this factor is used to assess the nutritional quality of foods. Fat also aids fat-soluble vitamin absorption and acts as a solvent for fat-soluble vitamins. This allows different groups of individuals to eat beans with varying fat contents. The highest crude fiber concentration was found for the red beans, followed by the adzuki beans, mung beans, and black beans. Fibers are abundant in plants and are a significant component of the plant diet. Although it cannot be absorbed by the human body, it can increase intestinal peristalsis, improve digestive system performance, and maintain normal physiological metabolism.[Citation53–55]
Table 7. Fat, crude fiber, and ash contents of 5 kinds of beans (n = 3, CV%<2.0%).
Trace element analysis for five different types of beans
Eighteen trace elements, Zn, As, Ba, Pb, Sc, Sr, Co, Cr, Cu, Mg, Mn, Fe, Hg, K, Li, Na, Ni, and Al, were identified via inductively coupled plasma‒optical emission spectrometry (ICP‒OES) via microwave digestion. shows the results of 18 trace element analyzes of five types of beans from Laibin, Guangxi, China, including mung beans, soybeans, black beans, red beans, and adzuki beans. The dangerous element As, as well as the heavy metals Pb and Hg, have very low contents that are in accordance with international standards.
Table 8. Data for 18 trace elements from five different types of beans (μg/g, n = 6, RSD < 2.0%).
Factor analysis of 15 trace elements in 5 kinds of beans
displays the variance contribution rates and typical roots of the factor coefficients for the correlation matrix for each of the trace elements,[Citation56,Citation57] which included Zn, Ba, Co, K, Li, Cr, Cu, Na, Ni, Sc, Fe, Mg, Mn, Sr, and Al. The cumulative contribution rates for the initial four major components reached 100.00%, as shown in , and the first four primary correlation coefficient factors had higher eigenvalues (>1.0). The top four key correlation coefficient components, which together constituted 100.00% of the data on fifteen trace elements in five different types of beans from Laibin, Guangxi, China, were extracted, including mung beans, soybeans, black beans, red beans, and adzuki beans.
Table 9. Fifteen trace element contribution rates to variance and factor characteristic roots in five types of beans.
The rotated factor loading matrix of 15 trace elements in five types of beans is shown in . shows that factor matrix 1 of the correlation coefficient mainly contained the original variables Sr, Mg, Fe, Na, Ni, and Al. Factor matrix 2 of the correlation coefficient mainly contained the information for the original variables Mn, Sc, and Zn. Factor matrix 3 of the correlation coefficient mainly contained the information for the original variables Cr, Cu, K and Li. Factor matrix 4 of the correlation coefficient mainly contained the information for the original variables Co and Ba.
Table 10. The rotated factor loading matrix of 15 trace elements in five types of beans.
The scores of the factors and the total factor scores are shown in . shows that adzuki beans were the most abundant of the 15 trace elements, followed by mung beans, black beans, red beans, and soybeans.
Table 11. Factor scores of 15 trace elements for 5 types of beans.
Multi-index analysis and comprehensive evaluation method
One of the most commonly used techniques in gray metrology is gray pattern recognition,[Citation58–60] which entails determining the correlation coefficient between each scheme and the best possible scheme made up of the best indicators. From the correlation coefficient, the correlation is calculated and sorted by the magnitude of the correlation degree, and the appropriate conclusion is drawn. A multi-index analysis and comprehensive evaluation method was constructed for five different types of legumes, namely, red beans, mung beans, black beans, adzuki beans, and soybeans, based on ash, heat of combustion, trace element content, fat, crude fiber content and combustion stability. The correlation coefficients for mung bean, soybean, black, red, and adzuki bean were 0.4402, 0.3857, 0.4478, 0.4348, and 0.3669, respectively. This is similar to the method used by authors to publish literature.[Citation39,Citation61,Citation62] The ranking of the multi-index comprehensive evaluation of the five beans was black beans>mung beans>red beans>soybeans>adzuki beans based on combustion stability, fat, ash, crude fiber, and trace element contents, as well as multi-index combustion heat values. According to the comprehensive evaluation of the quality of the beans selected in this study, black beans were judged to be the best, followed by mung beans.
Using the gray correlation coefficient in cluster analysis
Based on numerous sample features, cluster analysis utilizing the gray correlation coefficient was conducted; samples were classified based on the similarity of their properties. Each case was divided into a different class; the same classes of individuals have great similarity, while different classes of individuals have great differences.[Citation63] Based on the combustion heat, combustion stability, and fat, ash, crude fiber, and trace element concentrations, a multi-index cluster analysis diagram of the five types of beans was developed. The gray correlation coefficient matrix was computed, and was sequentially generated.
Figure 12. Gray correlation coefficient cluster analysis tree diagram of 5 kinds of beans.
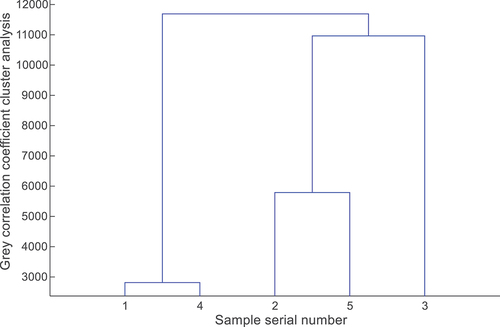
Based on the tree diagram of the gray correlation coefficient cluster analysis of the multi-index combustion heat, combustion stability, fat content, ash content, crude fiber content, and trace element content for five different types of beans, illustrates how the multi-index analysis and clustering analysis diagram was divided into three categories. Black beans constitute a class, mung beans and red beans form one class, and soya beans and adzuki beans form a class.
We used gray correlation coefficient cluster analysis to determine the degree of similarity and relationships between the characteristics of food from various producing regions, which can help us to better categorize beans in accordance with the multi-index evaluation system of beans and from the perspective of bean nutrition.
Conclusion
The concentrations of 18 trace elements in 5 types of beans, Zn, As, Ba, Pb, Sc, Sr, Co, Cr, Cu, Mg, Mn, Fe, Hg, K, Li, Na, Ni, and Al, were determined via inductively coupled plasma‒optical emission spectrometry (ICP – OES) based on microwave digestion, and the data were comprehensively analyzed via the factor analysis method. The order of the contents of 15 trace elements in the 5 kinds of beans was adzuki beans > mung beans > black beans > red beans > soybeans. In terms of trace element contents, adzuki beans contained the highest levels of trace elements among all the samples. Based on the ash content, heat of combustion, trace element content, fat content, crude fiber content and combustion stability, the order of the multi-index comprehensive evaluation of the 5 beans was black beans>mung beans>red beans>soybeans>adzuki beans, and the clustering analysis diagram was divided into three categories: one class consisted of black beans, another class consisted of mung beans and red beans, and the final class consisted of soya beans and adzuki beans. Therefore, the results of the comprehensive evaluation of the quality of beans selected in this study indicated that black beans had the best quality, followed by mung beans. In this paper, based on the combustion heat, differential thermogravimetric analysis, fat content, crude fiber, ash content, and trace element content of 5 beans, comprehensive evaluation systems were built using the entropy method, factor analysis, gray pattern recognition, and gray correlation coefficient cluster analysis. The multi-index comprehensive evaluation system developed in this study offers a novel approach for quantitatively controlling bean quality, a potent approach for extensive bean classification development and study, which lays the foundation for the selection of pulse materials and the use of quantitative control models to assess how different components affect pulse quality.
Ethical approval
This article does not contain any studies with human participants or animals performed by any of the authors.
Disclosure statement
No potential conflict of interest was reported by the author(s).
Additional information
Funding
References
- Hettiaratchi, U. P. K.; Ekanayake, S.; Welihinda, J. Glycaemic Indices of Three Sri Lankan Wheat Bread Varieties and a Bread-Lentil Meal. Int. J. Food Sci. Nutr. 2009, 60(Suppl 4), 21–30. DOI: 10.1080/09637480802360392.
- Cao, X.; Wu, Q. J.; Chang, Q.; Zhang, T. N.; Li, X. S.; Chen, Y. X.; Zhao, Y. H. Knowledge Mapping of Dietary Factors of Metabolic Syndrome Research: Hotspots, Knowledge Structure, and Theme Trends. Front Nutr. 2021, 8, 655533. DOI: 10.3389/fnut.2021.655533.
- Chen, K.; Xue, L.; Li, Q.; Li, Y.; Mao, Y.; Fan, S.; Zhang, L.; Zhao, L. Quantitative Structure-Pungency Landscape of Sanshool Dietary Components from Zanthoxylum Species. Food Chem. 2021, 363, 130286. DOI: 10.1016/j.foodchem.2021.130286.
- El-Mansi, A. A.; El-Bealy, E. A.; Rady, A. M.; Abumandour, M. A.; El-Badry, D. A. Macro- and Microstructures of the Digestive Tract in the Eurasian Collared Dove, Streptopelia Decaocto (Frivaldszky 1838): Adaptive Interplay Between Structure and Dietary Niche. Microsc. Res. Tech. 2021, 84(12), 2837–2856. DOI: 10.1002/jemt.23843.
- Griffiths, L. A.; Douglas, S. M.; Raynor, H. A. The Role of Structure in Dietary Approaches for the Treatment of Pediatric Overweight and Obesity: A Critical Review. Obes. Rev. 2021, 22(9), e13266. DOI: 10.1111/obr.13266.
- Tanaka, S.; Yamamoto, K.; Hamajima, C.; Takahashi, F.; Endo, K.; Uyeno, Y. Dietary Supplementation with Fermented Brassica Rapa L. Stimulates Defecation Accompanying Change in Colonic Bacterial Community Structure. Nutrients. 2021, 13(6), 1847. DOI: 10.3390/nu13061847.
- Torrecillas, S.; Terova, G.; Makol, A.; Serradell, A.; Valdenegro-Vega, V.; Izquierdo, M.; Acosta, F.; Montero, D. Dietary Phytogenics and Galactomannan Oligosaccharides in Low Fish Meal and Fish Oil-Based Diets for European Sea Bass (Dicentrarchus Labrax) Juveniles: Effects on Gill Structure and Health and Implications on Oxidative Stress Status. Front. Immunol. 2021, 12, 663106. DOI: 10.3389/fimmu.2021.663106.
- Wang, B.; Cheng, Z. J.; Xu, Q.; Zhu, T.; Su, L.; Xue, M.; Pei, L.; Zhu, L.; Liu, P. Dietary Structure and Nutritional Status of Chinese Beekeepers: Demographic Health Survey. JMIR Pub. Health. Surveill. 2021, 7(5), e28726. DOI: 10.2196/28726.
- Andarwulan, N.; Cahyarani Puspita, N.; Saraswati Srednicka-Tober, D.; Średnicka-Tober, D. Antioxidants Such As Flavonoids and Carotenoids in the Diet of Bogor, Indonesia Residents. Antioxidants (Basel). 2021, 10(4), 587. DOI: 10.3390/antiox10040587.
- Byrd, K. A.; Pincus, L.; Pasqualino, M. M.; Muzofa, F.; Cole, S. M. Dried Small Fish Provide Nutrient Densities Important for the First 1000 Days. Matern. Child Nutr. 2021, 17(4), e13192. DOI: 10.1111/mcn.13192.
- Kim, G. Y.; Seo, J. S. A New Paradigm for Clinical Nutrition Services in the Era of the Fourth Industrial Revolution. Clin. Nutr. Res. 2021, 10(2), 95–106. DOI: 10.7762/cnr.2021.10.2.95.
- Azam, M.; Zhang, S.; Qi, J.; Abdelghany, A. M.; Shaibu, A. S.; Ghosh, S.; Feng, Y.; Huai, Y.; Gebregziabher, B. S.; Li, J., et al. Profiling and Associations of Seed Nutritional Characteristics in Chinese and USA Soybean Cultivars. J. Food Compost. Anal. 2021, 98, 103803. DOI: 10.1016/j.jfca.2021.103803.
- Xie, C.; Zeng, H.; Li, J.; Qin, L. Comprehensive Explorations of Nutritional, Functional and Potential Tasty Components of Various Types of Sufu, a Chinese Fermented Soybean Appetizer. Food Sci. Technol. 2019, 39(Suppl 1), 105–114. DOI: 10.1590/fst.37917.
- Wu, T.; Yao, Y.; Sun, S.; Wang, C.; Jia, H.; Man, W.; Fu, L.; Song, W.; Wu, C.; Jiang, B., et al. Temporospatial Characterization of Nutritional and Bioactive Components of Soybean Cultivars in China. J. Americ. Oil Chem. Soc. 2016, 93(No.12), 1637–1654. DOI: 10.1007/s11746-016-2908-4.
- Moreira, A.; Moraes, L. A. C.; Aquino, G. S. Iron and Manganese Effect on Soil Chemical Properties, Yield Components, and Nutritional Status of Soybean. Com. Soil Sci. Plant Anal. 2018, 49(No.15), 1844–1854. DOI: 10.1080/00103624.2018.1475564.
- Koemel, N. A.; Senior, A. M.; Celermajer, D. S.; Grech, A.; Gill, T. P.; Simpson, S. J.; Raubenheimer, D.; Skilton, M. R. Multi-Nutrient Analysis of Dietary Macronutrients with All-Cause, Cardiovascular, and Cancer Mortality: Data from NHANES 1999–2014. Nutrients. 2023, 15(2), 345. DOI: 10.3390/nu15020345.
- Rouhani, P.; Mirzaei, S.; Asadi, A.; Akhlaghi, M.; Saneei, P. Nutrient Patterns in Relation to Metabolic Health Status in Overweight and Obese Adolescents. Sci. Rep. 2023, 13(1), 119. DOI: 10.1038/s41598-023-27510-w.
- Xu, Y.; Li, Y.; Ma, X.; Alotaibi, W.; Le Sayec, M.; Cheok, A.; Wood, E.; Hein, S.; Young Tie Yang, P.; Hall, W. L., et al. Comparison Between Dietary Assessment Methods and Biomarkers in Estimating Dietary (Poly)phenol Intake. Food Funct. 2023, 14(3), 1369–1386. DOI: 10.1039/d2fo02755k.
- Partridge, E. K.; Neuhouser, M. L.; Breymeyer, K.; Schenk, J. M. Comparison of Nutrient Estimates Based on Food Volume versus Weight: Implications for Dietary Assessment Methods. Nutrients. 2018, 10(No.8), 973. DOI: 10.3390/nu10080973.
- Li, S.; Bai, Y.; Jiao, J.; Degen, A. A.; Zhang, T.; Wang, W.; Ding, L.; Long, R.; Peng, Z.; Dang, Z., et al. Paths for Improvements of Smallholder Dairies: Case-Study on Local Food Security in Arid Regions of China. Food Control. 2021, 130, 108372. DOI: 10.1016/j.foodcont.2021.108372.
- Jomaa, L. H.; Hwalla, N. C.; Zidek, J. M. Development of a Standardized Measure to Assess Food Quality: A Proof of Concept. Nutr. J. 2016, 15(No.1), 96. DOI: 10.1186/s12937-016-0215-4.
- Akir, B.; Nişancı Kılın, F.; Zata Uyar, G.; Zenir, Ç.; Ekici, E. M.; Karaismailoğlu, E. The Relationship Between Sleep Duration, Sleep Quality and Dietary Intake in Adults. Sleep Biol. Rhythms. 2020, 18(No.1), 49–57. DOI: 10.1007/s41105-019-00244-x.
- Huang, X.; Mo, W.; He, X.; Fan, X.; Ma, F.; Tax, D. Effects of Promoters on the Structure, Performance, and Carbon Deposition of Ni-Al2O3 Catalysts for CO2-CH4 Reforming. ACS Omega. 2021, 6(25), 16381–16390. DOI: 10.1021/acsomega.1c00918.
- Lyu, X.; Wang, X.; Wang, Q.; Ma, X.; Chen, S.; Xiao, J. Encapsulation of Sea Buckthorn (Hippophae Rhamnoides L.) Leaf Extract via an Electrohydrodynamic Method. Food Chem. 2021, 365, 130481. DOI: 10.1016/j.foodchem.2021.130481.
- Nwosu, U. G.; Khachatryan, L.; Youm, S. G.; Roy, A.; Dela Cruz, A. L. N.; Nesterov, E. E.; Dellinger, B.; Cook, R. L. Model System Study of Environmentally Persistent Free Radicals Formation in a Semiconducting Polymer Modified Copper Clay System at Ambient Temperature. R.S.C. Adv. 2016, 6(49), 43453–43462. DOI: 10.1039/C6RA08051K.
- Qiao, L.; Sun, R.; Tao, Y.; Yu, C.; Yan, Y. Surface-Confined Guanidinium Ionic Liquid As a New Type of Stationary Phase for Hydrophilic Interaction Liquid Chromatography. J. Sep. Sci. 2021, 44(18), 3357–3365. DOI: 10.1002/jssc.202100385.
- Sharif Nasirian, V.; Shahidi, S. A.; Tahermansouri, H.; Chekin, F. Application of Graphene Oxide in the Adsorption and Extraction of Bioactive Compounds from Lemon Peel. Food Sci. Nutr. 2021, 9(7), 3852–3862. DOI: 10.1002/fsn3.2363.
- Xia, S.; Baker, G. A.; Li, H.; Ravula, S.; Zhao, H. Aqueous Ionic Liquids and Deep Eutectic Solvents for Cellulosic Biomass Pretreatment and Saccharification. R.S.C. Adv. 2014, 4(21), 10586–10596. DOI: 10.1039/C3RA46149A.
- Ashoori, M.; Soltani, S.; CC, T. C.; Eini-Zinab, H.; Shakibazadeh, E.; Doustmohamadian, A.; Abdar-Esfahani, B.; Mazandaranian, M.; Omidvar, N. Food and Nutrition Literacy: A Predictor for Diet Quality and Nutrient Density Among Late Adolescents. Turk J. Pediatr. 2023, 65(2), 290–300. DOI: 10.24953/turkjped.2022.607.
- Browne, S.; Mullen, A.; Mulholland, B.; Lo, C.; Ruttledge, A. Nutrition Quality and Food and Packaging Waste Associated with the School Food System: A Pilot, Citizen Science Study in an Irish Secondary School. J. Hum. Nutr. Diet. 2023, 36(6), 2310–2322. DOI: 10.1111/jhn.13220.
- Carrette, J.; Chrusciel, J.; Ecarnot, F.; Sanchez, S. Prospective, Observational Study of the Impact of Finger Food on the Quality of Nutrition Evaluated by the Simple Evaluation of Food Intake (SEFI) in Nursing Home Residents. Aging Clin. Exp. Res. 2023, 35(8), 1661–1669. DOI: 10.1007/s40520-023-02444-5.
- Louzada, M.; Couto, V.; Rauber, F.; Tramontt, C. R.; Santos, T. S. S.; Lourenco, B. H.; Jaime, P. C. Food and Nutrition Surveillance System Markers Predict Diet Quality. Rev. Saúde Pública. 2023, 57(1), 82. DOI: 10.11606/s1518-8787.2023057005087.
- Jin, D.; Wang, Q.; Peng, D.; Wang, J.; Li, B.; Cheng, Y.; Mo, N.; Deng, X.; Tao, R. Development and Implementation of an LIS-Based Validation System for Autoverification Toward Zero Defects in the Automated Reporting of Laboratory Test Results. BMC Med. Inform. Decis. Mak. 2021, 21(1), 174. DOI: 10.1186/s12911-021-01545-3.
- Ovchinnikova, L. A.; Terekhov, S. S.; Ziganshin, R. H.; Bagrov, D. V.; Filimonova, I. N.; Zalevsky, A. O.; Lomakin, Y. A. Reprogramming Extracellular Vesicles for Protein Therapeutics Delivery. Pharmaceutics. 2021, 13(6). DOI: 10.3390/pharmaceutics13060768.
- Santonicola, S.; Albrizio, S.; Ferrante, M. C.; Raffaelina, M. Study on Bisphenol F, a Bisphenol a Analogue, at a Dairy Company: Health Hazard and Risk Assessment. Food. Chem. Toxicol. 2021, 154, 112334. DOI: 10.1016/j.fct.2021.112334.
- Swasey, J. H.; Iudicello, S.; Parkes, G.; Trumble, R.; Stevens, K.; Silver, M.; Recchia, C. A.; Rozylowicz, L. The Fisheries Governance Tool: A Practical and Accessible Approach to Evaluating Management Systems. PLOS ONE. 2021, 16(7), e0253775. DOI: 10.1371/journal.pone.0253775.
- Wang, D.; Ding, W.; Yang, J. Spatial Pattern of the Ecological Environment in Yunnan Province. PLOS ONE. 2021, 16(6), e0248090. DOI: 10.1371/journal.pone.0248090.
- Wei, X.; Zhang, Z.; Chong, M. K. C.; Hicks, J. P.; Gong, W.; Zou, G.; Zhong, J.; Walley, J. D.; Upshur, R. E. G.; Yu, M., et al. Evaluation of a Package of Risk-Based Pharmaceutical and Lifestyle Interventions in Patients with Hypertension And/Or Diabetes in Rural China: A Pragmatic Cluster Randomised Controlled Trial. PLOS Med. 2021, 18(7), e1003694. DOI: 10.1371/journal.pmed.1003694.
- Zhou, L.; Jiang, C.; Shi, J.; Jiang, K. Gray Pattern Recognition And Grey System Cluster Analysis Of Multi-indexes Of Five Kinds Of Tea. Fresenius Environ. Bull. 2022, 31(3), 2510–2521.
- Zhou, L.; Jiang, C.; Lin, Q. Entropy Analysis and Grey Cluster Analysis of Multiple Indexes of 5 Kinds of Genuine Medicinal Materials. Sci. Rep. 2022, 12(1), 6618. DOI: 10.1038/s41598-022-10509-0.
- Chandrasekar, R.; Calabraro, R.; Myer, L. J.; Phillippo, T.; King, J. W.; Eller, F. J. Determination of Crude Fat in Meat by Supercritical Fluid Extraction: Direct Method: PVM 3: 2000. J. AOAC Int. 2001, 84(2), 466–471.
- Ganogpichayagrai, A.; Suksaard, C. Proximate Composition, Vitamin and Mineral Composition, Antioxidant Capacity, and Anticancer Activity of Acanthopanax Trifoliatus. J. Adv. Pharm. Technol. Res. 2020, 11(4), 179–183. DOI: 10.4103/japtr.JAPTR_61_20.
- Maxwell, R. J. Simple, Rapid Method for Determination of Total Extractable Fat in Canned Pet Foods. J. Assoc. Off. Anal. Chem. 1984, 67(5), 878–879. DOI: 10.1093/jaoac/67.5.878.
- Tao, L. L.; Yang, X. J.; Deng, J. M.; Zhang, X. Application of Near Infrared Reflectance Spectroscopy to Predict Meat Chemical Compositions: A Review. Guang Pu Xue Yu Guang Pu Fen Xi. 2013, 33(11), 3002–3009.
- Wei, J. Quantitative Determination of Fibrous Materials Chemical Composition and Near Infrared Model Construction. Doctor; Donghua University: Shanghai, 2013.
- Zhou, L.; Jiang, C.; Zhang, Y. Combustion Stability And Metrological Analysis Of Multiple Indexes Of 5 Kinds Of Rice. Fresenius Environ. Bull. 2022, 31(6), 5499–5514.
- Ikem, A.; Egilla, J. Trace Element Content of Fish Feed and Bluegill Sunfish (Lepomis Macrochirus) from Aquaculture and Wild Source in Missouri. Food Chem. 2008, 110(2), 301–309. DOI: 10.1016/j.foodchem.2008.02.003.
- Rasic Misic, I. D.; Tosic, S. B.; Pavlovic, A. N.; Pecev-Marinkovic, E. T.; Mrmosanin, J. M.; Mitic, S. S.; Stojanovic, G. S. Trace Element Content in Commercial Complementary Food Formulated for Infants and Toddlers: Health Risk Assessment. Food Chem. 2022, 378, 132113. DOI: 10.1016/j.foodchem.2022.132113.
- Zhang, S.; Zhang, F.; Wang, C.; Wang, Z.; Yang, J. Assessing the Resilience of the Belt and Road Countries and Its Spatial Heterogeneity: A Comprehensive Approach. PloS One. 2020, 15(9), e0238475. DOI: 10.1371/journal.pone.0238475.
- Xu, G.; Cao, H.; Udupa, J. K.; Tong, Y.; Torigian, D. A. DiSegnet: A Deep Dilated Convolutional Encoder-Decoder Architecture for Lymph Node Segmentation on PET/CT Images. Comput. Med. Imaging Graph. 2021, 88, 101851. DOI: 10.1016/j.compmedimag.2020.101851.
- Jiang, X.; Wang, L.; Su, X.; Zeng, W.; Xu, A.; Zheng, Q.; Xu, W. Spatial Heterogeneity in and Distributional Characteristics of Rural Ecological Livability in China–The Case of Fujian Province. PLOS ONE. 2020, 15(12), e0244238. DOI: 10.1371/journal.pone.0244238.
- Luo, S.; He, Y.; Li, Q.; Jiao, W.; Zhu, Y.; Zhao, X. Nondestructive Estimation of Potato Yield Using Relative Variables Derived from Multi-Period LAI and Hyperspectral Data Based on Weighted Growth Stage. Plant Methods. 2020, 16(1), 150. DOI: 10.1186/s13007-020-00693-3.
- Neess, D.; Kruse, V.; Marcher, A. B.; Waede, M. R.; Vistisen, J.; Moller, P. M.; Petersen, R.; Brewer, J. R.; Ma, T.; Colleluori, G., et al. Epidermal Acyl-CoA-Binding Protein Is Indispensable for Systemic Energy Homeostasis. Mol. Metab. 2021, 44, 101144. DOI: 10.1016/j.molmet.2020.101144.
- Tomczyk-Warunek, A.; Dubiel, A.; Poleszak, E.; Blicharski, R.; Dobrzynski, M. Disorders of the Intestinal Flora and it Is Effect on Skeletal System Diseases. Wiad. Lek. 2020, 73(9 cz. 1), 1835–1839. DOI: 10.36740/WLek202009105.
- Wan, H.; Ren, K.; Kaper, H. J.; Sharma, P. K. A Bioinspired Mucoadhesive Restores Lubrication of Degraded Cartilage Through Reestablishment of Lamina Splendens. Colloids Surf. B Biointerfaces. 2020, 193, 110977. DOI: 10.1016/j.colsurfb.2020.110977.
- Jafari, F.; Mohammadi, H.; Amani, R. The Effect of Zinc Supplementation on Brain Derived Neurotrophic Factor: A Meta-Analysis. J. Trace Elem. Med. Biol. 2021, 66, 126753. DOI: 10.1016/j.jtemb.2021.126753.
- Zhang, Q.; Que, M.; Li, W.; Gao, S.; Tan, X.; Bu, D. Gangba Sheep in the Tibetan Plateau: Validating Their Unique Meat Quality and Grazing Factor Analysis. J. Environ. Sci. (China). 2021, 101, 117–122. DOI: 10.1016/j.jes.2020.06.024.
- Li, K.; Ramkumar, S.; Thimmiaraja, J.; Diwakaran, S. Optimized Artificial Neural Network Based Performance Analysis of Wheelchair Movement for ALS Patients. Artif. Intell. Med. 2020, 102, 101754. DOI: 10.1016/j.artmed.2019.101754.
- Cresswell, K.; Callaghan, M.; Khan, S.; Sheikh, Z.; Mozaffar, H.; Sheikh, A. Investigating the Use of Data-Driven Artificial Intelligence in Computerised Decision Support Systems for Health and Social Care: A Systematic Review. Health Informatics J. 2020, 26(3), 2138–2147. DOI: 10.1177/1460458219900452.
- Corona, V.; Lellmann, J.; Nestor, P.; Schonlieb, C. B.; Acosta-Cabronero, J. A Multi-Contrast MRI Approach to Thalamus Segmentation. Hum. Brain Mapp. 2020, 41(8), 2104–2120. DOI: 10.1002/hbm.24933.
- Zhou, L.; Jiang, C.; Zhong, T.; Zhu, M. Entropy Analysis and Grey Correlation Coefficient Cluster Analysis of Multiple Indexes of 5 Kinds of Condiments. Food Sci. Technol. 2022, 42, e81122. DOI: 10.1590/fst.81122.
- Zhou, L.; Zhang, Q. Multi-Index Chemometrics Analysis of Five Kinds of Tea Produced in Yunnan, China. Fresenius Environ. Bull. 2022, 31(10), 10342–10354.
- Zhou, L. Study on the Amino Acids in Different Varieties of Osmanthus Fragrans Using Grey Pattern Recognition and Grey Hierarchical Clustering Analysis. IOP Conf. Ser Earth Environ. Sci. 2020, 526, 012079.