
 ?Mathematical formulae have been encoded as MathML and are displayed in this HTML version using MathJax in order to improve their display. Uncheck the box to turn MathJax off. This feature requires Javascript. Click on a formula to zoom.
ABSTRACT
Developing ice cream products as functional foods with less fat content and a high survival rate of probiotics aided by prebiotics is required to address the demands of health-conscious consumers. This study aimed to investigate the effects of fat content (2 and 10% fat as a low and full-fat, respectively) and different concentrations of prebiotics (galacto-oligosaccharide, GOS and fructo-oligosaccharide, FOS) on the survival rate of Bifidobacterium longum TISTR 2195 in yogurt ice cream (YIC) and in an in vitro gastrointestinal system. Fat content affected the fat particle size, melting rate, and solid-like characteristics of ice cream. The hardness and elasticity of YIC were enhanced more significantly by FOS, owing to its lower solubility and denser microstructure, manifesting more solid-like properties than those by YIC containing GOS. Moreover, type and prebiotic concentrations influenced B. longum TISTR 2195 survival in YIC. Moreover, B. longum TISTR 2195 content in YIC during storage for 180 d remained consistent at 106 CFU/g, which is considered beneficial to human health. The study findings could be useful for ice cream manufacturers to produce low- or full-fat YICs containing prebiotics and probiotics, as functional and healthy foods.
Introduction
The International Food Information Council Foundation (IFIC) defines functional foods as foods containing substances that are beneficial to health. In addition to nutrients which help prevent or cure diseases,[Citation1] alternative foods are now gaining popularity, since consumers have become more health-conscious. Ice cream is one of the most popular and accessible deserts worldwide.[Citation2] It is a synbiotic food product.[Citation3] Developing ice cream products with higher nutritional value by reducing the fat content but increasing the contents of probiotics, which include microorganisms beneficial to the human gastrointestinal (GI) tract, and prebiotics, which are nutrients promoting human microflora, could provide consumers more choices in ice cream consumption.
Probiotic microorganisms, particularly bacteria, can survive in the human GI tract, resulting in a balanced GI environment, and promote the growth and function of beneficial microflora. Probiotics can resist extreme conditions of the human GI tract. The number of probiotics that can survive in the GI tract to effectively promote human health is equal to a reference value of 106 CFU/g or mL of the finished product before consumption. Consuming 106 to 109 CFU/g of live probiotic cells offers maximum benefits to the human body.[Citation4] Probiotics generally used in food products include Lactobacilli, such as Lactobacillus acidophilus, Lactobacillus agilis, Lacticaseibacillus rhamnosus; Bifidobacterium longum; and Bifidobacterium bifidum. Lactobacilli colonize the small intestine, whereas Bifidobacterium colonize the colon.[Citation5]
Prebiotics are indigestible food components that are beneficial for the growth of intestinal microorganisms. The optimum functioning of these microorganisms may positively affect those consuming prebiotics. Fructooligosaccharides (FOS), inulin, galactooligosaccharides (GOS), lactulose, and lactosucrose are popular prebiotics used in food products.[Citation6] Gibson and Rastall (2006)[Citation7] reported that FOS and GOS can stimulate Bifidobacteria growth and are an important source of energy for GI-friendly microbes. Aklin and Erisir (2008)[Citation8] found that the use of inulin, oligofructose, or FOS as prebiotics for the probiotics, L. acidophilus La-5 and Bifidobacterium animalis Bb-12 in ice cream production yields contrasting results. B. animalis Bb-12 exhibits a higher survival rate than that of L. acidophilus La-5, and in ice cream samples containing FOS, the survival rates of both the microorganisms are higher than those in ice cream containing inulin over a 90-day storage period at −18°C. Thus, it was suggested that prebiotics should be used to enhance the survival of B. longum TISTR 2195 in this study.
Yogurt ice cream (YIC), or frozen yogurt, is milk ice cream which contains yogurt of at least 10–20% of the weight of the ice cream, and is currently popular for its sweet and sour taste. In addition, YIC has the same health benefits as yogurt and provides a refreshing cooling effect, which is a distinctive feature of ice cream. YIC caters to consumers who dislike the sharp sour taste and texture of yogurt,[Citation9] but still value the benefits of probiotics, which are absent in normal ice cream. Therefore, the addition of probiotics such as B. longum TISTR 2195 to YIC could create an alternative to functional and healthy ice cream for health-conscious consumers.
However, the ice cream production process requires aeration, whipping, and the use of low to freezing temperatures to transform most of the water in the ice cream mix into ice crystals. The ice, air cells, and water in the unfrozen serum phase are encapsulated by a three-dimensional network of fat particles in ice cream.[Citation10] This slows the melting process and makes the ice cream structure more stable when consumed. Thus, ice cream is a product with microscopic gaps or cavities inside its network structure, which may allow probiotics such as B. longum TISTR 2195 to thrive. This specific structure could provide a channel through which B. longum TISTR 2195 can be introduced into the human body; however,[Citation11] the high fat content in ice cream may affect the acceptability of the product by health-conscious consumers.
Therefore, developing ice cream products with less fat content, but a high survival rate of probiotics aided by prebiotics may address consumer requirements. In addition, to date, few studies have shown the effects of the quantity of fat and prebiotic content or type on the YIC properties and survival of probiotics, particularly B. longum TISTR 2195, which is more beneficial to the human GI tract than other probiotics. It can also be found in infants, children, adults, and the older population, with the highest abundance occurring in infancy and decreasing with age. This strain, isolated from humans in Thailand, is more suitable for the host body and shows better adherence to the human intestinal wall than that by other strains[Citation12] such as B. animalis subsp. animalis and B. animalis subsp. lactis. Moreover, Bifidobacterium can produce L – (+) – lactic acid, which is more frequently used in the human metabolic system than D – (–) – lactic acid, which is an acid made by other probiotics.[Citation13] However, being a newly identified strain, its survival in frozen conditions, such as ice cream, as well as in in vitro GI systems is unknown. Thus, this study aimed to investigate the effects of fat content and different concentrations of prebiotics (GOS and FOS) on the survival rate of B. longum TISTR 2195 in YIC and in an in vitro GI system, along with evaluating the physicochemical properties of YIC.
Materials and methods
Raw materials
Freeze-dried B. longum TISTR 2195 was obtained from the Thailand Institute of Scientific and Technological Research (Pathum Thani, Thailand). Thermophilic YoFlex® culture YC-380, freeze-dried yogurt culture, was purchased from Chr. Hansen’s disease (Hoers Holm, Denmark). Butter fat (99.90%) was purchased from Vicky Enterprises (Bangkok, Thailand). Fufill 400, a stabilizer/emulsifier (S/E), was purchased from SKW Biosystems (Baupte, France). Sucrose was obtained from Mitr Phol Group (Bangkok, Thailand). Glucose syrup (10–12 DE) was purchased from Thai Glucose Co., Ltd. (Nakornpathom, Thailand). Skimmed milk powder (SMP) was obtained from Fonterra (Auckland, New Zealand). GOS (55% (w/w)) was purchased from Yakult Pharmaceutical Industry (Tokyo, Japan). FOS (90% (w/w)) was obtained from Sigma-Aldrich (St. Louis, USA). Bifidobacteria Selective Count Propionate Agar Base (M1734) and Bifido Selective Supplement A (FD250) were purchased from Hi Media Laboratories (Maharashtra, India). L-cysteine hydrochloride was obtained from Acros Organics (New Jersey, USA).
Preparation of yogurt
An active commercial starter culture (thermophilic YoFlex® culture YC-380) which was a mix of Lactobacillus bulgaricus and Streptococcus thermophilus was used to produce yogurt. Pasteurized milk with 3.52% fat content was warmed to 60°C before adding 2% (w/w) SMP to the milk with stirring until the SMP dissolved completely. The mixture was then allowed to cool to 43°C before the starter culture was inoculated with gentle stirring for 10 min. According to the manufacturer’s recommendation, 50 U (one sachet) was inoculated in 250 L milk. The mixture was then poured into a sterilized yogurt container and cured in a yogurt incubator (YA1493; Elecream, Vanvea, France) at 43°C until pH of the yogurt dropped to 4.6, which took approximately 5 h. The yogurt was then immediately placed in at 4°C in a refrigerator to arrest the fermentation and preserve it for the next experiment.
Preparation of YIC
The ingredients used to prepare YIC are shown in . Distilled water was added to make each formula reach 100%. After dissolving the dry ingredients, including GOS or FOS (at the same concentration based on dry basis), in water, melted butter fat was added and the whole ice cream mix was pasteurized at 80°C for 30 s.[Citation14] Subsequently, the ice cream mix was homogenized at 2000 psi and 500 psi for the first and second stages of homogenization, respectively, using a homogenizer (15MR-8TA, APV Gaulin, Wilmington, USA) which was previously circulated with deionized water at 95°C for 5 min as a clean-in-place (CIP) process. After homogenization, the ice cream mix was cooled to room temperature and aged at 4°C for 24 h in a refrigerator. At the end of the aging stage, active B. longum TISTR 2195 at 109 CFU/g of ice cream mix and 20% (w/w) yogurt were added to the ice cream mix with gradual stirring for 5 min using sterilized food whisks. The ice cream mixture was whipped and frozen in a batch ice cream freezer (Taylor 103-g34, Illinois, USA) for 15 min. The ice cream was then hardened at −20°C in a freezer (SNQ0103–170100063, Sanden Intercool, Bangkok, Thailand). YIC production was performed in duplicate. YIC samples were obtained to determine the survival rate of B. longum TISTR 2195 in YIC every 15 days for 180 days or 6 months.
Table 1. The formulae and ingredients used to produce yogurt ice cream (% w/w).
Fat particle size of YIC mix
The fat particle size of the YIC mix was determined using a laser scattering particle size distribution analyzer (LA-950V2, Horiba, Tokyo, Japan). The refractive values of fat particles and water were 1.458 and 1.33, respectively, for calculating fat particle size without the interference of other particles in the sample, following manual instructions from the equipment company. The YIC mix was gently dropped into the analyzer chamber. Particle size was measured and reported as the Sauter mean (d3,2).
Dynamic oscillatory characteristics of YIC mix
The dynamic oscillatory test for the YIC mix was based on the method described by Adapa et al.[Citation15] A 4-degree angle cone-plate geometry was used for this measurement. The gap between the YIC mix sample and probe was 27 μm. All measurements were performed at 4°C using a temperature-controlled rheometer (AR-G2 Rheometer, TA Instruments, New Castle, USA). The linear viscosity region (LVR) was determined using a torque sweeping test at a constant frequency of 0.08 Hz. The LVR was in the range of 0.1–1 mN.m. The oscillatory properties of the YIC were examined using a frequency sweeping test from 0.1–5 Hz at a constant torque of 0.2 μN.m. The value for tan delta (tan δ), referred to as the proportion of viscous fluid in the elastic state (G”/G’), was measured. If tan δ > 1, the material is more viscous than elastic, and if tan δ < 1, the material is more elastic than viscous.
Total acidity and pH of YIC
The total acidity and pH were determined according to the method described by Akin et al.[Citation16] pH of the melted YIC was measured at 25–30°C using a pH meter (MP220; Mettler-Toledo, Greifensee, Switzerland). The total acidity of YIC was measured using the acidity titration method by weighing 10 g of melted YIC titrated with NaOH (0.1 N); phenolphthalein was used as an indicator. Total acidity was calculated as the percentage of lactic acid present in the YIC.
Overrun of YIC
The YIC overrun was measured using the method described by Thaiudom.[Citation17] Briefly, equal volumes of YIC mix and YIC were weighed. The overrun was calculated using the following EquationEquation (1)(1)
(1) :
Hardness of YIC
The hardness of YIC was measured following the method of Javidi et al.[Citation18] using a texture analyzer (Stable Micro System, TA-XT plus, Surrey, England). A cylindrical probe with a diameter of 6 mm was used. The sample pressing distance was 15 mm and the sample pressing speed was 2 mm/s.
Melting rate of YIC
The melting rate of YIC was measured following the method of Thaiudom.[Citation17] The samples, which were initially placed in a plastic cup of 30 mm height and 50 mm diameter and stored at −20°C, were then placed on a stainless-steel grid wire plate with a cone supporting the bottom of the plate. The melted YIC passed through the grid and dropped into a beaker beneath the cone. The beaker containing melted YIC was weighed every 10 min for 2 h. Weight of the melted YIC was compared with the initial weight of YIC, which was reported as a percentage, and the duration of YIC melting was plotted to determine the melting rate.
Microstructure of YIC
Microstructure of the YIC was determined following the method by Goff et al.[Citation19] using a Low-Temperature Scanning Electron Microscope (LT-SEM; QUANTA 450, FEI, Oregon, USA). To prevent structural changes due to YIC melting, YIC samples were quickly submerged in liquid nitrogen after removal from the storage freezer. The samples were then fractured into small pieces (approximately 2–3 mm diameter) using a blade and pincers. The samples were then placed on a specimen holder in a vacuum chamber of LT-SEM at −20°C. YIC samples were observed and photographed at an electrical voltage of 10 kV. At least five photographs of each sample were captured.
Number of surviving B. longum TISTR 2195 in YIC
The survival of B. longum TISTR 2195 was determined using the method described by Akin et al.[Citation16] Briefly, 10 g of ice cream was mixed with 90 mL of 0.1% (w/v) sterilized peptone solution. This mixture was serially diluted to determine the number of B. longum TISTR 2195 cells. The surviving B. longum TISTR 2195 was counted by pouring 1 mL of the above mix into a sterile plate containing 15 mL of the mixture between 5 mL of Bifido Selective Supplement A (FD250) and 500 mL of Bifidobacteria Selective Count Propionate Agar Base (M1734). The plate with AnaeroPack® and Anaero-Indicator (Mitsubishi gas chemical company, Tokyo, Japan) was placed into an AnaeroPouch® (Mitsubishi gas chemical company, Tokyo, Japan) to provide the anaerobic conditions. This pouch was incubated at 37°C for 72 h in an incubator (BD400, Binder Incubator, New York, NY, USA). The survival of B. longum TISTR 2195 was determined by counting the number of B. longum TISTR 2195 colonies in the range of 30–300 and was calculated using EquationEquation (2)(2)
(2) . The survival duration of B. longum TISTR 2195 was monitored every 15 days for 180 days.
Survival of B. longum TISTR 2195 in an in vitro digestive system
The survival of B. longum TISTR 2195 in an in vitro GI system was determined following the method described by Abadía-García et al.[Citation20] with a slight modification. Briefly, 10 g of YIC was well mixed with 80 mL simulated stomach solution (pH 2) which composed of pepsin (from porcine gastric mucosa, Sigma-Aldrich Chemical Co., St. Louis, MO, USA) at a concentration of 3 g/L in a 0.5% w/v NaCl solution and 10 mL artificial saliva solution which contained 6.2 g NaCl, 2.2 g KCl, 0.22 g CaCl2, and 1.2 g NaHCO3 in 1 L of distilled water. This mixture was prepared in a sterilized centrifuge tube. This sample was incubated at 37°C for 2 h before being centrifuged at 10,000 ×g at 4°C for 10 min resulting in a pellet of B. longum TISTR 2195. Subsequently, the pellet was resuspended in an intestine solution, containing pancreatin (from porcine pancreas, Sigma-Aldrich Chemical Co., St. Louis, MO, USA) and bile (bovine, Sigma-Aldrich Chemical Co., St. Louis, MO, USA) in 0.5% w/v NaCl solution in a sterilized centrifuge tube, and the sample was incubated at 37°C for 4 h. Aliquots (1 mL) of the sample in the centrifuge tube, collected every 2 h until 6 h, were then poured to sterilized plates. Then, 15 mL of the mixture, prepared from 5 mL of Bifido Selective Supplement A (FD250) and 500 mL of Bifidobacteria Selective Count Propionate Agar Base (M1734), was poured onto the plates with gentle stirring. Then, the plates were incubated at 37°C for 72 h under anaerobic conditions and the number of surviving B. longum TISTR 2195 was quantified as a percentage of survival.
Statistical analyses
All experiments were run in duplicate and at least three data were used for the analysis of variance and Duncan’s Multiple Range Test using SPSS Statistics 17.0 (SPSS Statistical Software, Inc., Chicago, IL, USA) at a statistical confidence level of 95%.
Results and discussion
Physicochemical properties of YIC
No significant difference (p > .05) in pH and acidity was observed for all samples (). This was because the same amount of lactic acid was produced by the yogurt starter culture after fermentation to produce yogurt; moreover, a fixed amount of yogurt was added to the ice cream at 20% (w/w) for all samples of YIC, resulting in the same pH and acidity for all samples. However, all the YIC samples showed a slightly acidic to neutral pH, similar to that found of general YIC.[Citation21,Citation22] Also, the type of prebiotic (GOS or FOS) used did not affect the pH and acidity of YIC.
Table 2. Physicochemical properties of YIC prepared with different prebiotics and fat contents.
The overruns of these samples, which were in the range of 34–35%, were not significantly different (p > .05), and were similar to the overrun range of ice cream with synbiotics reported by Ahmadi et al.[Citation23] However, their results revealed that an increase in added prebiotics, counted as dry matter, increases the overrun. In addition, Akin et al.[Citation16] reported an increased overrun for ice cream with added inulin as a prebiotic compared to that of control ice cream, owing to the enhanced ability of inulin to retain water in its structure. Consequently, the serum phase of the ice cream was more concentrated, which could better entrap air cells in the ice cream. However, in this study, the overruns of all YICs were similar, which may have been because of the same amount of prebiotics (GOS and FOS) which were added to the YIC. Moreover, overall statistical calculations showed that the overrun values of all the YICs were not significantly different (p > .05). Thus, overrun, as a measure of the overall volume of air cells entrapped in the three-dimensional structure of YIC, in this study was not affected by GOS and FOS relative to that of the control, despite the air cell structure of each YIC differing considerably in size (see more results in the microstructural section). Higher amounts of prebiotics added resulted in smaller and more evenly distributed air cells in the YIC. Therefore, it was assumed that the overrun value of the ice cream depended on the number and size of air cells whipped into the ice cream. An ice cream with large but a smaller number of air cells could result in the same overrun value as ice cream with small but more number of air cells.
Also, variable fat content in YIC did not affect the overrun, which is similar to the findings of Rolon et al.[Citation24] who reported similar overrun values for ice cream containing 6, 8, 10, and 12% fat content (p > .05). However, the main factors affecting ice cream overrun are the whipping time and efficiency of the ice cream freezer;[Citation18] therefore, in this study, the overrun values were not significantly different because the laboratory-scale batch freezer used was a capped freezer, which may have resulted in a low but constant overrun value for all YICs.
For fat particle size, using a higher fat content in YIC resulted in a larger fat particle size. Low-fat YIC possessed smaller fat particle sizes than full-fat or high-fat YIC, which is consistent with the results reported by Rolon et al.[Citation24] The use of a higher fat content in ice cream at the same pressure in a homogenizer and the same protein content results in a larger diameter of fat particles because these fats can easily collide with each other. Moreover, their size reduces to that of small fat particles during homogenization, thus increasing the surface area of the fat.[Citation10] The greater the surface area of the fat, the less complete the adsorption of milk protein on the surface of the fat in ice cream. Consequently, the adjacent fat particles without adsorbed milk proteins coalesce and easily merge into larger particles, resulting in larger fat particles. This would not happen with low fat content YIC because the surface of fat particles could be completely covered by milk proteins.
Regarding the effect of prebiotics on fat particle size in YIC, there was no significant difference between GOS and FOS in 2% fat-YIC (p > .05) but the particle size of the fat was significantly different in 10% fat-YIC (p < .05). This may have been due to the low-fat content in 2% fat-YIC, which did not alter fat particle size despite GOS or FOS being added to YIC, and all the fat particles in 2% fat-YIC may have been completely stabilized and covered with milk proteins, such as casein micelles, resulting in less collision of neighboring fat particles, thus preventing fat coalescence and aggregation. However, in 10% fat-YIC, the fat particle size was smaller in the YIC containing FOS or GOS than that in the control. However, the increase in FOS, but not GOS in YIC significantly reduced the size of the fat particles. This finding is attributed to the longer chain length of FOS than that of GOS in this study, which could better occupy space in the ice cream serum phase and prevent the collision and aggregation of the fat particles, resulting in smaller fat particles in FOS-YIC than those in GOS-YIC. Longer chain length of FOS resulted in higher viscosity of FOS than that of GOS at the same concentration. Thus, the addition of long-chain prebiotics such as FOS could increase the viscosity of YIC, which may retard or prevent the collision and aggregation of fat particles in YIC better than that using GOS. This finding is consistent with that reported by Balthazara et al.[Citation25]
Oscillatory property of YIC mix
The results showed that when the frequency was increased, tan of 2%-fat YIC mix was higher than that of 10%-YIC mix (). This implied that the 2%-fat YIC mix behaved more like a liquid with less elasticity than the 10%-fat YIC mix. This is consistent with the findings of Adapa et al.[Citation15] who reported that an ice cream mix with a higher fat content always possesses elastic and solid-like behavior than that with a lower fat content, and tan
increases with decrease in the fat content of the ice cream mix. In addition, Isik et al.[Citation26] found that an ice cream mix with a higher fat content is more viscous than that with a lower fat content.
Figure 1. tan of yogurt ice cream mix at different frequencies.
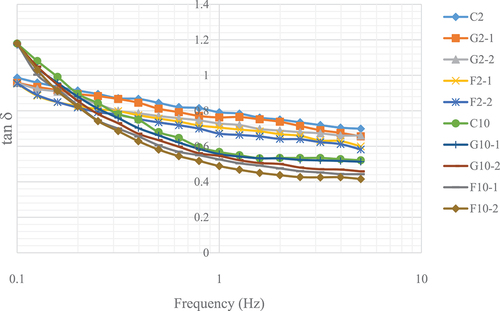
Further, in this study, the addition of FOS and GOS increased the elasticity of the YIC mix compared with that of the control. However, the addition of FOS provided more elasticity and a lower tan value than those with GOS. This indicates that FOS induced higher viscosity and solid-like behavior in the YIC mix than did GOS, which is similar to the results of Balthazara et al.[Citation25] Moreover, concentrations of the prebiotics affected this behavior. Higher the prebiotic concentration, greater the viscosity and solidness, resulting in fewer collisions of neighboring fat particles in the serum phase of the ice cream. This result is also supported by the findings of Balthazara et al.[Citation25] who reported that the addition of GOS increases the viscosity of an ice cream mix, but the elasticity of such a mix is lower than that of the mix with FOS. Thus, the type of prebiotic could affect the rheological properties of the ice cream mix owing to the different structures and molecular weights of the prebiotics. A FOS chain has approximately 3–9 single-molecule sugars in the polymerization chain, called the “degree of polymerization,” while GOS has approximately 2–5 molecules;[Citation6] consequently, FOS forms hydrogen bonds more easily with water than that by GOS. This confirms that FOS provides higher viscosity and more solid- or gel-like properties than those using GOS. Akalin and Erisir[Citation8] also studied the effects of inulin and FOS on the physical characteristics of ice cream and found that inulin increases viscosity of the mix more remarkably than that by FOS because inulin possesses a longer chain length than that of FOS. Thus, longer chains of prebiotics produce better hydrogen bonding with water than that with shorter chains, resulting in higher viscosity.
Hardness of YIC
Neither 2%-fat YIC nor 10%-fat YIC significantly affected hardness (p > .05) (). Muse and Hartel[Citation27] investigated the hardness of ice cream and found that it was influenced by the ice phase volume, ice crystal size, overrun, fat destabilization, and rheological properties of the mix. In line with these results, we expected a significant difference in the oscillatory results and hardness of YIC between 2%-fat YIC and 10%-fat YIC in all the YIC samples, but in contrast, there was no difference between these YIC. Moreover, although the 10%-YIC mix showed solid-like characteristics and higher fat destabilization than those of the 2%-fat YIC mix, the hardness of these YICs was not significantly different. Guinard et al. (1997)[Citation28] reported that the hardness of ice cream is inversely proportional to the fat content. Thus, reduction in the fat content of ice cream could increase the number of ice crystals formed during the whipping and freezing processes in ice cream freezers. Cook and Hartel (2010)[Citation29] reported that fat can reduce ice crystal formation in ice cream by replacing water in the unfrozen concentrated serum phase of ice cream, thus reducing the water content in ice cream, resulting in fewer ice crystals and lower hardness. Considering the amount and size of ice crystals as the main factor affecting the hardness of ice cream, a large water content should produce many large ice crystals, which are entrapped in the ice cream structure, making it harder.[Citation27] Hence, theoretically, Control with 10% fat should show lesser hardness than that of control with 2% fat (C2), as observed in . However, the calculated hardness values of C2 and C10 were not significantly different (p > .05). This result is consistent with that of Rolon et al. (2017)[Citation24] who reported that the different fat contents (6, 8, 10, 12, and 14%) of ice creams with different concentrations of maltodextrins as fat substitutes do not significantly affect instrumental hardness. Also, Roland et al. (1998)[Citation30] reported that on change in composition towards a higher concentration of water, hardness increases non-significantly from 7.68 kg for 10% fat ice cream to 12.86 kg for 0.1% fat ice cream (p > .05) among the 0.1, 3, and 7% fat samples. Chansathirapanich, Ngamchuachit, and Tansawat (2016)[Citation31] concluded that hardness tends to increase with the lowering of fat content and prolonged storage of ice cream, even though all the ice cream formulations with fat content in the range of 0.61–10.02% did not show significant differences in hardness at the day 0 of measurement (p > .05). However, the hardness of ice cream on day 28 was significantly higher than that on day 0 (p < .05). Thus, the hardness of ice cream increases as a function of storage time rather than fat content.
Figure 2. Hardness of yogurt ice cream with different fat content and different type and concentration of prebiotics.
However, the addition of prebiotics, particularly GOS, to YIC resulted in lower hardness than that of the control owing to its ability to bind with water. Consequently, there was a lower water content but an increase in the concentration of the serum phase of YIC. This could have induced freezing point depression of YIC,[Citation32] resulting in easier melting of YIC and a softer YIC texture. Moreover, greater the GOS concentration added to the YIC, lower the hardness (G2–1, G2–2, G10–1, and G10–2 in ). In contrast, YICs with and without FOS were similar in terms of hardness (F2–1, F2–2, F10–1, and F10–2 in ). FOS did not affect the hardness of YIC owing to its longer chain length than GOS,[Citation6] which produced a stronger and denser overall structure of YIC (for more details, see the section on microstructure) owing to its lower solubility, forming many microcrystals in YIC.[Citation8] Moreover, FOS did not depress the freezing point as much as that by GOS, which possessed a shorter chain length and could bind more easily than FOS to water in the unfrozen serum phase of YIC, resulting in a higher serum phase concentration. This was explained by the results of Soukoulis, Fisk, and Bohn (2014),[Citation33] who stated that an increase in molecular chain length and degree of branching in prebiotics such as inulin could reduce the mean number of ice crystals and freezing point depression, resulting in better hardness and melting rate of low-fat ice cream, supporting the cryoprotective role of prebiotics such as inulin. Thus, longer the chain length of the prebiotics used resulted in lower depression of the freezing point of the ice cream and eventually greater stability of the ice cream. In addition, similar to the rheological results, because the FOS-YIC mix exhibited higher viscosity than that of GOS-YIC, the hardness of FOS-YIC was higher than that of GOS-YIC. This confirms that FOS contributes more than GOS to the hardness of YIC.
However, the addition of GOS caused more dispersion of air cells in the structure of YIC (see more information in the section on microstructure) compared with that in the control, and GOS-YIC contained many smaller air cells than those in the control. This made it easier for the probe of the texture analyzer to penetrate the ice cream to obtain hardness measurements. Moreover, ice cream with a large number of air cells tends to have a softer texture than that of ice cream with fewer air cells.[Citation34] However, the hardness of ice cream depends on many factors, such as overrun, viscosity of the ice cream mix, and the number and size of ice crystals.[Citation35]
Melting rate of YIC
The melting rate of 10%-fat YIC was lower than that of 2%-fat YIC () because fat was the main factor affecting the melting rate. Using a larger amount of fat results in a better three-dimensional fat network within the YIC. As a result, the YIC can retain air cells in the network,[Citation28] thus behaving like an external insulation of heat transfer to the ice crystals from the surrounding environment in the YIC. This prevents ice crystals from spreading to the molten ice crystals within the YIC structure,[Citation25] thus retarding the melting rate of the ice cream. This results in the ice cream becoming more stable during certain periods before melting into a liquid. YIC with 10% fat possessed more solid-like characteristics than those of 2% fat YIC consequently, stabilizing and maintaining the shape of 10% fat YIC while melting more effectively than 2% fat YIC. Thus, YIC with higher fat content melts more slowly than YIC with lower fat content.[Citation27]
Figure 3. Melting curve of yogurt ice cream with different fat contents and prebiotics.
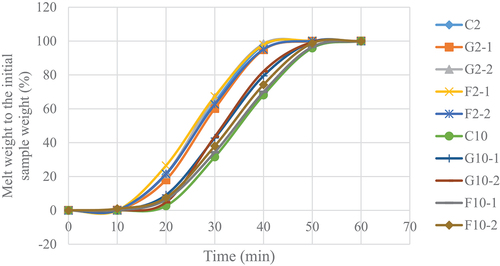
The addition of GOS or FOS to 2%-fat YIC did not affect the melting rate, probably because 2%-fat YIC melted too quickly due to its high content of large ice crystals and low serum phase viscosity (p > .05). However, the addition of prebiotics to 10% fat YIC significantly increased the melting rate of YIC than that of the control (p < .05). This may be due to the addition of prebiotics such as GOS, which are composed of short chains of oligosaccharides which intensify the unfrozen serum phase of YIC, resulting in freezing point depression.[Citation32] Moreover, 10%-fat YIC with GOS appeared to melt faster than YICs with FOS (both with 1 and 2% addition) or without GOS or FOS. This can be attributed to the chain length of FOS, which retards the movement of water in the unfrozen serum phase in YIC[Citation25] better than GOS. The longer the chain length of the prebiotic, the more effective it is in preventing or slowing down the movement of water, resulting in a lower melting rate, as found in 10%-fat YIC containing FOS. However, interestingly, the 10%fat YIC without GOS and FOS showed the lowest melting rate. This indicated that the prebiotics interfered with or reduced the strength of the three-dimensional fat network in YIC by disintegrating from neat and strong fat networks to weak and disrupted ones. Consequently, these fat networks could not hold the unfrozen serum phase in the YIC and could not retain the YIC shape effectively relative to the YIC without prebiotics.
Microstructure of YIC
The microstructures of all the YICs were analyzed using LT-SME (). The sizes and number of air cells in each YIC microstructure were noticeably different. The YIC without prebiotics ( and d) was larger in air size, but with lesser number of air cells than those in YIC containing prebiotics (). This indicates that the prebiotics influenced the microstructure of YIC. GOS and FOS promoted the formation of many small bubbles in the YIC. YIC with added prebiotics, particularly GOS, had lower hardness than in those without GOS, as the texture analyzer probe could penetrate the sample more easily in ice cream with fewer air cells. In particular, the addition of FOS resulted in smaller and significantly more number of bubbles than those in YIC with GOS and the control; however, the hardness of FOS-YIC was not significantly different from that of YIC without FOS (). This can be attributed to the increased elasticity of the YIC mix by FOS compared to that by GOS (). Thus, during the whipping and freezing processes, FOS-YIC could better prevent the recombination of air cells than that by GOS-YIC, which had a lower elasticity. In contrast, GOS had a larger bubble size than that of FOS-YIC because the air cells in GOS-YIC occasionally crashed into each other and formed larger bubbles more easily than those in FOS-YIC. However, Balthazar et al.[Citation25] reported that GOS-fortified ice cream has more air cells than ice cream without added prebiotics because GOS increases the viscosity of the serum phase around the surface of the air cells, which also prevents their coalescence. Thus, the ice cream microstructure possesses both small and round air cells (), differing from those in control YIC (), resulting in lower hardness.
Figure 4. Microstructures of yogurt ice cream with different fat contents and prebiotics.
However, FOS showed a greater ability than GOS to induce a dense structure of YIC in both 2% and 10% fat YIC. This can be attributed to the fact that FOS possesses a longer chain length, which might have combined with itself to produce microcrystals,[Citation27] resulting in a denser FOS-YIC structure than that of GOS-YIC. Thus, YIC with FOS seemed to provide a more complicated and denser microstructure than that with GOS and a harder texture than that of GOS-YIC ().
Collectively, these data suggest that 10%-YIC had a lower melting rate than 2%-YIC, but it had a stronger structure and a firmer three-dimensional fat network. Therefore, the greater the amount of fat, the stronger the structure of the fat lattice body because it prevents the air cells and ice crystals from fusing.[Citation27] In addition, the use of higher fat content in the ice cream ingredients provided higher elasticity, which caused the size of the air cells in the YIC to be smaller and closer in diameter than when lower fat content was used.
Survival of B. longum TISTR 2195 in YIC during storage
The survival of B. longum TISTR 2195 in YIC during storage was examined (). The initial load of B. longum TISTR 2195 in the YIC mix was 109 CFU/g for all YIC samples. The number of surviving colonies decreased from 109 to 108.5 CFU/g after the YIC mix was whipped and frozen in an ice-cream freezer. Shear force applied during the whipping and freezing processes can damage and injure microbial cells. While YIC cooled during the whipping process, ice crystals formed in its internal structure can harm B. longum TISTR 2195 cells.[Citation14,Citation16] In addition, whipping and freezing processes which introduce air in ice cream could decrease the survival of B. longum TISTR 2195, which is an oxygen-sensitive microorganism.[36] Interestingly, the number of surviving B. longum TISTR 2195 colonies was significantly higher in F2–2 YIC than that in other YIC formulations throughout the storage period from day 0 to day 90. This indicated that FOS at 2% enabled B. longum TISTR 2195 to tolerate extreme environmental conditions, such as a frozen state and aerobic environment in the ice cream. The same results were observed in F2–1, F10–1, and F10–2 YIC containing FOS, whereas all YIC samples with GOS showed low survival rate of B. longum TISTR 2195. This could be attributed to the stronger and firmer structure of FOS than that of GOS, which formed microcrystals and a high fat content, forming stronger three-dimensional fat networks which can protect B. longum TISTR 2195 under such extreme conditions. The number of surviving B. longum TISTR 2195 between days 90 and 120 in FOS-YIC was not significantly different for all YICs containing FOS; however, this number was higher than that of YICs containing GOS. Therefore, in this study, FOS was found to be more effective in enhancing the survival of B. longum TISTR 2195 than GOS under frozen conditions, such as YIC. This contradicts the findings of Di Criscio, et al.[Citation36] which showed no difference in the survival of lactic acid bacteria in ice cream containing GOS or FOS. However, YIC without GOS or FOS showed the lowest number of surviving B. longum TISTR 2195 after 120–180 days. This strongly confirmed that prebiotics could strengthen the survival of B. longum TISTR 2195. These data are similar to the findings of Akalin and Erisir,[Citation8] who found that adding inulin and FOS as prebiotics to ice cream help increase the survival rate of Lactobacillus acidophilus La-5 and B. animalis Bb-12, since these prebiotics are a rich source of carbon and energy for these microorganisms. However, storage and freezing of the YICs at a very low temperature (−20°C) for a long time results in large ice crystals. Thus, ice crystals could injure B. longum TISTR 2195 cells in ice cream,[Citation8] thus decreasing the number of B. longum TISTR 2195.
Figure 5. Viable count of Bifidobacterium longum TISTR 2195 in yogurt ice cream with different fat contents and prebiotics during storage for 6 months.
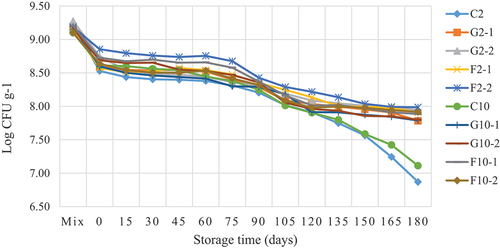
Regarding the effect of fat content on the survival of probiotics in YIC, Alamprese, et al.[Citation37] and Santos Leandro et al.[Citation38] found no significant difference in the number of surviving probiotics used in their ice cream samples with low, medium, and high fat content, stored at −16°C for 30–40 days. These results are consistent with those of the present study, even though the probiotics used earlier were Lacticaseibacillus rhamnosus GG and Lactobacillus delbrueckii UFV H2b20. Thus, despite differences in the probiotic strains and storage times, the survival of probiotics is consistent. In conclusion, the number of B. longum TISTR 2195 that survived in this study was > 106 CFU/g over the entire storage period of 180 days.
Survival of B. longum TISTR 2195 using an in vitro GI system
After storage for 15 days at −20°C, the YIC samples were used to determine the survival of B. longum TISTR 2195 using an in vitro GI system. The results showed that the average number of surviving B. longum TISTR 2195 for all YICs in the in vitro stomach conditions decreased by 1.71 log CFU/g or 16.18% from the initial load of 100% within 2 h (). Using in vitro intestinal conditions, the average number of surviving B. longum TISTR 2195 for all YICs decreased by 1.69 log CFU/g or 15.93% and 1.67 log CFU/g or 15.82% from the initial load of 100% within 4 and 6 hours, respectively. The number of surviving B. longum TISTR 2195 decreased using the in vitro GI system because pH in this condition (pH in the stomach was 2.0, and pH in the intestine was approximately 7.4) was unsuitable for the growth of B. longum TISTR 2195, which can survive optimally at pH 6–7,[Citation21] resulting in the death of some B. longum TISTR 2195 cells. In addition, bile in the intestine could destroy the cell walls of B. longum TISTR 2195 and cause cell destabilization and damage, because gram-positive bacteria such as B. longum TISTR 2195 generally have low resistance to bile.[Citation39]
Figure 6. Means and standard deviations for the percentage survival of B. longum TISTR 2195 in yogurt ice cream with different fat content and prebiotics using an in vitro gastrointestinal system at different time points.
Regarding the effects of fat on the survival of B. longum TISTR 2195, it was found that 10% fat contributed to a significant increase in the degree of survival of this microorganism than that with 2% fat content (p < .05) at later stages in the in vitro GI system (6 h) () while, at the initial stages (0 to 4 h), there was no significant difference in the degree of survival of this bacterium (p > .05). However, the number of B. longum TISTR 2195 from 2 or 10%-fat YIC samples that survived in the in vitro GI system in this study decreased when the digestion time increased. As a result, similar to other probiotics, the survival of B. longum TISTR 2195 was dependent on the exposure duration.[Citation40] Moreover, prebiotics, such as GOS and FOS, also non-significantly influenced the survival of B. longum TISTR 2195 in the in vitro GI system (p > .05) at the initial stage. However, the number of B. longum TISTR 2195 that survived in YIC with GOS or FOS was higher than that in YIC without GOS or FOS during later stages in the in vitro GI system (6 h). This implies that such prebiotics could enhance the survival rate of B. longum TISTR 2195 in YIC compared to that in YIC without prebiotics. This is consistent with a study by Kowalczyk et al.[Citation41] who found that the addition of inulin and apple fiber as prebiotics in sheep milk symbiotic ice cream resulted in higher survival rates of B. animalis Bb-12 than that in control samples without any prebiotics in the in vitro GI system. Furthermore, YIC with a higher concentration of GOS in this study showed that the number of surviving B. longum TISTR 2195 was higher than that in YIC with a lower concentration of GOS initially (2–4 h), whereas the concentration of FOS in YIC mostly affected the survival of B. longum TISTR 2195 at the later stages in the in vitro GI system (6 h). Thus, the content of fat and type and concentration of prebiotics in YIC affected the number of B. longum TISTR 2195 that survived in an in vitro GI system in this study depending on the time point at which B. longum TISTR 2195 was assessed.
Conclusion
The fat particle size of YIC mixes and GOS or FOS as prebiotics differed significantly and proportionally with the fat content of the YIC. FOS provided elasticity to these mixes rather than GOS, resulting in more solid-like characteristics which enhanced the hardness of the YIC. This could have slowed the melting of the ice cream. However, YIC containing FOS showed a denser structure and a greater number of smaller air cells than those in YIC containing GOS. However, both GOS and FOS in YIC played an important role in the survival of B. longum TISTR 2195 in the YIC during storage for up to 180 days. Higher prebiotic concentrations resulted in a higher survival rate using an in vitro gastrointestinal system when compared to that of YIC without either GOS or FOS, depending on the exposure times. These findings could be useful for ice cream manufacturers to produce low- or full-fat YICs containing prebiotics and probiotics, such as B. longum subsp. longum TISTR 2195, as functional and healthy foods. However, to enhance the survival rate of the probiotics, further studies should evaluate an encapsulation technique along with sensory evaluation.
Credit authorship contribution statement
Watcharaporn Toommuangpak contributed to methodology, laboratory procedures, formal analysis, and writing-original draft preparation.
Both authors have read and proved this published manuscript.
Siwatt Thaiudom contributed to conceptualization, methodology, formal analysis, data curation, writing-review and editing, supervision, and funding acquisition.
Acknowledgments
The authors would like to thank Suranaree University of Technology Research and Development Fund for funding the research.
Disclosure statement
No potential conflict of interest was reported by the author(s).
Data availability statement
The relevant data have been provided in the form of tables and figures. However, any further information required will be provided by the authors on reasonable request.
Additional information
Funding
References
- Clydesdale, F., Functional Foods: Opportunities & Challenges, Food Technology Magazine. 2004. Website ift.org: Institute of Food Technologists. https://www.ift.org/news-and-publications/food-technology-magazine/issues/2004/december/features/functional-foods-opportunities-and-challenges
- Khaira, N. M.; Abd Rahmana, N. A.; Baharuddina, A. S.; Hafidb, H. S.; Wakisakab, M. Capturing the Impact of Nanobubble Liquid in Enhancing the Physical Quality of Ice Cream. J. Agric. Food. Chem. 2020, 2, 0012. DOI: 10.37865/jafe.2020.0012.
- Golestani, M.; Pourahmad, R. Comparison of Three Treatments (Two Fermented Treatments and One Nonfermented Treatment) in Production of Synbiotic Ice Cream. J. Food Process Preserv. 2017, 41(2), e12839. DOI: 10.1111/jfpp.12839.
- Lee, Y. K.; Seppo, S. The Coming of Age of Probiotics. Trends Food Sci. Technol. 1995, 6(7), 241–245. DOI: 10.1016/S0924-2244(00)89085-8.
- Daniel, J. Primary Sources of Probiotic Cultures; Taylor&Francis Group: Boca Raton, 2006; pp. 91–107.
- Gibson, G. R. Fibre and Effects on Probiotics (The Prebiotic Concept). Clin. Nutr. Suppl. 2004, 1(2), 25–31. DOI: 10.1016/j.clnu.2004.09.005.
- Gibson, G. R.; Rastall, R. A. Prebiotics: Development & Application; John Wiley & Sons Ltd: New Jersey, 2006.
- Akalın, A. S.; Erişir, D. Effects of Inulin and Oligofructose on the Rheological Characteristics and Probiotic Culture Survival in Low‐Fat Probiotic Ice Cream. J. Food Sci. 2008, 73(4), 184–188. DOI: 10.1111/j.1750-3841.2008.00728.x.
- Marshall, R. T.; Goff, H. D.; Hartel, R. W. Ice Cream; Springer: New York, 2003.
- Goff, H. D. Ice Cream and Frozen Desserts; Wiley: New Jersey, 2015.
- Cruz, A. G.; Antunes, A. E.; Sousa, A. L. O.; Faria, J. A.; Saad, S. M. Ice-Cream As a Probiotic Food Carrier. Food. Res. Int. 2009, 42(9), 1233–1239. DOI: 10.1016/j.foodres.2009.03.020.
- Gomes, A. M.; Malcata, F. X. Bifidobacterium Spp. and Lactobacillus acidophilus: Biological, Biochemical, Technological and Therapeutical Properties Relevant for Use As Probiotics. Trends Food Sci. Techno. 1999, 10(4–5), 139–157. DOI: 10.1016/S0924-2244(99)00033-3.
- Arunachalam, K. D. Role of Bifidobacteria in Nutrition, Medicine and Technology. Nutr. Res. 1999, 19(10), 1559–1597. DOI: 10.1016/S0271-5317(99)00112-8.
- Haynes, I. N.; Playne, M. J. Survival of probiotic cultures in low-fat ice-cream. Aust. J. Dairy Technol. 2002, 57(1), 10–14.
- Adapa, S.; Dingeldein, H.; Schmidt, K. A.; Herald, T. J. Rheological Properties of Ice Cream Mixes and Frozen Ice Creams Containing Fat and Fat Replacers. J. Dairy. Sci. 2000, 83(10), 2224–2229. DOI: 10.3168/jds.S0022-0302(00)75106-X.
- Akın, M. B.; Akın, M. S.; Kırmacı, Z. Effects of Inulin and Sugar Levels on the Viability of Yogurt and Probiotic Bacteria and the Physical and Sensory Characteristics in Probiotic Ice-Cream. Food Chem. 2007, 104(1), 93–99. DOI: 10.1016/j.foodchem.2006.11.030.
- Thaiudom, S. Effect of Ratio of Milk Fat to Soy Bean Oil and Whipping Time on Qualities of Milk Ice Cream (In Thai). Songklannakarin J. Sci. and Tech. 2007, 29(1), 191–204.
- Javidi, F.; Razavi, S. M.; Behrouzian, F.; Alghooneh, A. The Influence of Basil Seed Gum, Guar Gum and Their Blend on the Rheological, Physical and Sensory Properties of Low Fat Ice Cream. Food Hydrocoll. 2016, 52, 625–633. DOI: 10.1016/j.foodhyd.2015.08.006.
- Goff, H. D.; Verespej, E.; Smith, A. K. A Study of Fat and Air Structures in Ice Cream. Int. Dairy. J. 1999, 9(11), 817–829. DOI: 10.1016/S0958-6946(99)00149-1.
- Abadía-García, L.; Cardador, A.; Del Campo, S. T. M.; Arvízu, S. M.; Castaño-Tostado, E.; Regalado-González, C.; Amaya-Llano, S. L. Influence of Probiotic Strains Added to Cottage Cheese on Generation of Potentially Antioxidant Peptides, Anti-Listerial Activity, and Survival of Probiotic Microorganisms in Simulated Gastrointestinal Conditions. Int. Dairy. J. 2013, 33(2), 191–197. DOI: 10.1016/j.idairyj.2013.04.005.
- Shah, N. P. Yogurt in Health and Disease Prevention; Academic Press: Massachusetts, 2017.
- Sezer, E.; Ayar, A.; Yılmaz, S. Ö. Fermentation of Dietary Fibre-Added Milk with Yoghurt Bacteria and L. Rhamnosus and Use in Ice Cream Production. Ferment. 2022, 9(1), 3. DOI: 10.3390/fermentation9010003.
- Ahmadi, A.; Milani, E.; Madadlou, A.; Mortazavi, S. A.; Mokarram, R. R.; Salarbashi, D. Synbiotic Yogurt-Ice Cream Produced via Incorporation of Microencapsulated lactobacillus acidophilus (la-5) and Fructooligosaccharide. J. Food Sci. Technol. 2012, 51(8), 1568–1574. DOI: 10.1007/s13197-012-0679-y.
- Rolon, M. L.; Bakke, A. J.; Coupland, J. N.; Hayes, J. E.; Roberts, R. F. Effect of Fat Content on the Physical Properties and Consumer Acceptability of Vanilla Ice Cream. J. Dairy. Sci. 2017, 100(7), 5217–5227. DOI: 10.3168/jds.2016-12379.
- Balthazar, C. F.; Silva, H. A.; Vieira, A. H.; Neto, R. P. C.; Cappato, L. P.; Coimbra, P. T.; Cruz, A. G. Assessing the Effects of Different Prebiotic Dietary Oligosaccharides in Sheep Milk Ice Cream. Food. Res. Int. 2007, 91, 38–46. DOI: 10.1016/j.foodres.2016.11.008.
- Isik, U.; Boyacioglu, D.; Capanoglu, E.; Erdil, D. N. Frozen Yogurt with Added Inulin and Isomalt. J. Dairy. Sci. 2011, 94(4), 1647–1656. DOI: 10.3168/jds.2010-3280.
- Muse, M. R.; Hartel, R. W. Ice Cream Structural Elements That Affect Melting Rate and Hardness. J. Dairy. Sci. 2004, 87(1), 1–10. DOI: 10.3168/jds.S0022-0302(04)73135-5.
- Guinard, J. X.; Zoumas‐Morse, C.; Mori, L.; Uatoni, B.; Panyam, D.; Kilara, A. Sugar and Fat Effects on Sensory Properties of Ice Cream. J. Food Sci. 2006, 62(5), 1087–1094. DOI: 10.1111/j.1365-2621.1997.tb15044.x.
- Cook, K. L. K.; Hartel, R. W. Mechanisms of Ice Crystallization in Ice Cream Production. Compr. Rev. Food Sci. Food Saf. 2010, 9(2), 213–222. DOI: 10.1111/j.1541-4337.2009.00101.x.
- Roland, A. M.; Phillips, L. G.; Boor, K. J. Effects of Fat Content on the Sensory Properties, Melting, Color, and Hardness of Ice Cream. J. Dairy. Sci. 1999, 82(1), 32–38. DOI: 10.3168/jds.S0022-0302(99)75205-7.
- Tansawat, R. Effect of Fat Content on Characteristics of Ice Cream Fortified with Calcium and Vitamin D3. The Thai J. Pharma. Sci. 2016, 40(3), 132–138.
- Akbari, M.; Eskandari, M. H.; Niakosari, M.; Bedeltavana, A. The Effect of Inulin on the Physicochemical Properties and Sensory Attributes of Low-Fat Ice Cream. Int. Dairy. J. 2016, 57, 52–55. DOI: 10.1016/j.idairyj.2016.02.040.
- Soukoulis, C.; Fisk, I. D.; Bohn, T. Ice Cream as a Vehicle for Incorporating Health‐Promoting Ingredients: Conceptualization and Overview of Quality and Storage Stability. Compr. Rev. Food Sci. Food Saf. 2014, 13(4), 627–655. DOI: 10.1111/1541-4337.12083.
- Wilbey, R. A.; Cooke, T.; Dimos, G. Effects of Solute Concentration, Overrun and Storage on the Hardness of Ice Cream. Proceedings of the international symposiumheld in Athens, Greece, September 18-19, 1997; W. Buch- Heim (ed.). International Dairy Federation: Brussels, Belgium, 1998; p. 186–187.
- Sofjan, R. P.; Hartel, R. W. Effects of Overrun on Structural and Physical Characteristics of Ice Cream. Int. Dairy. J. 2004, 14(3), 255–262. DOI: 10.1016/j.idairyj.2003.08.005.
- Di Criscio, T.; Fratianni, A.; Mignogna, R.; Cinquanta, L.; Coppola, R.; Sorrentino, E.; Panfili, G. Production of Functional Probiotic, Prebiotic, and Synbiotic Ice Creams. J. Dairy. Sci. 2010, 93(10), 4555–4564. DOI: 10.3168/jds.2010-3355.
- Alamprese, C.; Foschino, R.; Rossi, M.; Pompei, C.; Corti, S. Effects of Lactobacillus Rhamnosus GG Addition in Ice Cream. Int. J Dairy Technol. 2005, 58(4), 200–206. DOI: 10.1111/j.1471-0307.2005.00214.x.
- dos Santos Leandro, E.; de Araújo, E. A.; da Conceição, L. L.; de Moraes, C. A.; de Carvalho, A. F. Survival of Lactobacillus delbrueckii UFV H2b20 in Ice Cream Produced with Different Fat Levels and After Submission to Stress Acid and Bile Salts. J. Funct. Foods. 2013, 5(1), 503–507. DOI: 10.1016/j.jff.2012.10.003.
- Begley, M.; Gahan, C. G.; Hill, C. The Interaction Between Bacteria and Bile. EMS Microbiol. Rev. 2005, 29(4), 625–651. DOI: 10.1016/j.femsre.2004.09.003.
- Bezkorovainy, A. Probiotics: Determinants of Survival and Growth in the Gut. Am. J. Clin. Nutr. 2001, 73(2), 399s–405s. DOI: 10.1093/ajcn/73.2.399s.
- Kowalczyk, M.; Znamirowska-Piotrowska, A.; Buniowska-Olejnik, M.; Pawlos, M. Sheep Milk Symbiotic Ice Cream: Effect of Inulin and Apple Fiber on the Survival of Five Probiotic Bacterial Strains During Simulated in vitro Digestion Conditions. Nutr. 2022, 14(21), 4454. DOI: 10.3390/nu14214454.