
Abstract
SPARC is an acidic, cysteine-rich, calcium-binding member of the non-collagen glycoproteins originating in bone. Although implicated in the development of several cancers, the functions and mechanisms of SPARC remain unclear. The aim of this study was to investigate whether smooth muscle cell (SMC)-associated SPARC acts an important tumour suppressor in lung adenocarcinoma (LUAD). SPARC inhibits immune evasion in LUAD by suppressing CD276 functionality. We downloaded RNA-sequencing data from patients with LUAD in The Cancer Genome Atlas and identified a set of genes showing SMC-specific expression in these samples. We then screened for differentially expressed genes (DEGs). Enrichment analysis using the Gene Expression Omnibus identified key genes, while immune pathway analysis explored the expression of immune checkpoints involved in LUAD immune regulation. We further validated the differential expression of SPARC and CD276 using immunohistochemistry. Among the upregulated DEGs, SPARC exhibited high enrichment in SMCs, whereas 13 immune checkpoints, such as LAIR1 and CTLA4, were excluded. The infiltration level of the CD276 immune checkpoint was lower in the high-risk group than in the low-risk group. While our results suggest a correlation between SPARC, CD276 and LUAD, additional studies are needed to validate these findings and elucidate the underlying mechanisms before definitive conclusions can be drawn regarding their utility in clinical practice.
Introduction
Lung cancer (LC) remains a significant contributor to global cancer-related mortality, accounting for an estimated 1.8 million deaths annually [Citation1]. Among non-small cell lung cancers, lung adenocarcinoma (LUAD) stands out as the most common histopathological subtype [Citation2]. Currently, standard treatment for LUAD involves a combination of surgical intervention, chemotherapy, radiotherapy, targeted therapy and biotherapy. However, immunotherapy has garnered increasing attention as a promising treatment option that utilizes the innate immune system to attack tumour cells [Citation3]. A major impediment to its widespread adoption is immune evasion by LC cells through mutations or other changes. Thus, a deeper understanding of the molecular mechanisms underlying LC immune escape is necessary for the development of immunotherapy strategies with greater efficacy.
The tumour microenvironment (TME) encompasses a complex interplay of components such as abnormal tumour blood vessels, extracellular matrix elements, endothelial cells, smooth muscle cells, immune cells, pericytes and tumour-associated fibroblasts [Citation4]. The TME is crucial to tumour progression and immune resistance [Citation5,Citation6]. As any change to the TME affects the normal function of immune helper cells, drug distribution and penetration into the tumour tissue are also influenced [Citation7]. The role of cancer-associated fibroblasts (CAFs) has been a primary topic of research on the TME. Through the secretion of cytokines, chemokines, growth factors, and extracellular matrix proteins, CAFs play a crucial role in the crosstalk with infiltrating leukocytes, tumour growth, chemotherapy resistance, and immune evasion [Citation8]. At the same time, some studies have closely examined the impact of immune cells in the tumour microenvironment (TME) on tumour growth and progression. Additionally, research findings suggest that tumour-infiltrating immune cells (TIC) within the TME serve as a promising indicator of therapeutic efficacy [Citation9].
In contrast, the role of smooth muscle cells (SMCs) in the TME remains unclear, but their widespread presence in human systems implies they are key to tumour invasion, metastasis, angiogenesis, and intercellular adhesion [Citation10]. While there is compelling evidence supporting the role of stromal cells in tumour angiogenesis and extracellular matrix remodelling, our understanding may still be incomplete [Citation11]. Therefore, challenges persist in comprehending the influence of smooth muscle cells (SMCs) in the tumour microenvironment (TME) on tumour progression and immune response.
This study focused on the gap in research regarding LUAD occurrence and development, specifically as they relate to SMCs and related genes. Furthermore, we aimed to explore the mechanism of immune resistance to provide an empirical basis for LUAD prevention and treatment.
Materials and methods
Data retrieval
RNA-sequencing (RNA-seq) and clinical data for patients with LUAD were obtained from The Cancer Genome Atlas (TCGA; https://tcga-data.nci.nih.gov/tcga/). The set comprised 502 LUAD tissue samples and 49 adjacent normal lung tissue samples. Clinical data included patient age, sex, stage, tumour size, lymph node status, distant metastasis, survival duration, and survival status. To complement RNA-seq, we used the single-cell RNA-sequencing (scRNA-seq) dataset (GSE111907) from the Integrated Gene Expression Omnibus (https://www.ncbi.nlm.nih.gov/geo/) [Citation12]. The dataset consisted of 214 tissue microarray samples from 20 patients with LUAD and was screened from the tumour specimens of 36 patients with lung cancer. Six reference samples were used in the follow-up study (Stratagene Universal Reference Human RNA). Data analyses were performed in strict accordance with the user guidelines for the respective databases to ensure the authenticity and reliability of the results.
Analysis of the TME to obtain immune and stromal cell scores
The R package ‘estimate’ (http://bioconductor.org/packages/estimate/) was utilized to calculate the immune scores and matrix scores for each LUAD sample. The R language packages ‘survminer’ (http://bioconductor.org/packages/survminer/) and ‘survival’ (http://bioconductor.org/packages/survival/) were used to divide all LUAD samples into two groups: a high immunity/matrix rating group and a low immunity/matrix rating group. Kaplan–Meier survival analysis and log-rank tests were performed to evaluate the prognostic value of both immune and matrix scores. The correlation between immune and matrix scores and clinical characteristics was analysed using the R package ‘ggplot2’ (http://bioconductor.org/packages/ggplot2/) and Chi-square tests. Significance was set at p < .05.
Weighted gene co-expression network analysis
WGCNA is an algorithm based on high-throughput gene co-expression profiling widely used in the identification of gene co-expression networks in various diseases. In this study, expression patterns of a gene set in LUAD SMCs were determined with weighted gene co-expression network analysis (WGCNA) using the ‘Bioconductor’ R package. Next, differentially expressed genes (DEGs) between high- and low-SMC groups in the TCGA-LUAD dataset were identified and used as inputs for network construction. The optimal power value was selected using the ‘pickSoftThreshold’ function, and the adjacency matrix was transformed accordingly. Gene clustering analysis was performed using a topological overlap matrix (TOM), and a hierarchical clustering tree graph was constructed. Dynamic splicing modules were identified, and similar gene-expression patterns were divided into separate modules, each containing at least 30 genes. Cluster analysis was performed on these modules, and similar modules were merged. The expression profiles of each module were analysed using module characteristic genes (Mes), and the correlations between Mes and clinical traits were calculated. A correlation heat map was generated to visualize the results. The most relevant modules and their constituent genes were selected for further analysis.
Screening of DEGs and prognosis-related genes
The TIMER 2.0 database (http://timer.cistrome.org/) was used to determine the proportion of SMCs in the sample using the microenvironment of the cell population counter (MCP) algorithm. The median LUAD samples were divided into two groups, high and low, based on the proportion of SMCs, and DEGs were screened between the two groups using the R package ‘Limma’ (http://bioconductor.org/packages/Limma) with thresholds of |LogFC| > 1 and p < .05. Subsequently, a Cox regression of gene expression and survival was performed using the R package ‘survival’ (http://bioconductor.org/packages/survival/). Genes were considered to significantly influence prognosis if p < .05.
Construction of a prognostic risk model
A prognostic risk model was established by conducting multivariate Cox regression on the prognostic SMC-related genes. The risk score for each patient was calculated using the regression model. This score is determined by summing the regression coefficients of each gene, which are then multiplied by their corresponding expression levels. Furthermore, patients were divided into high- and low-risk groups using the median risk score. Kaplan–Meier survival analysis was used to compare the overall survival (OS) between the high-and low-risk groups with p < .05 as the threshold. The accuracy of the prognostic risk model was evaluated using the R package ‘timeROC’ (http://bioconductor.org/packages/timeROC) by conducting a time-dependent receiver operating characteristic (ROC) curve analysis and drawing the ROC curve. The results were visualized using the R package ‘rms’ (http://bioconductor.org/packages/rms/) by generating and plotting a function.
scRNA-seq
To elucidate the specificity of genes associated with SMCs, we conducted scRNA-seq analysis of the LUAD-related GSE111907 dataset using the ‘Seurat’ package in R (http://bioconductor.org/packages/Seurat). The cells and genes with poor quality were filtered out. The following filters were applied to eliminate low-quality cells: |LogFC| > 1, p < .05, cell count < 3, percentage of mitochondrial genes (percent. Mt) > 5%, and number of genes (nFeature_RNA) < 50. The logNormalize method was used to normalize the data, and the ‘FindVariableFeatures’ function was used to identify genes with high intercellular coefficients of variation.
Subsequently, principal component analysis (PCA) was employed to reduce the dimensionality of the RNA-seq data. The results were used for cell cluster analysis. The ‘FindClusters’ function (with a resolution parameter of 0.5) was employed to identify the major cell clusters, which were then visualized through t-distribution random neighbourhood embedding (tSNE) diagrams. The ‘FindAllMarkers’ function was used to identify marker genes for each cell cluster, and cell annotation was conducted using the ‘SingleR’ package in R (http://bioconductor.org/packages/SingleR/). Cell trajectory analysis and visualization were performed using the ‘monocle’ package in R (http://bioconductor.org/packages/monocle/). Significant marker genes for each branch were obtained through cell trajectory difference analysis under the aforementioned filtering conditions.
Functional analysis
The ‘clusterProfiler’ package in R (http://bioconductor.org/packages/clusterProfiler/) was used for Gene Ontology (GO) and Kyoto Encyclopedia of Genes and Genomes (KEGG) pathway analysis of DEGs. Significance was set at p < .05 and enrichment fraction at > 1.5. Results were visualized and annotated using the ‘Goplot’ package in R (http://bioconductor.org/packages/Goplot/). Additionally, GO functional annotation was performed to analyse the molecular function, cellular component, and biological process associated with the DEGs. The KEGG database was employed to examine pathways in which the DEGs demonstrated significant enrichment.
Immunoinfiltration analysis
The immune cell infiltration profile in the GSE111907 dataset was analysed using five algorithms: TIMER, CIBERSORT, QUANTISEQ, MCP-counter, XCELL, and EPIC. The algorithms were used to generate a heat map of immune cell infiltration and calculate the relative proportion of immune cells per sample. Differences in immune cell populations across different genotypes were analysed in R. Patients were then grouped into high- and low-expression categories based on the content of each immune cell type; between-group differences were determined with the Wilcoxon rank-sum test. Additionally, the relationship between immune cells and OS was evaluated using Kaplan–Meier survival analysis. Correlations between the risk score and expression levels of immune checkpoint inhibitor genes were calculated using difference and survival analyses. Significance was set at p < .05.
Immunohistochemistry
Subjects
This study enrolled 50 patients diagnosed with LUAD who were admitted to the Department of Thoracic Surgery of the First Affiliated Hospital of Zhengzhou University between January 2021 and May 2021. The inclusion criteria were as follows: (1) preoperative examination confirming the absence of distant metastasis; (2) no prior history of other malignancies; (3) no history of oral hormone therapy or immune drugs; (4) no prior exposure to radiotherapy, chemotherapy, or targeted therapy; (5) intraoperative pathology confirming LUAD diagnosis; (6) no intraoperative blood transfusion or conversion to open surgery; and (7) no major complications during or after surgery. All samples (paraffin sections of surgically removed lung tissue) were obtained with informed consent, and the study was approved by the Clinical Research Ethics Committee of the First Affiliated Hospital of Zhengzhou University.
Immunohistochemical assay
The samples were fixed in 4% paraformaldehyde and dehydrated using a dehydration machine (Donatello, DIPATH, Ita). Paraffin specimens were then sliced into 5 μm sections. Following deparaffinization and heat-induced antigen retrieval, the sections were blocked with 5% BSA (Bovine Serum Albumin). Subsequently, the sections were incubated overnight at 4 °C with SPARC antibody (1:100, Cat. No. Ab225716, Abcam, Cambridge, UK) and CD276 antibody (1:100, Cat. No. Ab227679, Abcam). After this, the sections were incubated with a species-specific HRP conjugated goat anti-rabbit secondary antibody (1:200, Cat. No. GB23303, ServiceBio, Wuhan, China) for 1 h. The samples were then stained with 3,3′-diaminobenzidine (DAB), counterstained with haematoxylin, and observed under an optical microscope (CX43, Olympus, Tokyo, Japan) by three experienced pathologists to score the IHC results, with three fields of view being randomly selected for each sample. The staining strength was evaluated on a scale of 0 to 3. A score of 0 indicated no staining, 1 indicated weak staining (light yellow), 2 indicated moderate staining (yellowish brown), and 3 indicated strong staining (brown). Scores of ≥2 were classified as high expression, while scores <2 were classified as low expression. The expression of SPARC and CD276 was then correlated with clinical data, including TNM stage, survival time, and recurrence.
Statistical analysis
Data were processed and analysed in R version 4.1.3(R Foundation, Vienna, Austria), GraphPad Prism 8.0 (San Diego, CA, USA), and SPSS version 23.0 (IBM, Ehningen, Germany). Chi-square tests were used to compare differences in clinical features between risk groups. Kaplan–Meier survival analysis was used to compare survival differences between the two groups. ROC and DCA curves were endpoints to verify the accuracy and superiority of the prognostic model. Cox regression analysis was used to determine independent predictors of OS in patients with LUAD. Differences were considered statistically significant at the level of p < .05.
Results
Relationship between stromal score and prognosis in patients with LUAD
Immune and stromal cells per sample were quantified using the ESTIMATE package, based on FPKM data from TCGA-LUAD mRNA. Immune scores ranged from −883.446 to 3404.030, while stromal scores ranged from −1652.443 to 2170.396. Based on the optimal cut-off values of these scores, samples were divided into two groups. Kaplan–Meier survival analysis was performed to evaluate the association between immune/stromal scores and OS. Both immune score () and stromal score () were positively correlated with OS (p = .028). In addition, we investigated the relationship between the two scores and clinical features. The high-stage group had lower immune scores than the low-stage group (stage I, stage III, p = .011), (stage I, stage IV, p = .045) (), while the stromal score decreased with increasing tumour stage ().
Figure 1. Relationship between clinical stage, OS and immune matrix score. (A) The immune scores of TCGA samples were significantly correlated with the OS of patients with LUAD. (B) Stromal scores of TCGA samples. (C) The immune scores of high-stage groups were significantly lower than those of the low-stage groups. (D) Sromal scores in different stage groups.
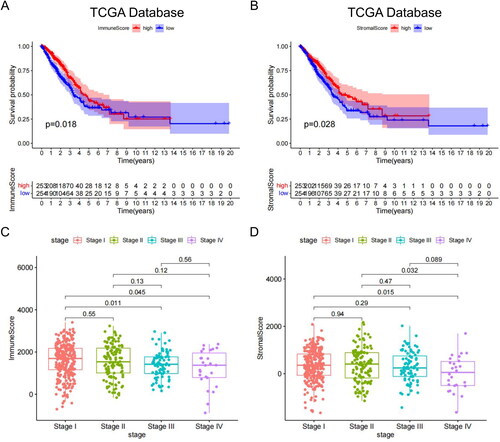
Overall, both the immune and stromal scores were significantly associated with the clinical stage and prognosis of patients with LUAD. Higher scores in these patients tended to indicate better prognosis. These results provide insight into the potential prognostic value of the two scores in LUAD and warrant further investigation.
Identification of SMC-related genes
We used the MCP counter algorithm to assess the SMC abundance in LUAD samples from TCGA. The results indicated that the SMC abundance was correlated with the matrix (R = 0.49; ) and immune scores (R = 0.037; ). Additionally, the SMC abundance decreased significantly as the tumour stage increased ().
Figure 2. SMC abundance correlation analysis. (A) SMC was significantly correlated with stromal scores. (B) SMC was significantly correlated with immune scores. (C) SMC abundance significantly decreased as tumour stage increased. (D) Differentially expressed genes between groups with high- and low-SMC content. (E) Sample-level clustering. (F) A scale-free network was constructed with β = 5 (scale-free R2 = 0.9). (G) Mean connectivity of network result. (H) A topological overlap matrix was used to identify co-expression modules; the blue-green module was most significantly correlated with SMC abundance.

Next, we divided the LUAD samples into groups based on high- and low-SMC content. Analysis in R identified 1486 genes that were significantly differentially expressed between these two groups (). We used these DEGs to construct co-expression networks with WGCNA. After the hierarchical clustering of all samples, we constructed a network by connecting mRNAs with a Pearson correlation coefficient greater than the threshold (R2 cutoff = 0.9; ). The correlation matrix was then transformed into an adjacency matrix to approximate the scale-free topology, with β = 5 (scale-free R2 = 0.9) selected as the soft threshold (). Next, we applied a TOM to identify co-expression modules; six were found in TCGA-LUAD. The blue-green module was most strongly correlated with SMC abundance (coefficient = 0.15; ). As a result, 372 genes in the blue-green module were considered SMC-related genes.
These data support the hypothesis that SMCs play a role in regulating LUAD progression.
Identification of four SMC genes associated with prognosis in LUAD
We referred to TCGA data and constructed a risk model for patient prognosis using DEGs related to SMCs. First, our analysis identified 32 DEGs (22 upregulated and 10 downregulated; and Figure S1). Univariate Cox regression revealed that 12 genes were closely associated with patient prognosis (). Multivariate Cox analysis identified four genes (SPARC, NME1, CKN2 and PTPRC) for constructing the SMC risk model. Based on the coefficients of these genes, the risk score for each patient was calculated as follows: risk score = (0.357193279 × Exp SPARC) + (0.472640948 × Exp NME1) + (−0.097896054 × Exp CKN2) + (0.159860642 × Exp PTPRC). The median risk scores served as a basis to divide the samples into high- and low-risk groups.
Figure 3. Differentially expressed genes and survival in LUAD patients. (A) Differentially expressed genes (DEGs, n = 32), with upregulated genes in red and downregulated genes in green. (B) Upregulated genes were significantly associated with prognosis in the TCGA-LUAD cohort. (C) Kaplan–Meier survival analysis showed that the high-risk group had a shorter survival time than the low-risk group (D) Univariate independent prognostic analyses. (E) Multivariate independent prognostic analyses. (F) The ROC curve was constructed based on the SMC risk model for LUAD diagnosis. (G) OS predictions for patients with LUAD at one, three, and five years. (H) Predicted OS values for patients were consistent with actual values.
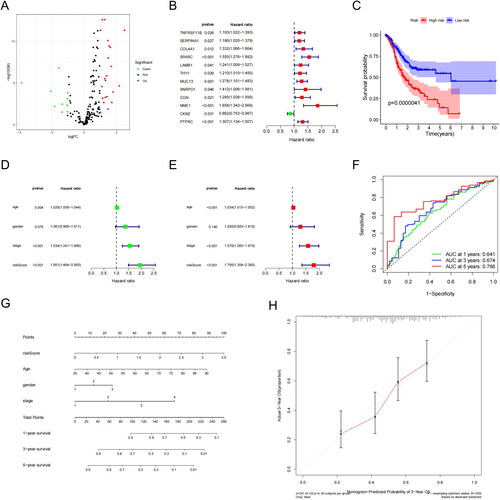
Survival analysis of all LUAD samples included in the risk model revealed that the high-risk group had a significantly lower survival rate and duration than the low-risk group (p = .0000041; ). We then verified the model accuracy and superiority through univariate and multifactorial independent prognostic analyses, which demonstrated that the model based on riskscore could function as an independent survival prognostic factor (). The areas under the time-dependent ROC curve were 0.641 (one-year survival), 0.674 (three-year survival) and 0.766 (five-year survival), all greater than 0.5, indicating high prognostic accuracy (). Finally, a line graph was constructed to predict the one-, three- and five-year OS for patients with LUAD (). The calibration curve revealed a well-performing line graph with significantly improved OS predictions ().
Identifying target genes in SMCs
We acquired scRNA-seq data from 214 LUAD tissue microarrays and normal samples from the scRNA-seq dataset GSE111907. Data were preprocessed using the log-normalization method for quality control and normalization (Figure S2(A,B)). The ‘FindVariableFeatures’ function in R was then applied to identify the first 1500 genes that varied between cells. We selected the top two most variable genes for visualization using a feature variance map (Figure S2(C,D)).
Next, we performed PCA to determine the characteristic gene of each principal component () and its expression across all samples (). Through t-SNE cluster analysis, we identified four distinct clusters (), along with marker genes for each cluster. Dimension reduction using uniform manifold approximation and projection (UMAP) revealed four cell subgroups: macrophages, epithelial cells, endothelial cells and SMCs. Hence, the specific expression of marker genes can be used to identify these four cell subgroups in future studies.
Figure 4. SPARC highly expressed in SMCs. (A) The heatmap of principal component analysis identifying feature genes in each principal component, followed by gene expression analysis in samples. (B) Top 20 gene expression in each principal component. (C) The heatmap of marker genes in clusters. (D) UMAP visualization revealed four major cell subgroups: macrophages, epithelial cells, endothelial cells, and smooth muscle cells. (E) Cluster plot for the four cell groups. (F) Cell developmental trajectories and cell trajectory times for the groups. (G) Cell types plot for the groups (H) Bubble chart for the four SMC genes associated with prognosis, with SPARC highly expressed in SMCs. (I) Scatter plot of four SMC genes.
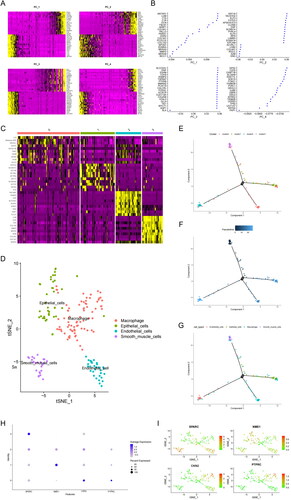
We then investigated cell developmental trajectories, trajectory time, type and cluster for the four cell subgroups (). Subsequently, we performed GO analysis on marker genes that were differentially expressed across cell clusters. The results indicated that they were mainly involved in the regulation of extracellular matrix organization and vascular development (Figure S3(A,B)). Additionally, KEGG analysis demonstrated that the marker genes participated primarily in pathways related to ‘focal adhesion’ and ‘fluid shear stress and atherosclerosis’ (Figure S3(C,D)). Finally, a bubble chart and scatterplot allowed us to select four prognostic genes for SMCs, with SPARC being especially upregulated (). Thus, SPARC was further analysed as the primary target gene in SMCs.
Characterization of SPARC in LUAD
We analysed the SPARC expression levels in a sample set from TCGA-LUAD to assess its impact on OS. We observed that SPARC mRNA was expressed at lower levels in LUAD tissues than in normal tissues (). Furthermore, survival analysis revealed that OS improved significantly in patients with LUAD with increased SPARC mRNA expression (p = 1.264e − 03, ). Corroborating this result, clinical correlation analysis identified a negative correlation between SPARC expression and the LUAD stage (p = .0206, ). Therefore, we hypothesize that SPARC likely functions as a tumour suppressor gene in LUAD progression.
Figure 5. The role of SPARC in LUAD and CD276 immune checkpoint. (A) SPARC was expressed at low levels in LUAD. (B) Survival analysis: SPARC expression was significantly correlated with OS in patients with LUAD. (C) Clinical correlation analysis: SPARC was negatively correlated with LUAD tumour stage. (D) Sixty-two immune cells were differentially expressed between the two risk groups (high SPARC expression versus low SPARC expression). (E) Box plots of immune pathway analysis showing 13 pathways that differed significantly between the two groups. (F) Box plot analysis of DEGs. The CD276 immune checkpoint showed low infiltrating levels in the high-risk group. All original data are from TCGA data. All panels are SPARC mRNA expression.
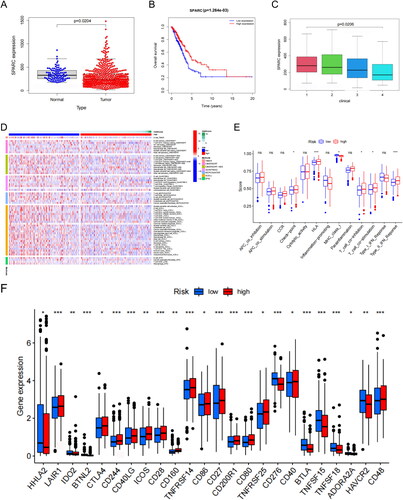
To evaluate the relationship between SPARC and immune cells in the TME of patients with LUAD, we divided all samples into high- and low-SPARC expression groups. Five algorithms (TIMER, CIBERSORT, QUANTISEQ, MCP-counter, XCELL and EPIC) were used to generate an infiltration heat map of immune cells. The results suggested that 62 immune cells were differentially expressed between the two risk groups (). Immune pathway analysis found significant differences between the two risk groups in the active status of 13 pathways (p < .05). Three immune functions were more active in the low-risk group than in the high-risk group ().
Further analysis confirmed that the infiltration levels of CD276 immune-related molecules were lower in the high-risk group, whereas the infiltration levels of 13 other immune-related molecules, including LAIR1 and CTLA4, were lower in the low-risk group (p < .05; ). CD276 is a protein involved in tumour cell proliferation and immune evasion. We, therefore, speculate that SPARC probably acts as an adverse factor in LUAD development and participates in cancer immune regulation by inhibiting CD276 expression. These suggestions provide a basis for further investigation.
SPARC prevented LUAD immune escape by inhibiting CD276 expression
Immunohistochemical (IHC) analysis of paraffin sections of surgically removed lung tissue from our patients showed that the SPARC expression was significantly lower in LUAD tissues than in surrounding non-cancerous tissues. In contrast, the results () showed that CD276 expression was significantly higher in LUAD tissues. Moreover, the expression of SPARC and CD276 was negatively correlated in LUAD tissues. SPARC was downregulated in patients (), whereas CD276 was highly expressed (). We considered both to be hub genes of LUAD and analysed the differential expression at the protein level using IHC ().
Figure 6. Immunohistochemistry results. (A)SPARC:IHC staining of normal lung tissue. (B) SPARC:IHC staining of tumour lung tissue. (C) CD276:IHC staining of normal lung tissue. (D) CD276:IHC staining of tumour lung tissue. (E) Quantitation of hub gene expression at the level of protein. *p < .05; **p < .01. Scale bars = 50 µm; 400× magnification (CX43, Olympus, Tokyo, Japan).
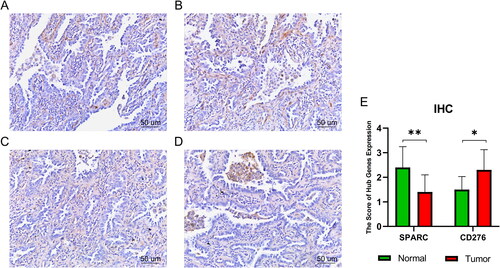
Our findings suggest that the anti-LUAD effects of SPARC may occur through inhibiting CD276 expression. This suggestion highlights the potential therapeutic value of targeting SPARC. Further research is necessary to fully understand the mechanisms underlying the relationship between SPARC and CD276 in LUAD. Such information will allow us to better determine the most effective means of manipulating these proteins for treatment purposes.
Discussion
Despite advancements in chemotherapy and radiotherapy, the patient survival rate for LUAD remains low, emphasizing the pressing need for innovative treatment strategies [Citation13,Citation14]. In this context, the key contribution of our study is the demonstration of the crucial role of SPARC in LUAD incidence and progression, specifically that it can inhibit immune evasion.
SPARC is an acidic, cysteine-rich, calcium-binding member of the non-collagen glycoproteins originating from bone. SPARC, also known as osteonectin or basal membrane 40 protein [Citation15], is widely expressed in the body [Citation16–18], specifically in tissues related to embryonic development, remodelling and repair. These include placental trophoblasts, normal chondrocytes and vascular SMCs. Multiple studies have demonstrated that SPARC contributes to regulating cell proliferation, angiogenesis, tumorigenesis, and tumour invasion/progression in various cancers [Citation19], including oesophageal cancer [Citation20], melanoma, glioma, kidney cancer and LUAD [Citation21]. However, the multifunctional nature of SPARC means that its role can differ depending on the microenvironment [Citation22]. Therefore, SPARC also has a tumour-suppressing effect in various cancer tissues, including colorectal [Citation23], pancreatic [Citation24], prostate [Citation25], and breast cancer [Citation26], as well as neuroblastoma [Citation27]. Consistent with our findings, prior research has shown that high SPARC expression inhibits LC progression [Citation28].
In contrast, CD276 has been linked to immune evasion [Citation29], tumour angiogenesis [Citation30], and chemotherapy resistance in multiple cancers [Citation31,Citation32]. Abnormal CD276 expression in tumour cells increases the adhesion ability of cell adhesion proteins, leading to enhanced migration and invasion of tumour cells [Citation33]. High CD276 expression in LUAD tissues can also result in poor prognosis in patients with LUAD by reducing chemotherapy efficacy [Citation34,Citation35]. However, the expression and functions of SPARC and CD276 in LUAD are not fully understood [Citation36].
In our study, histopathological analysis revealed that LUAD tissues had lower SPARC expression than paracancerous tissues, consistent with the results of our bioinformatics analysis. Furthermore, our findings suggest that SMCs play a role in regulating LUAD growth and development. Both immune and stromal scores were significantly associated with the clinical stage and prognosis of patients with LUAD; higher scores in these patients tended to indicate better prognosis. These results provide insight into the potential prognostic value of the two scores in LUAD and warrant further investigation. Functional analysis indicated that SPARC downregulation in LUAD was associated with increased cell proliferation, angiogenesis and tumour aggressiveness. In contrast, we observed elevated CD276 expression in LUAD tissues, corroborating previous research, suggesting that CD276 is important to LUAD progression [Citation37]. Furthermore, we confirmed a negative correlation between SPARC and CD276 in LUAD tissues, implying that SPARC could potentially inhibit LUAD progression by suppressing CD276.
Our study provided evidence that the SMC-related gene SPARC likely plays an important role as a tumour suppressor in LUAD. Specifically, SPARC probably prevents the immune escape of LUAD by inhibiting CD276 expression. Notably, available studies suggest that CD276 may be an ideal tumour antigen target, providing a feasible direction for clinical translation [Citation30,Citation38]. However, further research is necessary to fully determine the underlying mechanisms and validate our findings in larger animal models, and larger cohorts of patients. Nevertheless, these results suggest that both SPARC and CD276 are promising predictors and potential targets for LUAD diagnosis, prognosis and treatment.
Conclusions
The results from our study indicate that the SMC-related gene SPARC likely plays an important role as a tumour suppressor in LUAD. Specifically, SPARC could prevent immune escape of LUAD via inhibiting CD276 expression. However, further research is necessary to fully elucidate the underlying mechanisms.
Ethics approval
The Ethics Committee of The First Affiliated Hospital of Zhengzhou University provided ethical approval for the experiments involving human beings in this study ([2021]0139), which were guided by the Declaration of Helsinki.
Consent form
Written informed consent was obtained from the donors or their relatives.
Author contributions
Y Zhao: Formal analysis, Investigation, Visualization, Writing - Original Draft. HL: Methodology, Resources, Writing - Original Draft. Y Zhang: Conceptualization, Visualization, Methodology, Validation. ZY: Data curation, Formal analysis. XC: Data curation, Software. YY: Conceptualization, Project administration, Funding acquisition, Resources, Writing - Review & Editing, Supervision. All authors have read and approved the final version of the paper.
Supplemental Material
Download MS Word (1.8 MB)Acknowledgments
The authors would like to thank Editage (www.editage.cn) for their English language editing.
Disclosure statement
No potential conflict of interest was reported by the author(s).
Data availability statement
Anonymized data will be made available from the corresponding author [YY] upon reasonable request.
Additional information
Funding
References
- Sung H, Ferlay J, Siegel RL, et al. Global cancer statistics 2020: GLOBOCAN estimates of incidence and mortality worldwide for 36 cancers in 185 countries. CA Cancer J Clin. 2021;71(3):1–14. doi: 10.3322/caac.21660.
- Chen P, Liu Y, Wen Y, et al. Non-small cell lung cancer in China. Cancer Commun. 2022;42(10):937–970. doi: 10.1002/cac2.12359.
- Hofmarcher T, Lindgren P, Wilking N. Systemic anti-cancer therapy patterns in advanced non-small cell lung cancer in Europe. J Cancer Policy. 2022;34:100362. doi: 10.1016/j.jcpo.2022.100362.
- Li XY, Su LX, Chen WX, et al. Clinical implications of necroptosis genes expression for cancer immunity and prognosis: a pan-cancer analysis. Front Immunol. 2022;13:882216. doi: 10.3389/fimmu.2022.882216.
- Passarelli A, Aieta M, Sgambato A, et al. Targeting immunometabolism mediated by CD73 pathway in EGFR-mutated non-small cell lung cancer: a new hope for overcoming immune resistance. Front Immunol. 2020;11:1479. doi: 10.3389/fimmu.2020.01479.
- Quail DF, Joyce JA. Microenvironmental regulation of tumor progression and metastasis. Nat Med. 2013;19(11):1423–1437. doi: 10.1038/nm.3394.
- Genova C, Dellepiane C, Carrega P, et al. Therapeutic implications of tumor microenvironment in lung cancer: focus on immune checkpoint blockade. Front Immunol. 2021;12:799455. doi: 10.3389/fimmu799455.
- Wong KY, Cheung AH-K, Chen B, et al. Cancer-associated fibroblasts in nonsmall cell lung cancer: from molecular mechanisms to clinical implications. Int J Cancer. 2022;151(8):1195–1215. doi: 10.1002/ijc.34127.
- Gajewski TF, Schreiber H, Fu Y-X. Innate and adaptive immune cells in the tumor microenvironment. Nat Immunol. 2013;14(10):1014–1022. doi: 10.1038/ni.2703.
- Kang I, Yoon DW, Braun KR, et al. Expression of versican V3 by arterial smooth muscle cells alters tumor growth factor β (TGF β)-, epidermal growth factor (EGF)-, and nuclear factor κB (NFκB)-dependent signaling pathways, creating a microenvironment that resists monocyte adhesion. J Biol Chem. 2014;289(22):15393–15404. doi: 10.1074/jbc.M113.544338.
- Bussard KM, Mutkus L, Stumpf K, et al. Tumor-associated stromal cells as key contributors to the tumor microenvironment. Breast Cancer Res. 2016;18(1):84. doi: 10.1186/s13058-016-0740-2.
- Gentles AJ, Hui AB, Feng W, et al. A human lung tumor microenvironment interactome identifies clinically relevant cell-type cross-talk. Genome Biol. 2020;21(1):107. doi: 10.1186/s13059-020-02019-x.
- Mamdani H, Matosevic S, Khalid AB, et al. Immunotherapy in lung cancer: current landscape and future directions. Front Immunol. 2022;13:823618. doi: 10.3389/fimmu.2022.823618.
- Tian Y, Zhai X, Yan W, et al. Clinical outcomes of immune checkpoint blockades and the underlying immune escape mechanisms in squamous and adenocarcinoma NSCLC. Cancer Med. 2021;10(1):3–14. doi: 10.1002/cam4.3590.
- Tai IT, Tang MJ. SPARC in cancer biology: its role in cancer progression and potential for therapy. Drug Resist Updat. 2008;11(6):231–246. doi: 10.1016/j.drup.2008.08.005.
- Porter PL, Sage EH, Lane TF, et al. Distribution of SPARC in normal and neoplastic human tissue. J Histochem Cytochem. 1995;43(8):791–800. doi: 10.1177/43.8.7622842.
- Li T, Tan X, Zhu S, et al. SPARC induces phenotypic modulation of human brain vascular smooth muscle cells via AMPK/mTOR-mediated autophagy. Neurosci Lett. 2019;712:134485. doi: 10.1016/j.neulet.2019.134485.
- Chen S, Zou Q, Chen Y, et al. Regulation of SPARC family proteins in disorders of the Central nervous system. Brain Res Bull. 2020;163:178–189. doi: 10.1016/j.brainresbull.2020.05.005.
- Nagaraju GPC, Sharma D. Anti-cancer role of SPARC, an inhibitor of adipogenesis. Cancer Treat Rev. 2011;37(7):559–566. doi: 10.1016/j.ctrv.2010.12.001.
- Chen Y, Zhang Y, Tan Y, et al. Clinical significance of SPARC in esophageal squamous cell carcinoma. Biochem Biophys Res Commun. 2017;492(2):184–191. doi: 10.1016/j.bbrc.2017.08.043.
- Feng J, Tang L. SPARC in tumor pathophysiology and as a potential therapeutic target. Curr Pharm Des. 2014;20(39):6182–6190. doi: 10.2174/1381612820666140619123255.
- Arnold SA, Brekken RA. SPARC: a matricellular regulator of tumorigenesis. J Cell Commun Signal. 2009;3(3-4):255–273. doi: 10.1007/s12079-009-0072-4.
- Chlenski A, Cohn SL. Modulation of matrix remodeling by SPARC in neoplastic progression. Semin Cell Dev Biol. 2010;21(1):55–65. doi: 10.1016/j.semcdb.2009.11.018.
- Neuzillet C, Tijeras-Raballand A, Cros J, et al. Stromal expression of SPARC in pancreatic adenocarcinoma. Cancer Metastasis Rev. 2013;32(3-4):585–602. doi: 10.1007/s10555-013-9439-3.
- Shin M, Mizokami A, Kim J, et al. Exogenous SPARC suppresses proliferation and migration of prostate cancer by interacting with integrin beta1. Prostate. 2013;73(11):1159–1170. doi: 10.1002/pros.22664.
- Ma J, Gao S, Xie X, et al. SPARC inhibits breast cancer bone metastasis and may be a clinical therapeutic target. Oncol Lett. 2017;14(5):5876–5882. doi: 10.3892/ol.2017.6925.
- Chlenski A, Guerrero LJ, Peddinti R, et al. Anti-angiogenic SPARC peptides inhibit progression of neuroblastoma tumors. Mol Cancer. 2010;9(1):138. doi: 10.1186/1476-4598-9-138.
- Huang Y, Zhang J, Zhao Y-Y, et al. SPARC expression and prognostic value in non-small cell lung cancer. Chin J Cancer. 2012;31(11):541–548. doi: 10.5732/cjc.012.10212.
- Zhao B, Li H, Xia Y, et al. Immune checkpoint of B7-H3 in cancer: from immunology to clinical immunotherapy. J Hematol Oncol. 2022;15(1):153. doi: 10.1186/s13045-022-01364-7.
- Feng R, Chen Y, Liu Y, et al. The role of B7-H3 in tumors and its potential in clinical application. Int Immunopharmacol. 2021;101(Pt B):108153. doi: 10.1016/j.intimp.2021.108153.
- Getu AA, Tigabu A, Zhou M, et al. New frontiers in immune checkpoint B7-H3 (CD276) research and drug development. Mol Cancer. 2023;22(1):43. doi: 10.1186/023-01751-9.
- Zhou W-T, Jin W-L. B7-H3/CD276: an emerging cancer immunotherapy. Front Immunol. 2021;12:701006. doi: 10.3389/fimmu.2021.701006.
- Wu S, Zhao X, Wu S, et al. Overexpression of B7-H3 correlates with aggressive clinicopathological characteristics in non-small cell lung cancer. Oncotarget. 2016;7(49):81750–81756. doi: 10.18632/oncotarget.13177.
- Malapelle U, Parente P, Pepe F, et al. B7-H3/CD276 inhibitors: is there room for the treatment of metastatic non-small cell lung cancer? Int J Mol Sci. 2022;23(24):16077. doi: 10.3390/ijms232416077.
- Yang S, Wei W, Zhao Q. B7-H3, a checkpoint molecule, as a target for cancer immunotherapy. Int J Biol Sci. 2020;16(11):1767–1773. doi: 10.7150/ijbs.41105.
- Wong SLI, Sukkar MB. The SPARC protein: an overview of its role in lung cancer and pulmonary fibrosis and its potential role in chronic airways disease. Br J Pharmacol. 2017;174(1):3–14. doi: 10.1111/bph.13653.
- Liu S, Liang J, Liu Z, et al. The role of CD276 in cancers. Front Oncol. 2021;11:654684. doi: 10.3389/fonc.2021.654684.
- Kontos F, Michelakos T, Kurokawa T, et al. B7-H3: an attractive target for antibody-based immunotherapy. Clin Cancer Res. 2021;27(5):1227–1235. doi: 10.1158/1078-0432.Ccr-20-2584.