
 ?Mathematical formulae have been encoded as MathML and are displayed in this HTML version using MathJax in order to improve their display. Uncheck the box to turn MathJax off. This feature requires Javascript. Click on a formula to zoom.
Abstract
The identification and analysis of lipid droplets in pathological images are pivotal owing to the variations in their size, shading and shape. The development of an artificial intelligence-based automatic detection method can facilitate the analysis of complex pathological images and provide essential support to pathologists. In this paper, we introduce a novel approach for the automated detection of lipid droplets, employing a limited set of images and a modest application of reinforcement learning (RL). Several filters tailored to lipid droplet size and contrast are used in combination. Through the combination of multiple filters using RL, potential lipid droplet regions are identified within pathological images. Subsequently, a random forest classifier is employed to distinguish between normal and lipid droplet images. Evaluation guided by the expertise of two pathologists with over 10 years of clinical experience indicated the hierarchical extraction of lipid droplets with consistent size and shading in pathological tissue images utilizing RL. The proposed method successfully detected lipid droplets in pathological images and facilitated the determination of both the quantity and distribution of lipid droplets within cells. The results highlight the efficacy of the approach in lipid droplet detection. This method is also useful for small to medium-sized fat droplets, which are relatively difficult for humans to detect from their morphology.
Introduction
Lipid droplets in histopathological images, hereafter referred to as tissue images, undergo complex changes in size, shading and shape. Even seasoned pathologists may encounter challenges in identifying them, leading to time-consuming decision-making processes. Moreover, the dissolution of lipid components during the preparation of formalin-fixed paraffin-embedded (FFPE) specimens further complicates reliable detection. FFPE specimens commonly utilized in pathological analysis necessitate the use of frozen tissues for accurate lipid droplet detection. However, frozen tissues are not routinely prepared or stored. The development of techniques capable of supporting pathologists in the analysis of tissue images containing complex features or detecting lipid droplets using FFPE specimens remains desirable [Citation1,Citation2]. Various methods have been devised to analyse tissue images and aid pathologists, including support vector machines (SVMs) and local autocorrelation for classifying normal and abnormal images [Citation3,Citation4], which involves cytoplasmic segmentation and clustering to analyse cell nuclei and cytoplasm features. Other methods that use convolutional neural networks for the pathological classification of tissue images have also been employed [Citation5,Citation6]. Additionally, applications of deep learning such as generative models and one-class classification have been proposed to improve object detection and identification for anomalous patterns [Citation7–12]. Consequently, object detection and discrimination methods are expected to yield superior results in the context of tissue images.
However, the analysis of complex tissue images typically demands a considerable number of training images and extensive learning, as observed in previous methods [Citation2–12]. Indeed, in recent years, machine learning and reinforcement learning (RL) have been reported for use in medicine to potentially aid histological assessment [Citation13–15]. In cases where the target is a rare disease or lesion, acquiring a large number of training images becomes challenging. Therefore, approaches relying heavily on extensive learning materials pose practical limitations. A previous paper described the importance of lipid droplets in cancer and the difficulty of detecting them [Citation16]. The detection of lipid droplets is also very important for elucidating pathological conditions [Citation17]. While most people do not develop severe liver problems, in some people, fat accumulation in the liver can lead to serious liver disease [Citation18]. Droplet detection can be utilized to discover new aspects of lipid accumulation and droplet biology, which may impact the understanding and treatment of related diseases, including obesity, atherosclerosis, type 2 diabetes and hepatic fatty degeneration [Citation19]. In this paper, we propose a method for the automatic detection of lipid droplets using RL with minimal training images and learning. A classifier, such as the k-nearest neighbour (k-NN) method, SVM or random forest (RF), is employed for lipid droplet detection. The methodology involves the preparation of several filters based on lipid droplet size and contrast. These filters are thereafter adapted for lipid droplet candidates, which are subsequently isolated from the tissue image. Q-learning, which facilitates the update and learning of action values through trial and error, is applied to extract lipid droplets. Finally, the classifier distinguishes between non-lipid and lipid droplet images from the extracted lipid droplet candidates for accurate detection. This research is novel in that fat droplets can be detected using less learning through RL. Another notable feature is that the detection method does not depend on the size of lipid droplets.
Materials and methods
Materials
The study design was retrospective. Human liver tissue specimens extracted and anonymized by the Department of Diagnostic Pathology at Oita University Faculty of Medicine were observed using an optical microscope (OLYMPUS BX51-TF), an objective lens (UPlanSApo, 20×, 40×) and a camera (OLYMPUS DP73). A total of 10 HE-stained images collected in 2018 were utilized, with five designated as normal images (absence of lipid droplets) and five as lipid droplet images. Each image had dimensions of 1600 × 1200 pixels (approximately 57.7 K pixels per inch), and the colour gradation was set at 8 bits. To expedite processing, the number of vertical and horizontal pixels was halved, and the gradation was compressed to 8 bits, with a luminance value of 0 representing black and 255 representing white. This study established a minimum lipid droplet area size of 40 pixels. The development environment used was Python 3.10.12 and OpenCV 4.8.0.
Overview and flow of lipid droplet detection method
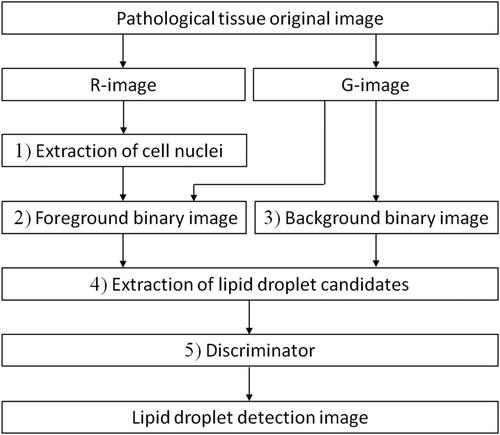
illustrates the overall detection method. Initially, the colour image was segmented into RGB components, resulting in the creation of red (R) and green (G) component images, denoted as the R-image and G-image, respectively (for the blue component image, there is almost no difference in contrast between lipid droplets and cell nuclei). Subsequently, the R-image underwent an error diffusion process, generating a binary point image, which was further subjected to a median filter for the extraction of a binary cell nucleus image. The proposed method involved applying the error diffusion method to the G-image, creating a binary point image. The number of white pixels (brightness value 255) within each 3 × 3-pixel region of the point image was established as a rank, and foreground binary images corresponding to these ranks were generated using a defined threshold. By utilizing the nucleus image, the cell nucleus was removed from the foreground binary images. Additionally, a background binary image was created through adaptive binarization and morphology processing on the G-image, facilitating the extraction of lipid droplet candidates. Q-learning was used to optimize filter combinations based on lipid droplet size and density contrast using four types of foreground and background binary images, ultimately extracting lipid droplet candidates. The final step involved a classifier detecting lipid droplets by distinguishing normal images from the identified lipid droplet candidates. RL was employed to extract target objects.
Figure 1. Flowchart describing the proposed method.
Extraction of the nucleus images
Initially, a binary point image was generated from the R-image using the error diffusion method, employing pseudo-gradation. illustrates the weights diffused through the error diffusion method of the proposed method.
Next, the binary point image underwent black-and-white reversal processing. Subsequently, a nucleus image was extracted from the R-image by a closing process in which a 3 × 3 kernel with all pixel values being 1 was applied twice to the black-and-white inverted image. displays a 1/6 area of both the original image and the nucleus image.
Creation of foreground binary image
In the proposed method, the binary point image, which was derived by applying the error diffusion method to the G-image, underwent a definition of rank based on the count of white pixels within the 3 × 3-pixel filter area; this count served as the threshold for binarization.
When the number of white pixels in the filter area equalled or exceeded the preset rank, a white pixel was generated. Conversely, if it fell below the rank, binary image A was formed with a black pixel. Subsequently, by subtracting the cell nucleus image obtained during the preprocessing from binary image A, a foreground binary image, excluding the nucleus, was obtained, as shown in .
Creation of background binary image
The G-image underwent adaptive binarization using a 7 × 7-pixel mean value filter as a threshold, and opening processing was performed once using a 3 × 3 kernel with all pixel values being 1. This sequence of operations resulted in the formation of a background binary image, where white regions represented extracted lipid droplets.
Extraction of lipid droplet candidates
An AND operation (logical product between two images) was performed at identical coordinates on the foreground and background binary images to extract lipid droplet candidates. In this process, a binary image was generated with a white pixel if the luminance value of both corresponding pixels was 255; otherwise, it was generated with a black pixel ().
Additionally, lipid droplet candidates were identified, segmented, and labelled as distinct regions using the Q-learning described below. This method leveraged Q-learning, which was selected for its ease of implementation as a form of RL. The Q-learning mechanism captures variations in the size and contrast of lipid droplet images by employing a combination of filter size and rank.
Adjusting the size of the lipid droplet enabled the detection of individual filter-size lipid droplets, with the lipid droplet candidates being meticulously cut out and labelled based on their corresponding ranks. illustrates the agent, denoted by the circle, traversing from the start position (index 9) to the goal (index 30). This movement occurs by shifting from the upper right corner to the lower left corner, with the vertical axis representing the rank and horizontal axis representing the filter size.
Indices 7, 14, 21, 29, 33, and 38 were designated as penalty areas. The agent’s movement was either leftward or downward (action; a) at the position (state; St) at each time t until reaching the goal. The filter size and rank for each time point were determined using EquationEquations (1)
(1)
However, the filter size referred to a square size with sides measuring 5 × 5 pixels. In this environment, moving downward corresponded to decreasing the rank, resulting in the expansion of object boundaries, while moving leftward corresponded to determining the filter size, indicating the region to be cut out. The filter size range, denoting the upper and lower limits corresponding to each rank, was established by the agent moving from the start position in the environment to the goal. This range was defined by the index range within the same rank. Consequently, the size and label of the region from which lipid droplet candidates were extracted were determined. Notably, lipid droplets larger than the filter size were exclusively considered as lipid droplet candidates in rank 6, resulting in the non-detection of small-sized lipid droplets in rank 6.
In this method, the reward (r) with the greatest overlap with the target extraction region was determined based on the selected route in the environment. shows that if another lipid droplet with a different size or concentration was in proximity to a lipid droplet cut out using the filter size, that area would be extracted to achieve overlap.
Consequently, the reward was determined as the ratio of the newly extracted region that overlapped with the previously extracted region. In addition, the Q value was updated using EquationEquation (3)
where α and γ are the learning and discount rates, respectively. We also used the ε-greedy method to select action a [EquationEquation (4)
where ε denotes the probability of randomly selecting an action a, and N represents the number of learning times. Actions within one episode were executed up to 12 times. If the agent moved outside the confines of or entered the penalty area, the reward assigned was -1, prompting the agent to return to the starting position. This iterative learning process was repeated multiple times, enabling the agent to acquire knowledge. displays the average Q values for each episode.
The final output embraced the optimal behaviour of the agent in each state (index), and the average Q value of the tissue image exhibited convergence to a constant value, stabilizing after 1000 episodes. The experimental parameters included ε < 0.1, α = 0.1 and γ = 0.9, while the number of learning times (N) was set to 500 to accommodate processing time considerations. Here, the value of ε has a stronger influence on useless searches than changes in the values of α and γ; therefore, searches must be suppressed as the number of learning increases. Additionally, in each learning iteration, this method systematically eliminated pixels with edges possessing low luminance values from the foreground binary image. This step was adopted to address potential noise originating from weak edge components observed on the G-image (the original image). The removal of noise based on edge information and the area to be extracted was controlled ().
Discrimination of lipid droplets by classifier
Finally, lipid droplets were identified and detected from the pool of extracted lipid droplet candidates utilizing the k-NN method, SVM and RF, with parameters optimized through a grid search. illustrates the detection outcomes of lipid droplets via the RF method. However, those with a 3:1 or higher ratio of the long side to the short side of the detection area were excluded from the fat droplets.
Figure 2. Weights of an error diffusion filter (*target pixel).
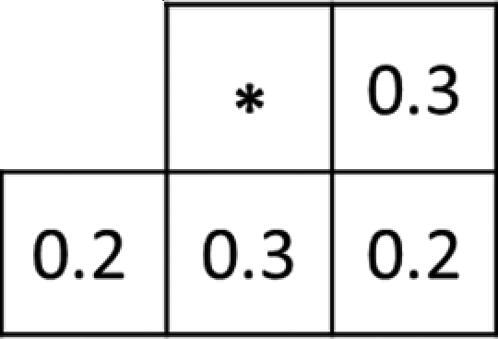
Figure 5. ‘AND’ image (logical product between two images) of each rank: rank 6 (a), rank 5 (b), rank 4 (c) and rank 3 (d) [scale bar: 100 μm]. *A different version of the image in is displayed.
![Figure 5. ‘AND’ image (logical product between two images) of each rank: rank 6 (a), rank 5 (b), rank 4 (c) and rank 3 (d) [scale bar: 100 μm]. *A different version of the image in Figure 3(a) is displayed.](/cms/asset/eef4e88f-2424-4543-8be5-9f27af8068bd/tbeq_a_2338433_f0005_b.jpg)
Figure 6. Environment: numbers indicate indexes, circle indicates an agent, and arrow indicates movement direction.
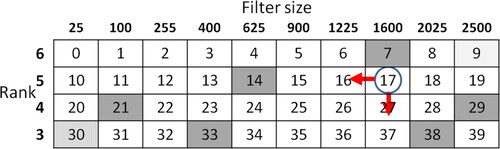
Figure 7. Definition of reward: overlapping region/newly extracted region.
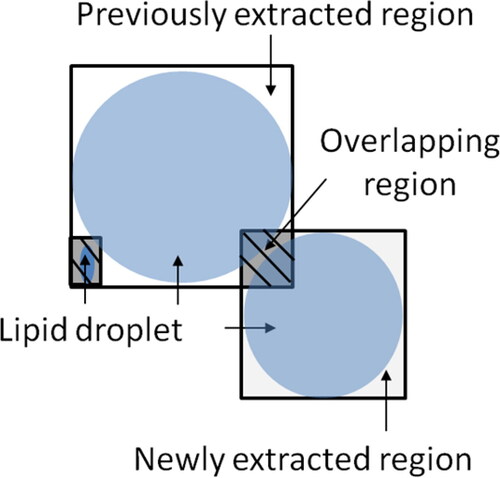
Figure 8. Episodes and average Q values.
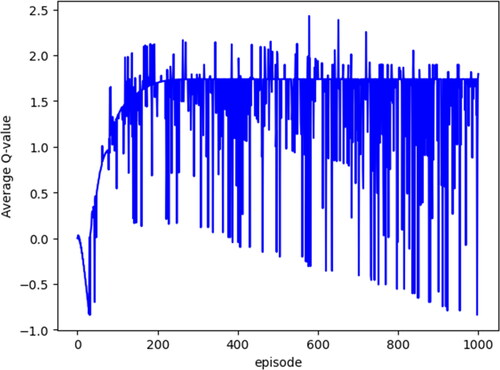
Figure 3. Original image 1/6 (a) and cell nucleus image (b) [scale bar: 100 μm]. *1/6 of the original image in is displayed.
![Figure 3. Original image 1/6 (a) and cell nucleus image (b) [scale bar: 100 μm]. *1/6 of the original image in Figure 3(a) is displayed.](/cms/asset/d5d9a44b-dbdc-4368-b31e-89be04f45fdd/tbeq_a_2338433_f0003_c.jpg)
Figure 4. Foreground binary image of each rank: rank 6 (a), rank 5 (b), rank 4 (c), and rank 3 (d).[scale bar: 100 μm]. *A different version of the image in in is displayed. Four types of foreground binary images were created, each corresponding to a specific rank (6, 5, 4 and 3) as a threshold. The figure illustrates the foreground binary images for each rank in the original image (1/6 area).
![Figure 4. Foreground binary image of each rank: rank 6 (a), rank 5 (b), rank 4 (c), and rank 3 (d).[scale bar: 100 μm]. *A different version of the image in in Figure 3(a) is displayed. Four types of foreground binary images were created, each corresponding to a specific rank (6, 5, 4 and 3) as a threshold. The figure illustrates the foreground binary images for each rank in the original image (1/6 area).](/cms/asset/8ce3c166-2b7d-4283-bddd-e5da2a534190/tbeq_a_2338433_f0004_b.jpg)
Figure 9. Each rank image with noise removed: rank 6 (a), rank 5 (b), rank 4 (c) and rank 3 (d). [scale bar: 100 μm]. *A different version of the image in is displayed.
![Figure 9. Each rank image with noise removed: rank 6 (a), rank 5 (b), rank 4 (c) and rank 3 (d). [scale bar: 100 μm]. *A different version of the image in Figure 3(a) is displayed.](/cms/asset/f1de810e-c745-4569-876d-f599e91e6214/tbeq_a_2338433_f0009_b.jpg)
Figure 10. Lipid droplet detection image: each rank (a)–(d) and overall (e) [scale bar: 100 μm]. *A different version of the image in is displayed.
![Figure 10. Lipid droplet detection image: each rank (a)–(d) and overall (e) [scale bar: 100 μm]. *A different version of the image in Figure 3(a) is displayed.](/cms/asset/85fae1eb-1f45-4232-991f-7819eba374c9/tbeq_a_2338433_f0010_c.jpg)
Results (adaptation to tissue images and their results)
The aforementioned method was applied to 10 human liver tissue images, comprising five normal and five lipid droplet images. For the learning phase, three lipid droplet images and two normal images were employed as training data, while the remaining five images (consisting of three normal images and two lipid droplet images) were reserved for evaluation. During the experiment, two pathologists, each possessing over 10 years of clinical experience, evaluated the images in which lipid droplets were detected.
Experiment 1
We compared k-NN, SVM and RF as classifiers for lipid droplet detection, using f-values based on 10-fold cross-validation ().
Table 1. Classifier comparison.
Each f-value presented in represents the average of the scores for each image. In addition, 160 examples, drawn from a total of 200 datasets comprising an equal distribution of normal images and lipid droplet images (1:1), were utilized for training each classifier. However, a lipid droplet connected to a normal structure adjacent to it, as well as lipid droplets in contact with each other, were detected. Furthermore, structures other than lipid droplets, such as sinusoids and vascular cavities, bore a resemblance to lipid droplets. In the results of Experiment 1, RF demonstrated the highest f-value and the discrimination outcome was also the most favourable.
Experiment 2
The effect of the dimensionality reduction of the features using principal component analysis was compared with that of the RF ().
Table 2. Effect of dimensionality reduction.
The feature values used to distinguish between normal images and lipid droplet images included the area ratio (p) [EquationEquation (5)(5)
(5) ], symmetry (q) [EquationEquation (6)
(6)
(6) ], contrast ratio (c) [EquationEquation (7)
(7)
(7) ] and dispersion ratio (v) [EquationEquation (8)
(8)
(8) ].
(5)
(5)
(6)
(6)
(7)
(7)
(8)
(8)
In EquationEquations (5)–(8), a represents the area of the binarized object, s represents the area of the horizontally reversed version of an overlapping a, and D represents the area of the extraction region. In addition, r and represent the average brightness and variance of the R-image, and g and
represent the average brightness and variance values of the G-image within the detection area, respectively. The features of the normal and lipid droplet images obtained from EquationEquations (5)–(8) are shown as a scatter plot matrix in .
Figure 11. Scatter plot matrix.
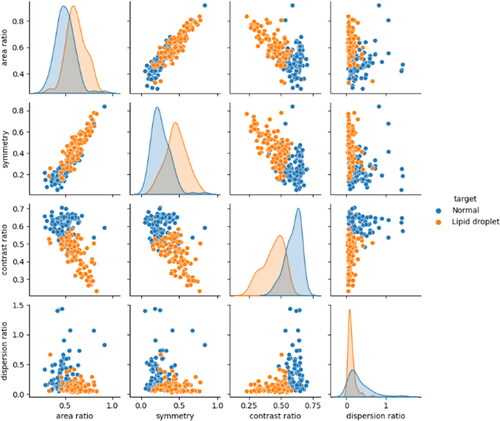
The overlapping distribution of each feature in presents challenges in their separation using only a few features. Consequently, we explored dimension reduction techniques to mitigate the complexity of the feature values. Using principal component analysis, the four features (four dimensions) of 40 test data images (20 lipid droplet images and 20 normal images) were reduced to two dimensions, namely, the first and second principal components, and then evaluated. However, certain lipid droplets that were insufficiently separated from normal images could not be adequately identified through dimension reduction.
Experiment 3
Two pathologists evaluated the correct answer rate for the automatically detected lipid droplets. The results are shown in together with the number of correct answers/detections in parentheses.
Table 3. Correct answer rate for two lipid droplet images [%].
A decrease in the accuracy rate was observed for ranks 4 and 3 of lipid droplet image B. The lipid droplet detection image is shown in .
Figure 12. Original image 1/6 (a) and lipid droplet detection image (b). [scale bar: 100 μm]. *A different version of the image in is displayed. The detection performance was relatively effective for large lipid droplets, but smaller lipid droplets were identified with lower accuracy, resulting in detection gaps. The execution time for this method averaged approximately 16 min and 30 s per image using Google Colaboratory-1.0.0.
![Figure 12. Original image 1/6 (a) and lipid droplet detection image (b). [scale bar: 100 μm]. *A different version of the image in Figure 3(a) is displayed. The detection performance was relatively effective for large lipid droplets, but smaller lipid droplets were identified with lower accuracy, resulting in detection gaps. The execution time for this method averaged approximately 16 min and 30 s per image using Google Colaboratory-1.0.0.](/cms/asset/01e497ca-9228-46d8-a831-c67694d87013/tbeq_a_2338433_f0012_c.jpg)
Discussion
Experimental results
Based on the results of Experiment 1, it is thought that the boundary that separates the features of fat droplet images and normal images spans both types of images. Therefore, we evaluated the performance of the classifier using the f-value, which decreases with an extremely large number of false positives or false negatives [Citation20]. The evaluation of the classifier performance utilizing the f-value revealed that RF exhibited the lowest number of false positives and false negatives compared to those exhibited by k-NN and SVM, thereby achieving the highest f-value. This superiority is attributed to the capability of RF to distinguish lipid droplets from among lipid droplet candidates by establishing a boundary line perpendicular to the feature space axis, facilitating an effective separation between lipid droplets and normal images. The detected lipid droplets were characterized by a high area ratio and symmetry, with low contrast ratio and dispersion ratio values being selected.
Experiment 2 indicated that the effect of dimension reduction by RF combined with principal component analysis was not as significant as that by RF alone. Hence, we opted to perform classification using simple features without dimensionality reduction. However, for enhanced generalization performance and classification accuracy, it was necessary to separate detected lipid droplets from normal images. In the future, introducing features such as circularity and increasing the amount of training data will be necessary [Citation21,Citation22].
Experiment 3 revealed a decrease in accuracy in ranks 4 and 3, as part of the lipid droplets, or a gap that was inaccurately detected owing to the discontinuity of the extracted lipid droplet edge. Despite this limitation, pathologists could practically differentiate other morphological information in the lipid droplet images, highlighting the clinical utility of this method for assessing lipid droplet size, number, and distribution. This explains why the pathologists could easily detect larger lipid droplets (ranks 6 and 5) but had difficulty with smaller (ranks 4 and 3) ones. Lipid droplet size detection is clinically important, and hence this method is useful [Citation17–19].
Region extraction
The adaptive binarization process is a robust technique that can extract subtle images. However, lipid droplet images within tissue images exhibit variations in size, darkness, and other attributes. Therefore, relying solely on adaptive binarization with a fixed filter size may not be sufficient to separate boundaries between lipid droplets and their surroundings. However, if binarization can be performed with an appropriate filter size according to the size of the lipid droplet image, the true boundary can be considered to be near the boundary obtained by the adaptive binarization process [Citation23]. To address this issue, we introduced a novel approach in which the binary point image, obtained by applying the error diffusion method to a tissue image, represented the grey level information of the brightness value of the original image as the density of points. For instance, higher density corresponded to darker ranks, while lower density indicated lighter ranks. This method allowed us to capture contrasting shades of lipid droplet images for each rank within the foreground binary image, revealing the boundary or size of the lipid droplet. By identifying commonalities between the background binary image obtained through adaptive binarization and the foreground binary image for each rank, the boundary could potentially correspond to the size of the lipid droplet. Consequently, this method facilitates the extraction of lipid droplets that may be challenging to separate from their surroundings using adaptive binarization alone, enabling the initial detection of lipid droplets.
Noise removal using edges
In this method, rewards were granted based on the detection of the overlap of regions intended for extraction, with the aim of encompassing lipid droplet candidates within the tissue image. However, assessing only the overlap of cutout regions might include numerous normal images and noise surrounding the lipid droplets. To mitigate this issue, the removal of the lower 10% of edge intensity values was employed as a noise reduction strategy, effectively suppressing small normal image components, such as nuclei and gaps near lipid droplet images, and preventing their inclusion in the cutout area. Noise removal using edge information proved effective in refining the extraction of lipid droplet candidates. Although accurate edge identification and detection depend on image quality parameters, herein, we found that using edge information for noise removal was effective [Citation24].
While the method used the overlap of extracted lipid droplets as a reward, it was hypothesized that lipid droplets in the tissue image were positioned in close proximity, and larger lipid droplets exhibited stronger edges. We intend to verify this hypothesis in future work.
Establishment of penalty areas
Although it is possible to extract a lipid droplet image without incorporating penalty areas, penalties were strategically introduced at six locations within the environment to facilitate layering based on lipid droplet size. This approach aimed to expedite the learning time and prevent learning instability. Initially, the agent frequently entered the penalty area, but over time, it gradually adapted its actions to avoid penalties and successfully reached the goal. As the agent’s actions were limited to moving leftward or downward, environmental indexes 0 to 6, 10 to 13, and 20 and 39 were not traversed and became missing numbers. Indexes 0 to 6 were considered noise in the foreground binary image of rank 6 and were consequently excluded from the detection target area. Furthermore, lipid droplets were detected beyond indexes 20 and 39, but these were also excluded because stratifying them according to rank was impractical. Additionally, precise control over lipid droplet size was achievable by adjusting the penalty areas of indexes 14 and 33 to the left and right.
This method, unlike utilizing extensive data as in deep learning [Citation1,Citation2], demonstrated the capability to detect intracellular lipid droplets even with a small amount of image data and limited learning. Therefore, the use of RL in the proposed method is effective for detecting lipid droplets. This study was designed as a pilot, and future investigations will explore whether this method proves valuable in diagnosing diseases such as hepatitis B/C and fatty liver disease, examining potential differences in lipid droplet patterns and distribution across various diseases [Citation18,Citation19].
Conclusions
Using RL enabled the initial detection of all possible lipid droplets, even in a small dataset. Even with a small amount of learning, this type of machine learning can be potentially applied to areas such as object detection. This study successfully achieved the detection of lipid droplets in tissue images by optimizing the combination of filter size and rank using RL. The proposed method could detect small fat droplets, and by focusing on the shading of fat droplets (boundary edges) and setting a range (limit) on the filter size, we demonstrated the detection of both large and small fat droplets with an acceptable quality through RL. The method is also applicable to small- to medium-sized fat droplets, which are relatively difficult for humans to detect based on their morphology. In this study, we examined a small number of images; hence, accuracy can be improved by increasing the number of images examined. The penalty area in this method also augments the reward of RL, which is a feature of this method and contributes to its accuracy. Although the penalty area was fixed in this study, it is possible to improve accuracy by moving it, and we plan to further study this issue in the future. Compared with other methods such as deep learning, the proposed method could detect fat droplets with a considerably smaller number of images and shorter learning.
Ethics statement
Experimental images were acquired while adhering to ethical research standards (Oita University Faculty of Medicine Ethics Committee approval no. 2568/June 15, 2023).
Author contributions
YH: Conceptualization, Data curation, Formal Analysis, Investigation, Methodology, Software, Validation, Visualization, Writing – original draft. HN: Conceptualization, Data curation, Formal Analysis, Investigation, Methodology, Project administration, Resources, Supervision, Validation, Writing – review & editing. KM: Conceptualization, Data curation, Formal Analysis, Investigation, Methodology, Project administration, Supervision, Validation, Writing – review & editing.
Disclosure statement
No potential conflict of interest was reported by the author(s).
Data availability statement
The data supporting the findings reported herein are available from the corresponding author, HN, upon reasonable request.
Additional information
Funding
References
- Ai-Thelaya KA, Gilal NU, Alzubaidi M, et al. Applications of discriminative and deep learning feature extraction methods for whole slide image analysis: a survey. J Pathol Inform. 2023;14:100335. doi: 10.1016/j.jpi.2023.100335.
- Noorbakhsh J, Farahmand S, Pour AF, et al. Deep learning-based cross-classifications reveal conserved spatial behaviors within tumor histological images. Nat Commun. 2020;11(1):6367. doi: 10.1038/s41467-020-20030-5.
- Cosatto E, Miller M, Graf HP, et al. Grading nuclear pleomorphism on histological micrographs. Proceedings of the 19th International Conference on Pattern Recognition (ICPR); 2008 Dec 8–11; Tampa, FL.
- Kobayashi T, Otsu N. Color image feature extraction using color index local auto-correlations. Proceedings of the IEEE International Conference on Acoustics, Speech and Signal Processing; 2009 Apr 19–24; Taipei, Taiwan.
- Spanhol FA, Oliveira LS, Petitjean C, et al. Breast cancer histopathological image classification using convolutional neural networks. Proceedings of the International Joint Conference on Neural Networks (IJCNN); 2016 Jul 24–29; Vancouver, BC. doi: 10.1109/IJCNN.2016.7727519.
- Hou L, Samaras D, Kurc TM, et al. Patch-based convolutional neural network for whole slide tissue image classification. Proceedings of the IEEE Conference on Computer Vision and Pattern Recognition (CVPR); 2016 Jun 27–30; Las Vegas, NV. doi: 10.1109/CVPR.2016.266.
- Badrinarayanan V, Kendall A, Cipolla R. SegNet: a deep convolutional encoder-decoder architecture for image segmentation. IEEE Trans Pattern Anal Mach Intell. 2017;39(12):2481–2495. doi: 10.1109/TPAMI.2016.2644615.
- de Bel T, Hermsen M, van der Laak J, et al. Automatic segmentation of histopathological slides of renal tissue using deep learning. SPIE Med Imaging. 2018;10581:37. doi: 10.1117/12.2293717.
- Zhang D, Song Y, Liu S, et al. Nuclei instance segmentation with dual contour-enhanced adversarial network. Proceedings of the IEEE 15th International Symposium on Biomedical Imaging (ISBI). 2018 Apr 4 − 7; Washington, DC. doi: 10.1109/ISBI.2018.8363604.
- Goodfellow I, Pouget-Abadie J, Mirza M, et al. Generative adversarial nets. Adv Neural Inf Process Syst. 2014;2672–2680. [Database][Mismatch
- Schlegl T, Seeböck P, Waldstein SM, et al. Unsupervised anomaly detection with generative adversarial networks to guide marker discovery. In: Marc Niethammer, Martin Styner, Stephen Aylward, Hongtu Zhu, Ipek Oguz, Pew-Thian Yap, Dinggang Shen, June 25-30, 2017, Appalachian State University, Boon, NC, USA, Springer, Midtown Manhattan, New York City. Proceedings of the International Conference on Information Processing in Medical Imaging (IPMI); 2017. p. 146–157. doi: 10.1007/978-3-319-59050-9_12.
- Perera P, Patel VM. Learning deep features for one-class classification. IEEE Trans Image Process. 2019;28(11):5450–5463. doi: 10.1109/TIP.2019.2917862.
- Barata C, Rotemberg V, Codella NCF, et al. A reinforcement learning model for AI-based decision support in skin cancer. Nat Med. 2023;29(8):1941–1946. doi: 10.1038/s41591-023-02475-5.
- Zheng T, Chen W, Li S, et al. Learning how to detect: a deep reinforcement learning method for whole-slide melanoma histopathology images. Comput Med Imaging Graph. 2023;108:102275. doi: 10.1016/j.compmedimag.2023.102275.
- Mushtaq AH, Shafqat A, Salah HT, et al. Machine learning applications and challenges in graft-versus-host disease: a scoping review. Curr Opin Oncol. 2023;35(6):594–600. doi: 10.1097/CCO.0000000000000996.
- Antunes P, Cruz A, Barbosa J, et al. Lipid droplets in cancer: from composition and role to imaging and therapeutics. Molecules. 2022;27(3):991. doi: 10.3390/molecules27030991.
- Cruz ALS, Barreto EA, Fazolini NPB, et al. Lipid droplets: platforms with multiple functions in cancer hallmarks. Cell Death Dis. 2020;11(2):105. doi: 10.1038/s41419-020-2297-3.
- Leow WQ, Chan AW, Mendoza PGL, et al. Non-alcoholic fatty liver disease: the pathologist’s perspective. Clin Mol Hepatol. 2023;29(Suppl):S302–S318. doi: 10.3350/cmh.2022.0329.
- Mejhert N, Gabriel KR, Frendo-Cumbo S, et al. The lipid droplet knowledge portal: a resource for systematic analyses of lipid droplet biology. Dev Cell. 2022;57(3):387.e4–397.e4. doi: 10.1016/j.devcel.2022.01.003.
- Lee N, Yang H, Yoo H. A surrogate loss function for optimization of Fβ score in binary classification with imbalanced data [Internet]. arXiv; 2021 [cited 2024 Mar 23]. Available from: http://arxiv.org/abs/2104.01459
- Huang PW, Lee CH. Automatic classification for pathological prostate images based on fractal analysis. IEEE Trans Med Imaging. 2009;28(7):1037–1050. doi: 10.1109/TMI.2009.2012704.
- Ishikawa M, Murakami Y, Ahi ST, et al. Automatic quantification of morphological features for hepatic trabeculae analysis in stained liver specimens. J Med Imaging. 2016;3(2):027502. doi: 10.1117/1.JMI.3.2.027502.
- Calderon F, Garnica-Carrillo A, Reyes-Zuñiga C. Binarization of images with variable lighting using adaptive windows. SIViP. 2022;16(7):1905–1912. doi: 10.1007/s11760-022-02150-1.
- Ranjan R, Avasthi V. Edge detection using guided Sobel image filtering. Wireless Pers Commun. 2023;132(1):651–677. doi: 10.1007/s11277-023-10628-5.