
Abstract
Background
In ATTR amyloidosis, transthyretin (TTR) protein is secreted from the liver and deposited as toxic aggregates at downstream target tissues. Despite recent advancements in treatments for ATTR amyloidosis, the mechanisms underlying misfolded TTR-mediated cellular damage remain elusive.
Methods
In an effort to define early events of TTR-associated stress, we exposed neuronal (SH-SY5Y) and cardiac (AC16) cells to wild-type and destabilized TTR variants (TTRV122I (p.V142I) and TTRL55P (p.L70P)) and performed transcriptional (RNAseq) and epigenetic (ATACseq) profiling. We subsequently compared TTR-responsive signatures to cells exposed to destabilized antibody light chain protein associated with AL amyloidosis as well as ER stressors (thapsigargin, heat shock).
Results
In doing so, we observed overlapping, yet distinct cell type- and amyloidogenic protein-specific signatures, suggesting unique responses to each amyloidogenic variant. Moreover, we identified chromatin level changes in AC16 cells exposed to mutant TTR that resolved upon pre-incubation with kinetic stabilizer tafamidis.
Conclusions
Collectively, these data provide insight into the mechanisms underlying destabilized protein-mediated cellular damage and provide a robust resource representing cellular responses to aggregation-prone proteins and ER stress.
Introduction
The systemic amyloid diseases are a class of disorders in which effector organs produce proteins that misfold and aggregate, travel throughout circulation, and deposit extracellularly at distal target sites [Citation1–3]. Two of the most prevalent examples of systemic amyloid diseases include transthyretin amyloidosis (ATTR amyloidosis) and light chain amyloidosis (AL amyloidosis). In ATTR amyloidosis, the liver produces amyloidogenic transthyretin (TTR), while in AL amyloidosis, malignant plasma cells of the bone marrow secrete destabilized antibody light chains (LC) with high propensity to misfold [Citation4–6]. In both diseases, misfolding TTRs and LCs travel throughout circulation and deposit extracellularly at downstream target organs (including the heart and peripheral nerves for ATTR amyloidosis, and renal tissue for AL amyloidosis), ultimately resulting in organ dysfunction [Citation4–6].
Despite the recent development of therapeutics for diseases like ATTR amyloidosis [Citation1–6], it remains unclear how deposition of extracellular, aggregated TTRs and LCs damage target cell types. At the same time, there is large diversity in the pathology of both ATTR and AL amyloidosis, with some patients exhibiting amyloid deposition and damage at peripheral nerves, while others develop significant cardiac disease [Citation4–6]. In the case of ATTR amyloidosis, for example, the TTRV122I (g.V142I) mutation predominantly leads to cardiac amyloid deposition and dysfunction, while extremely destabilized variants such as TTRL55P (g.L70P) present with much different pathologies perhaps related to differences in rates of misfolding [Citation7,Citation8]. Understanding the earliest responses to extracellular exposure of destabilized TTRs and LCs could provide insight into mechanisms of protein-mediated cell death as well as the identification of putative biomarkers for these difficult-to-diagnose diseases.
Cells respond to a variety of stimuli including xenobiotic, oxidative and ER stress through complex intracellular signaling pathways [Citation9–12]. Activation of these pathways can result in reprogramming of transcriptional networks in an effort to maintain function during acute stress, disease and aging [Citation1,Citation9,Citation10]. As many stress response pathways share downstream convergent mechanisms (e.g. signaling effector molecules, transcription factors, gene signatures, etc.), identifying commonalities and differences in response to diverse insults may uncover novel therapeutic avenues for ameliorating the toxicity of diseases with similar underlying etiologies.
Here, we employ bulk RNAseq and ATACseq to profile transcriptional and chromatin level changes resulting from exposure to cardiomyopathy-associated and highly destabilized TTRs (TTRV122I (p.V142I) and TTRL55P (p.L70P), respectively), destabilized LC, thapsigargin and HS in immortalized neuronal SH-SY5Y and cardiac AC16 cell lines. In doing so, we compare the transcriptional and chromatin level responses of each cell type to each stressor. Through these efforts, we generated comprehensive datasets cataloging SH-SY5Y and AC16 cell responses to destabilized TTR and LC proteins and robust ER stressors. Lastly, we provide evidence that cells respond to each stressor via cell type- and stress-specific signatures, including different amyloidogenic proteins as well as pathologic variants of the same proteins.
Materials and methods
Quantifying protein concentration via Bradford assay
Concentration of recombinant human TTRs was determined via Bradford assay. Samples were thawed on ice and diluted 1:1000 in 1× Bradford reagent (BioRad, Hercules, CA, Cat. No. 500-0006). Standard curve was determined via serial dilutions of 1 mg/mL BSA diluted in H2O. All samples, including standards, were incubated at room temperature for ∼10 min. Absorbance was determined at 595 nm. All samples were run in technical duplicate.
Stress conditions for cells: heat shock, thapsigargin and recombinant TTR and LC exposure
For heat shock condition, cells were plated at 4 × 10⁵ cells/mL. Twenty-four hours later, cells were incubated at 42 °C for 75 min, and harvested using 0.05% trypsin. For thapsigargin exposure, cells were plated at 2 × 10⁵ cells/mL. Twenty-four hours later, cells were exposed to 500 nM thapsigargin (Millipore Sigma, Billerica, MA, Cat. No. T9033) for 20 h and harvested as previously stated. For rhTTR exposure for transcriptomic profiling, cells were plated at 2 × 10⁵ cells/mL. Twenty-four hours later, respective recombinant protein (0.2 mg/mL TTR, 0.02 mg/mL LC) in the absence and presence of 10 µM tafamidis were added. After incubating cells at 37 °C for 48 h, cells were harvested for RNA or gDNA extraction.
Culturing SH-SY5Y and AC16 cells
SH-SY5Y cells (ATCC, Manassas, VA, Cat. No. CRL-2266) were maintained in 1:1 EMEM and DMEM F/12 with 10% FBS. AC16 cells (Millipore Sigma, Burlington, MA, Cat. No. SCC109) were cultured in DMEM/F12 with 12.5% FBS. All cells were maintained at 37 °C and 5% CO2 and grown in media supplemented with 1× primocin (Reprocell, Boston, MA, Cat. No. 04-0012-02).
RNA-seq profiling and differential gene expression analysis
Total RNA was extracted using a RNeasy mini extraction kit (Qiagen, Hilden, Germany, Cat. No. 74104) and submitted for RNAseq via Novogene Co. (Sacramento, CA). The quality of the raw data was assessed using FastQC v.0.11.7. The sequence reads were aligned to the human genome reference (GRCh38) using STAR v.2.6.0c21. Counts per gene were summarized using the featureCounts function from the subread package v.1.6.222. After the summarization of counts per gene using featureCounts, the samples proceeded to downstream analysis. The edgeR package v.3.25.10 was used to import, organize and filter the counts [Citation11]. The matrix of counts per gene per sample was initially analyzed via DESeq2 and later analyzed using the limma/voom normalization method. Genes were filtered based on the standard edgeR filtration method using the default parameters for the ‘filterByExpr’ function. After exploratory data analysis (Glimma v. 1.11.1), contrasts for differential expression testing were done to compare naive and experimental samples. The limma package v.3.42.224 with its voom method, namely, linear modeling and empirical Bayes moderation was used to test differential expression (moderate t-test). p Values were adjusted for multiple testing using Benjamini-Hochberg correction (false discovery rate (FDR)-adjusted p value). Differentially expressed genes for each comparison were visualized using Glimma v. 1.11.125, and FDR < 0.05 was set as the threshold for determining significant differential gene expression. Functional predictions were performed using the fgsea v.1.12.0 package for gene set analysis [Citation12].
ATACseq sequencing, quality control and data analysis
For ATACseq, gDNA was isolated from cells via DNeasy Blood and Tissue Kit (Qiagen, Hilden, Germany, Cat. No. 69504) and processed as described in Buenrostro et al. [Citation13]. To analyze our ATACSeq data, we used the esATAC pipeline [Citation14]. The pipeline consists of three major functions: (1) processing the raw data, (2) statistical analysis and (3) quality control (QC). The raw fastq files are submitted to esATAC and then undergo AdapterRemoval [Citation15] for adapter trimming and alignment to the human genome (GRCh38) using Bowtie2 [Citation16]. The mapped reads are sorted, duplicates are removed, and the reads are shifted for the Tn5 insertion [Citation13]. esATAC identifies open chromatin peaks using F-seq [Citation17] which are then annotated, and gene ontology terms are summarized. QC reports are generated with raw sequencing read quality, fragment length QC analysis, and a number of QC plots to assess the quality of the reads and peak calling. Counts per peak were summarized using the featureCounts function from the subread package v.1.6.222. Read counts in the peak regions were then analyzed using the same procedure as for the Bulk RNAseq data. Only peaks in promoter regions were used for differential accessibility analyses.
Gene set enrichment analysis
Functional gene set enrichment analysis (fgsea) was performed to explore the annotated genes or differential genes enriched hallmark pathways. For analysis of the transcriptomic heat shock conditions, fgsea was performed using hallmark pathways of the Molecular Signatures Database (MsigDB) and heat shock pathways in the Reactome Pathway Database (regulation of heat shock factor and HSF1-mediated heat shock response) and Gene Ontology Consortium (heat shock protein binding). For analysis of the transcriptomic thapsigargin conditions, fgsea was performed using a collection of pathways from the Gene Ontology Consortium, Reactome Pathway Database, and published gene sets [Citation16,Citation18]. For analysis of the epigenetic heat shock and thapsigargin conditions, fgsea was performed using transcription factor targets of the MsigDB. For all other conditions, the annotated genes or differential genes were analyzed based on the MsigDB to obtain all the involved hallmark pathway terms. The significance level of each pathway term was calculated by the Fisher test. Adjusted p values < 0.05 were considered significant.
Results
Exposure to global ER stress via HS or thapsigargin results in stress- and cell type-specific transcriptional changes
As our group and others have identified ER stress to be a critical factor in the pathogenesis of ATTR and AL amyloidosis, we first sought to profile transcriptional signatures of cells exposed to HS and the SERCA kinase inhibitor thapsigargin. To accomplish this, immortalized neuronal SH-SY5Y and cardiac AC16 cells were subjected to 42 °C for 110 min (HS) or thapsigargin (500 nM) for 16 h (). Exposure to HS resulted in marked gene expression changes in both SH-SY5Y and AC16 cells. SH-SY5Y cells exhibited differential expression of 7951 genes (3823 upregulated, 4128 downregulated), while AC16 cells exhibited 2818 differentially expressed genes (1350 upregulated, 1468 downregulated) (). Top DEGs expressed by both SH-SY5Y and AC16 cells in response to HS included HSPA6, HSPA7 and HSPA1B as well as the proto-oncogene FOS ().
Figure 1. Cell type-specific differential gene expression of SH-SY5Y and AC16 cells in response to HS- and thapsigargin-induced ER stress. (A) Immortalized neuronal SH-SY5Y and cardiac AC16 cells were exposed to HS (42 °C, 110 min) or thapsigargin (Tg) (500 nM, 16 h). RNA was subsequently isolated from each sample and RNAseq was performed. Two technical replicates were used for each condition. (B) Number of differentially expressed genes (DEGs) relative to naïve (i.e. untreated cells) in each condition for SH-SY5Y and AC16 cells exposed to HS (left) or thapsigargin (right). Blue bars denote number of genes downregulated; red bars represent number of genes upregulated. FDR < 0.05. (C) Differentially expressed genes in SH-SY5Y (left) and AC16 (right) cells exposed to HS. Each dot represents a single gene, red dots depict significantly upregulated genes and blue dots depict significantly downregulated genes. Grey dots depict genes that are not significantly changing. FDR < 0.05. (D) Top upregulated genes in SH-SY5Y and AC16 cells upon exposure to heat shock. Yellow dots represent genes that are upregulated; blue dots represent genes that are downregulated. Size of dot denotes size of logFC. Color gradient represents adjusted p value; yellow dots denote adjusted p value < 0.05. Gene ontology, reactome and hallmark pathways represented in genes differentially expressed in SH-SY5Y (E) and AC16 (F) cells post-HS. (G) Differentially expressed genes in SH-SY5Y (left) and AC16 (right) cells exposed to thapsigargin. Red dots represent upregulated genes, blue dots represent downregulated genes and grey dots represent unchanging genes. FDR < 0.05. (H) Top differentially expressed genes in SH-SY5Y and AC16 cells exposed to thapsigargin. Yellow represents upregulated genes; blue represents downregulated genes. Size of dot indicates magnitude of logFC. Color gradient represents adjusted p value; yellow dots denote adjusted p value < 0.05. Published and curated gene sets represented in differentially expressed genes in SH-SY5Y (I) and AC16 (J) cells exposed to thapsigargin. Blue bars depict pathways represented in downregulated genes; red bars depict those represented in upregulated genes.
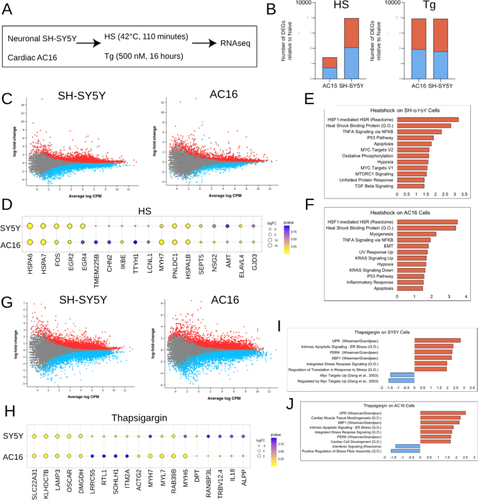
Unsurprisingly, pathway analysis revealed that SH-SY5Y and AC16 cells exposed to HS relate to known cellular responses to heat stress (e.g. the HSF1-mediated HSR reactome pathway, heat shock binding protein GO pathway) and related TNFα signaling (via NFKB hallmark pathway) (). Interestingly, mTORC1 signaling pathway target genes were enriched in SH-SY5Y cells only, while KRAS signaling pathway genes were enriched in AC16 cells, suggesting potentially divergent downstream responses to HS for neuronal versus cardiac cells.
Exposure to toxic concentrations of thapsigargin resulted in differential expression of a similar number of genes in both SH-SY5Y (7880) and AC16 (7904) cells (). SH-SY5Y and AC16 cells dosed with thapsigargin exhibited upregulation of several stress response pathways including: lysosomal pathway components (LAMP3), leukocyte receptor components (OSCAR) and mitochondrial matrix components (DMGDH) (). As expected, UPR signaling pathway target genes (e.g. PERK and XBP1) were significantly enriched in upregulated genes for both SH-SY5Y and AC16 cells exposed to thapsigargin (). Following 16 h exposure to 500 nM thapsigargin, cells exhibited noticeable toxicity. In line with this noted toxicity, DEGs of both cell types were enriched for apoptotic signaling related to ER stress (). Interestingly, SH-SY5Y cells downregulated gene sets associated with myc target genes while AC16 cells downregulated interferon signaling reactome and stress fiber assembly pathway target genes, again potentially suggesting divergent, cell type-specific response to stress ().
Transcriptional signatures of SH-SY5Y and AC16 cells exposed to HS and thapsigargin were compared to existing, publicly available transcriptional datasets [Citation10,Citation19–22] in examined cell types. HS-exposed SH-SY5Y and AC16 cells exhibited upregulation of BAG3, HSPA1B, HSPB1, HSPH1 and IER5 consistent with previous studies of HS-exposed HEK293T cells, colon cancer (SW620) cells and HeLa cells (Figure S1A). Interestingly, thapsigargin-treated SH-SY5Y and AC16 cells from our study exhibited expression patterns UPR-associated genes distinct from previously published data (Figure S1B) [Citation10,Citation19,Citation20,Citation23]. Despite this, however, our cross-comparison analysis revealed that thapsigargin-treated AC16 and SH-SY5Y cells in our experiments grouped together with previously published data from thapsigargin-exposed 293T cells, suggesting differences are not due to methodology, but rather cell type.
Cellular response to destabilized, disease-associated TTR and LC reveals cell type- and protein-specific transcriptional signatures
In an effort to profile the earliest instances of stress in response to disease-associated proteins such as TTR and LC, cells were exposed to bacterially derived, recombinant human wild-type (TTRWT), highly destabilized (TTRL55P (p.L70P)), and cardiomyopathy-associated (TTRV122I (p.V142I)) TTR, as well as germline and destabilized AL LCs [Citation24] (germline LC and ALLC, respectively) at physiological concentrations for 48 h (). Following dosing, RNA was isolated from each sample for bulk transcriptomic profiling via RNAseq. To control for differences due to the presence of misfolded TTRs, in parallel, recombinant TTRs were also pre-incubated with kinetic stabilizer tafamidis at an appropriate stoichiometric ratio. Although cells exposed to physiologically relevant levels of wild-type and destabilized TTRs were morphologically unchanged, they exhibited many DEGs (). Interestingly, neuronal SH-SY5Y cells exhibited a greater number of DEGs (relative to naïve cells) upon exposure to TTRL55P than cardiomyopathy-associated TTRV122I (p.V142I) (3040 vs. 472, respectively) (, left). Conversely, cardiac AC16 cells exhibited a slightly greater number of DEGs in response to cardiomyopathy-associated TTRV122I (p.V142I) and TTRL55P (p.L70P) (275 vs. 140, respectively) (, right panel). Exposure to physiological concentrations of both pathologic and germline LCs resulted in marked increases in the number of DEGs when compared to recombinant TTR exposure. Lastly, both cell types exposed to wild-type TTR and LC exhibited a greater number DEGs compared to naïve (although less than their destabilized counterparts). As TTR and LC both have normal physiological processes (e.g. retinol transport and components of antibody structure, respectively), these DEGs could reflect how cells respond to said proteins under normal, homeostatic conditions. The top 10 up- and downregulated protein-coding genes in response to each stressor in SH-SY5Y and AC16 cells are shown in and , respectively. For a comprehensive list of transcriptional changes, please see Data Files 1 and 2 for SH-SY5Y and AC16 cells, respectively.
Figure 2. AC16 and SH-SY5Y cells exposed to amyloidogenic proteins exhibit robust cell type- and protein-specific gene expression changes. (A) SH-SY5Y and AC16 cells were exposed to bacterial-derived recombinant human TTR (wild-type, highly destabilized TTRL55P, cardiomyopathy-associated TTRV122I) and LC (germline LC and destabilized ALLC) variants at physiologically relevant concentrations for 48 h. To control for gene expression changes related to misfolded forms of TTRs, in parallel, TTRs were pre-incubated with kinetic stabilized tafamidis at appropriate stoichiometric ratios. RNA was isolated from each condition for RNAseq. Two technical replicates were used for each condition. (B) Number of differentially expressed genes (DEGs) relative to naïve (i.e. untreated cells) in each condition for SH-SY5Y (left) and AC16 (right) cells. Blue bars denote number of genes downregulated; red bars represent number of genes upregulated. FDR < 0.05. Top 15 significantly up- and downregulated genes seen in SH-SY5Y (C) and AC16 (D) cells exposed to TTRs, LCs, HS and thapsigargin. Each individual heatmap depicts the top 30 differentially expressed genes for cardiomyopathy-associated TTRV122I (left), highly destabilized TTRL55P (middle) or destabilized LC. Fold-changes are determined relative to naïve (i.e. untreated cells). Stimuli are depicted on the x-axis, differentially expressed genes on the y-axis. Samples are arranged via hierarchical clustering. FDR < 0.05.
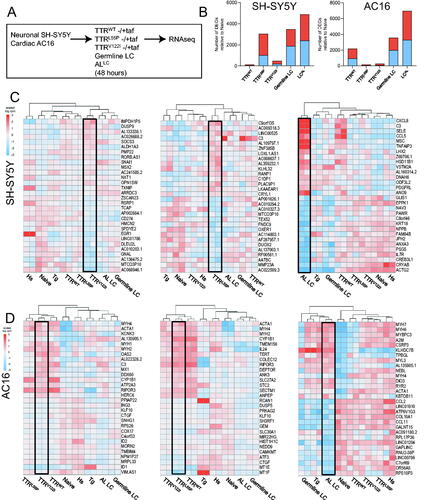
Table 1. Top 10 up- and top 10 downregulated genes in neuronal SH-SY5Y cells exposed to HS, thapsigargin or destabilized proteins.
Table 2. Top 10 up- and top 10 downregulated genes in cardiac AC16 cells exposed to HS, thapsigargin or destabilized proteins.
Comparisons of the top 30 DEGs (top 15 upregulated and top 15 downregulated) upon dosing SH-SY5Y cells with TTRL55P (p.L70P), cardiomyopathy-associated TTRV122I (p.V142I), and mutant LC highlighted transcriptional signatures distinct to each respective stressor (, ). Interestingly, the transcriptional signature elicited by TTRL55P (p.L70P) may be more robust than that elicited by cardiomyopathy-associated TTRV122I (p.V142I). Moreover, AC16 cells exposed to TTRV122I (p.V142I) potentially exhibit a unique transcriptional signature that is more robust than AC16 cells exposed to TTRL55P (p.L70P) albeit to a slightly lesser degree (, ). As reflected in the number of DEGs in response to ALLC, destabilized LC exposure resulted in strong transcriptional signatures in both SH-SY5Y and AC16 cells ().
Gene set enrichment analysis revealed upregulation of diverse hallmark pathways in both mutant TTR and LC conditions (Figure S2). Neuronal cells exposed to both TTRV122I (p.V142I) and TTRL55P (p.L70P) exhibited upregulation of genes associated with DNA repair, E2F targets, mTORC1 signaling, Myc targets and oxidative phosphorylation (Figure S2), potentially highlighting a generalized SH-SY5Y stress response program. Upregulation of fatty acid metabolism and protein secretion associated genes were specific to TTRV122I (p.V142I) exposure, while upregulation of the complement system was specific to TTRL55P (p.L70P) exposure in SH-SY5Y cells. Gene set enrichment analysis further revealed enrichment of diverse hallmark pathways in cardiac cells dosed with amyloidogenic protein (Figure S2). Upon both TTRV122I (p.V142I) and TTRL55P (p.L70P) exposure, DEGs in cardiac cells were associated with upregulation for myogenesis and coagulation and downregulation for Myc targets. AC16 cells exposed to TTRL55P (p.L70P) showed upregulation for epithelial–mesenchymal transition, interferon gamma and alpha response, KRAS activation, apoptosis, apical junction complex, mitotic spindle assembly and inflammatory response. ALLC exposure in SH-SY5Y cells showed upregulation of genes associated with many pathways including: Myc targets, oxidative phosphorylation, DNA repair, reactive oxygen species pathway, inflammatory response, interferon gamma response and mTORC1 signaling.
SH-SY5Y and AC16 cells exposed to HS, thapsigargin and destabilized proteins exhibit differential expression of a subset of overlapping genes
In addition to comparing how neuronal and cardiac cells respond to pathologically diverse TTRs and LCs, we next sought to compare the signature of these stressors with that following exposure to HS- and thapsigargin-induced stress. To accomplish this, we compared DEGs of SH-SY5Y and AC16 cells exposed to HS and thapsigargin to those exposed to destabilized TTR and LC.
SH-SY5Y cells subjected to mutant TTRs, HS and thapsigargin had 135 DEGs in common (), while those exposed to destabilized LC, HS and thapsigargin differentially expressed 720 shared genes (). SH-SY5Y cells exposed to destabilized TTRs and LCs shared differential expression of 85 genes (). Perhaps due in part to lower numbers of DEGs upon stimulus exposure, in contrast, AC16 cells dosed with TTRs or HS shared differential expression of 22 genes (). Similarly, AC16 cells exposed to HS, thapsigargin or ALLC differentially expressed 339 common genes (). Lastly, AC16 cells exposed to amyloidogenic TTRs or ALLC differentially expressed only 10 common genes (), suggesting activation of unique transcriptional stress response pathways.
Figure 3. Cells exposed to destabilized TTR and LC exhibit gene expression changes distinct and shared with those subjected to HS- and thapsigargin-induced ER stress. (A–C) Differentially expressed genes shared between SH-SY5Y cells exposed to HS, thapsigargin, cardiomyopathy-associated TTRV122I, highly destabilized TTRL55P, as well as wild-type and destabilized LC (ALLC). for each comparison, the top 10 DEGs up- and downregulated in common to all comparisons are listed below. (D–F) DEGs shared across AC16 cells exposed to HS, thapsigargin, TTRV122I, TTRL55P, and germline and AL LCs. Top 10 DEGs in common to all conditions are listed below. Differentially expressed genes broken down by TTR variant in exposed AC16 (G) and SH-SY5Y (H) cells. Top 5 upregulated genes specific to TTRV122I (G) and TTRL55P (H) are noted.
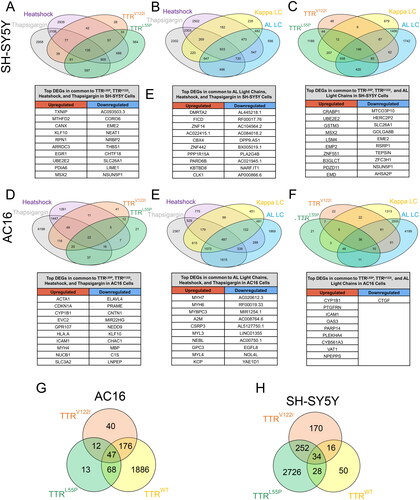
As reflected in , in both SH-SY5Y and AC16 cells, highly destabilized and cardiomyopathy-associated TTRs drove differential expression of genes unique to each variant. In AC16 cells, for example, TTRV122I (p.V142I) elicited differential expression of 40 unique genes (), while in SH-SY5Y cells, TTRL55P (p.L70P) exposure resulted in differential expression of 2726 unique genes ().
Neuronal and cardiac cells exhibit changes in chromatin accessibility profiles in response to HS and thapsigargin exposure
We next wanted to expand upon our transcriptomic profiles of diverse cellular stress by assessing the effect of each stimuli at the chromatin level. To this end, we employed ATACseq to investigate changes in chromatin organization following exposure to HS and thapsigargin (outlined in ). In doing so, we found that HS and thapsigargin resulted in robust changes in differentially accessible peaks (DAPs) located within promoter regions of genes in both SH-SY5Y and AC16 cells ().
Figure 4. SH-SY5Y and AC16 cells exposed to HS and thapsigargin exhibit changes in chromatin accessibility signatures in cell type- and stress-specific manners. (A) SH-SY5Y and AC16 cells were exposed to HS (42 °C, 110 min) or thapsigargin (500 nM, 16 h). (B) Percentage of total DAPs in AC16 cells exposed to HS or thapsigargin located within promoter regions, intergenic regions, intronic regions or other non-coding regions of the genome. (C) Number of differentially accessible peaks (DAPs) in SH-SY5Y and AC16 cells exposed to HS and thapsigargin (Tg), left and right, respectively. DAPs are relative to naïve (i.e. untreated cells). DAPs included in calculation represent those associated with the promoter regions of known protein coding genes as defined by distance to the transcriptional start site. FDR < 0.05. Red represents DAPs which increase in abundance post-stress, while blue represents DAPs which decrease post-stress. (D) Significant DAPs in SH-SY5Y (left) and AC16 (right) cells exposed to heat shock. Red dots depict DAPs that increase in abundance; blue denotes DAPs that decrease in abundance. Fold-change relative to naïve condition. FDR < 0.05. (E) Top DAPs associated with promoter regions whose accessibility changes in SH-SY5Y and AC16 cells exposed to HS. Size of dot represents strength of fold-change. Color gradient represents adjusted p value. (F) Transcription factor binding sites associated with DAPs in promoter regions post-HS in SH-SY5Y (top) and AC16 (bottom) cells. Red bars depict transcription factor targets enriched in DAPs becoming more accessible post-HS while blue bars represent pathways enriched in DAPs becoming less accessible post-HS. (G) Total number of promoter region-associated DAPs differentially accessible in SH-SY5Y (left) and AC16 (right) cells post-thapsigargin exposure. Red and blue dots depict increasing and decreasing DAPs relative to naïve cells, respectively. FDR < 0.05. (H) Top changing promoter-associated DAPs in SH-SY5Y and AC16 cells exposed to thapsigargin. (I) Transcription factor binding sites associated with DAPs in promoter regions post-thapsigargin exposure in SH-SY5Y (top) and AC16 (bottom) cells.
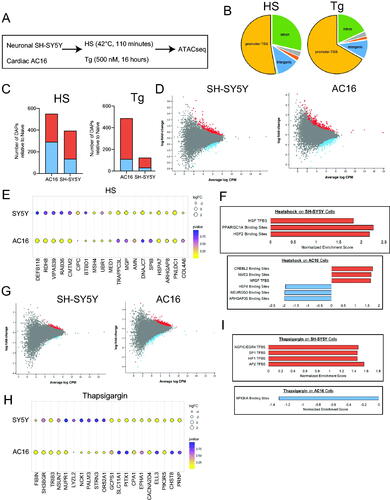
A majority of newly formed DAPs resulting in response to both HS and thapsigargin as compared to naïve cells resided in promoter regions (as defined by distance to the transcriptional start site), suggesting changes in chromatin accessibility could result in changes in expression of protein-coding genes (, Figure S3). Based on these data, unless otherwise stated, all ATACseq data listed below focuses on DAPs found in promoter regions of protein-coding and noncoding genes. The top 10 up- and downregulated DAPs found within promoter regions of SH-SY5Y and AC16 cells in response to each stressor are found in . For a comprehensive list of DAPs occurring in stressed SH-SY5Y and AC16 cells see Data Files 3 and 4, respectively.
Table 3. Top 10 up- and top 10 downregulated DAPs in AC16 and SH-SY5Y cells exposed to HS and thapsigargin.
In both SH-SY5Y and AC16 cells, HS resulted in many changes in chromatin accessibility in the form of DAPs (393 for SH-SY5Y cells and 549 for AC16 cells) (). Some of the DAPs with greatest effects post-HS in both SH-SY5Y and AC16 cells include those associated with genes involved in HS (HSPA7), mRNA processing (PNLDC1) and rhoGTPase activity (ARHGAP8), potentially suggesting functional outcomes resulting from HS-induced chromatin accessibility changes (). In SH-SY5Y cells, HS exposure resulted in DAPs forming in HSF transcription factor binding sites as well as PPARGC1A (master regulator of mitochondrial biogenesis) (). In AC16 cells, HS exposure resulted in increased accessibility of CREB-like binding sequences (CREBL2) and decreased accessibility of HSF4 binding sequences ().
Despite observed toxicity, thapsigargin resulted in fewer DAPs in both SH-SY5Y and AC16 cells as compared to HS (122 for SH-SY5Y and 486 for AC16 cells) (). For both SH-SY5Y and AC16 cells, top DAPs increasing in accessibility upon thapsigargin exposure included those lying in the promoter regions of genes associated with PI3K signaling (PIK3R5) and pro-apoptotic pathways (TRIB3) (). SH-SY5Y cells exposed to thapsigargin exhibited increased accessibility in DAPs associated with proliferation-promoting transcription factor binding sites (EGR4), regulation of apoptosis and post-transcriptional modifications (SP1), and response to hypoxia (HIF1) (). Alternatively, AC16 cells exhibited decreased accessibility in immune-regulating NFKBIA binding sites ().
Destabilized TTR exposure results in variant- and cell type-specific chromatin accessibility signatures that are potentially resolved by pre-incubation with kinetic stabilizer
As our above data suggest that neuronal and cardiac cells experience chromatin level changes in response to HS- and thapsigargin-mediated stress, we next wanted to extend this experiment and analysis to investigate chromatin level changes in response to destabilized, disease-causing TTRs. To accomplish this, SH-SY5Y and AC16 cells were again exposed to physiologically relevant concentrations of recombinant human TTRWT, highly destabilized TTRL55P (p.L70P) or cardiomyopathy-associated TTRV122I (p.V142I). After exposure to TTRs for 48 h, gDNA was isolated from each condition and ATACseq was performed. In parallel, in an effort to control for changes resulting from exposure to misfolded forms of each protein, each TTR was pre-incubated with the kinetic stabilizer tafamidis at an appropriate stoichiometric ratio ().
Table 4. Top 10 up- and top 10 downregulated DAPs in AC16 cells exposed to TTRWT and mutant TTRs.
By PCA, as expected, the greatest differences in chromatin accessibility were dictated by cell type (Figure S3A, left). Additionally, as with our transcriptomic data, for both SH-SY5Y and AC16 cells, HS and thapsigargin exhibited the greatest changes when compared to naïve cells, forming distinct groups by PCA (Figure S3A, middle, right). As with HS- and thapsigargin-exposed cell, most DAPs observed in AC16 cells dosed with TTRs lie in regions associated with promoters and the transcriptional start site, followed by intronic and intergenic regions (Figure S3B).
Although we sought to compare chromatin level changes in response to disease-causing, misfolding-prone TTRs to HS and thapsigargin, in doing so, we found that DAP signatures appear to be less similar across stressors than transcriptional signatures, as evidenced by only eight DAPs being common across HS, thapsigargin, TTRV122I (p.V142I) and TTRL55P (p.L70P) (Figure S3C). Despite this discordance, we then wanted to determine differences in DAPs resulting from exposure to different TTR species. As AC16 cells exhibited a greater response to TTRs at the DAP level as compared to SH-SY5Y, in these analyses we focused on TTR-exposed AC16 cells. To this end, AC16 cells share 93 DAPs in common when exposed to TTRV122I (p.V142I) or TTRL55P (p.L70P), demonstrating a partially shared chromatin-level response to destabilized TTRs (). As with the aforementioned transcriptional data, AC16 cells exposed to TTRL55P and TTRV122I appear to exhibit variant-specific responses at the level of chromatin accessibility.
Figure 5. Cells exposed to pathologically associated destabilized TTR exhibit mutation-specific changes in chromatin signatures resolved by pre-incubation with tafamidis. (A) SH-SY5Y and AC16 cells were exposed to TTRWT, highly destabilized TTRL55P and cardiomyopathy-associated TTRV122I at physiological concentrations (0.2 mg/mL). Forty-eight hours later, gDNA was isolated and ATACseq was performed. In parallel, recombinant proteins were pre-incubated with tafamidis (taf) to control for changes due to misfolded forms of the protein. (B) Comparison of promoter region-associated DAPs unique to and shared between AC16 cells exposed to wild-type (TTRWT), cardiomyopathy-associated (TTRV122I) or highly destabilized (TTRL55P) TTR variants. DAPs noted are those relative to naïve condition. Heatmaps depicting top 20 up- and downregulated DAPs for SH-SY5Y and AC16 cells exposed to cardiomyopathy-associated TTRV122I (C, D) and highly destabilized TTRL55P (E, F) in the absence of tafamidis. On the y-axis are DAPs occurring in promoter regions associated with protein coding genes for each noted variant relative to naïve condition. HS- and Tg-exposed samples (noted in ) are also included. The x-axis notes samples in technical duplicate. Black boxes depict DAP signature resulting from noted variant.
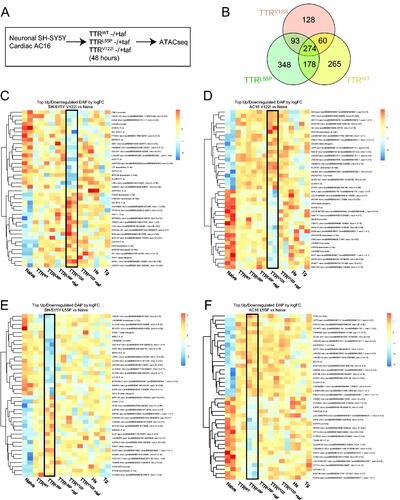
Lastly, we then wanted to visualize the strongest DAP signature driven by each pathologic variant across both SH-SY5Y and AC16 cells. To do this, we examined the top 20 up- and downregulated DAPs in SH-SY5Y and AC16 cells exposed to TTRs in the presence and absence of tafamidis. When portraying these data via heatmaps, we see clear signatures denoting both increased and decreased accessibility of DAPs lying within promoter regions of protein coding genes (black boxes, ). Upon pre-incubating TTRV122I (p.V142I) and TTRL55P (p.L70P) with tafamidis immediately prior to dosing cells, these signatures appear to resolve, and accessibility of top DAPs return to levels comparable to cells dosed with TTRWT, suggesting that said changes are due to the misfolded form of the dosed TTR.
Discussion
Here, we mapped transcriptional and chromatin level changes resulting from exposure to profound ER stress via HS and thapsigargin or disease-associated, amyloidogenic TTR and LC proteins.
As our group and others have identified differential regulation of ER stress machinery in cells producing and interacting with pathology-associated TTRs and LCs [Citation9,Citation25], we sought to compare these responses to changes elicited by HS and thapsigargin. In doing so, we generated transcriptional and chromatin accessibility profiles of neuronal SH-SY5Y and cardiac AC16 cells undergoing HS and global UPR activation via thapsigargin. Although transcriptional responses to these perturbagens have been well-documented, these resources are largely generated in single cell types; our data, however, overlays cell type-specific responses to these widely used conditions. Additionally, through our ATACseq experiment, we provide evidence that exposure to ER stress (via HS and thapsigargin) results in substantial changes in accessibility of chromatin regions throughout the genome that are specific to each cell type. To this end, interestingly, post-HS, SH-SY5Y cells exhibited increased accessibility of chromatin regions located within transcription factor binding sites for HSF1, perhaps reflecting functional consequences of said changes in contributing to HSR.
The systemic amyloid diseases are a class of highly complex disorders involving the production of proteins which misfold, travel throughout circulation, and deposit as proteotoxic aggregates at distal target organs. Despite advances in therapeutics for patients with these diseases, the mechanisms of how downstream target cell types become damaged by protein aggregates remain unclear. Here, we employed RNAseq and ATACseq to profile molecular responses of neuronal and cardiac cells to bacterially derived, destabilized recombinant human TTR and LC. Importantly, as patients with ATTR and AL amyloidosis are typically diagnosed in late adulthood (coinciding with prolonged accumulation of misfolded protein) [Citation4–6], our experiments map the earliest signatures of cellular response to destabilized protein exposure and could potentially lead to the identification of novel prognostic biomarkers.
At the transcriptional level, neuronal SH-SY5Y and cardiac AC16 cells appeared to respond more strongly to TTRs with varying pathologies, as implied by a greater number of DEGs. Interestingly, this observation was not seen at the chromatin level, suggesting that mutation-driven organ tropism could be reflected at the level of transcriptional stress response. As SH-SY5Y and AC16 cells both responded to each TTR in unique ways, attention should be paid to differences between each TTR variant. To this end, recent work has identified several structural differences across different TTR mutants [Citation26–28]. Although all TTRs employed in this study were produced via bacteria and thus lack post-translational modifications, said proteins could adopt various conformations when in contact with the extracellular environment of each cell type and thus elicit novel responses.
Interestingly, AC16 and SH-SY5Y cells exhibited a substantial number of DEGs when exposed to wild-type TTR protein. There could be several potential interpretations to this observation. The first could be that these DEGs reflect cellular response to wild-type TTR itself (perhaps related to its function as a transporter of retinol binding protein (RBP) and thyroxine). Interestingly, several studies suggest TTR may possess metalloprotease activity and bind to molecules structurally similar to RBP and thyroxine [Citation29]. Additionally, a growing body of evidence implicates TTR as possessing neuroprotective activity via putative receptor-mediated processes [Citation29–34]. Taken together, this work highlights the potential for extracellular, wild-type TTR to elicit intracellular changes. Lastly, DEGs resulting from wild-type TTR exposure may reflect variability in the recombinant protein produced, including purity.
One limitation of this study, which should be considered when interpreting these data, can be seen in limited information regarding variability across recombinant proteins employed. Notably, recombinant TTRs were produced separately from recombinant LCs and as a result, care could be taken when interpreting differences between TTR and LC exposure. Additionally, although there are previously published data regarding the conformations of recombinant human TTRs and full-length LCs similar to those used in our experiments [Citation24,Citation35], we have not validated the conformation of said proteins in our culture conditions. In similar cell culture systems, however, our group and others have found pre-amyloidogenic oligomers (in contrast to amyloid fibrils) are the major toxic species in the disease [Citation26,Citation27]. Moreover, although it is likely that recombinant protein employed in this study contains multiple conformations (e.g. monomers, oligomers, etc.), additional work should be undergone to assess conformations exhibited by different recombinant TTRs and LCs in cell-free environments as well as various cell culture conditions (including varying pH, growth factors, serum levels, etc.).
Through our RNAseq data, we observed that AC16 cells exposed to TTRV122I, TTRL55P and ALLC exhibited upregulation of myogenesis Hallmark pathway target genes, potentially representing a protective mechanism (e.g. cardiac remodeling in instances of stress). Interestingly, patients with both ATTR and AL amyloidosis exhibit symptoms associated with cardiac hypertrophy [Citation28,Citation36], reflected in our transcriptional signatures. Moreover, as patients can present with thickening of cardiac ventricle walls without amyloid deposition [Citation37], it is possible that our work highlights a hypertrophy-associated transcriptional response seen in patients with early stages of the disease. At the same time, SH-SY5Y cells exposed to TTRL55P (p.L70P) resulted in increased expression of genes associated with fatty acid metabolism and protein secretion, both processes implicated in the pathogenesis of other amyloid disorders such as Alzheimer’s disease (AD) [Citation38,Citation39]. In line with these data, recent work has found altered metabolite levels in the blood of patients with ATTR-associated polyneuropathy [Citation40] perhaps related to inflammatory damage to cells of the peripheral nerves. Although the data herein represent SH-SY5Y and AC16 cell-specific transcriptional responses, which correlate with exposure to destabilized TTRs and LCs, additional experimentation is needed to provide a mechanistic link between gene expression changes and deleterious effects on cells resulting from exposure to destabilized proteins.
Problematically, mechanisms underlying how cells become damaged by misfolded TTRs remain unclear, while methods to track gross cellular changes such as viability dyes are highly variable. As a result, cell culture models for studying multi-tissue aspects of ATTR amyloidosis remain limited. In the future, pre-clinical models of ATTR and AL amyloidosis may employ the data herein to determine effectiveness of limiting the effect of destabilized LCs and TTRs on cells in culture by tracking expression of noted genes.
In addition to transcriptional responses, our data demonstrate that cells interacting with extracellular TTRs exhibit chromatin-level changes. As DAP signatures appear to resolve upon pre-incubating destabilized variants with tafamidis, said changes may result from misfolded forms of the administered protein. Although we did not observe changes at the transcriptional level when pre-incubating TTRs with tafamidis (perhaps due to dose, exposure and/or timing), these results highlight the benefit of structure-based kinetic stabilizers at downstream target cell types.
A majority of current treatments for ATTR amyloidosis as well as pre-clinical pharmacologic agents for AL amyloidosis primarily focus on decreasing levels of circulating misfolded protein, thus limiting the formation of downstream toxic aggregates [Citation41–43]. Understanding the molecular mechanisms through which TTRs and LCs elicit damage, however, may uncover novel therapeutic avenues applicable at downstream target cells. At the same time, efficacy of treatments for systemic amyloid diseases depends on disease progression – a notion complicated by a lack of biomarkers for these difficult to diagnose diseases. Future work may seek to harness these data to identify diagnostic biomarkers indicating the earliest instances of TTR- and LC-mediated stress.
Through these efforts, we have generated comprehensive datasets representing transcriptional- and chromatin level responses of SH-SY5Y and AC16 cells to ER stress via HS and thapsigargin as well as amyloidogenic TTRs and LCs. In doing so, we identified transcriptional signatures of TTR- and LC-mediated cell stress unique to both cell type and destabilized protein. In addition, our analysis uncovers changes in chromatin architecture resulting from the presence of mutant TTR deposition. These changes were absent following pre-incubation with tafamidis, suggesting that the stabilizer may prevent potentially detrimental changes observed at the chromatin level. The datasets generated herein may be utilized by the proteostasis and amyloid research communities to better understand ER stress in multiple cellular contexts as well as aid in the development of cellular models for complex, multi-system amyloid diseases such as ATTR and AL amyloidosis.
Author contributions
S.G., R.M.G. and G.J.M. designed the project, devised experiments, analyzed data and wrote the manuscript. R.M.G., S.G., C.V.M., J.L.V., D.K., C.S.G. and C.V.E. performed experiments and analyzed data. V.S. and L.H.C. provided feedback and assisted in writing the manuscript.
| Abbreviations | ||
| AL amyloidosis | = | light chain amyloidosis |
| ATTR amyloidosis | = | transthyretin amyloidosis |
| DAP | = | differentially accessible peak |
| DEG | = | differentially expressed gene |
| FDR | = | false discovery rate |
| HS | = | heat shock |
| HSR | = | heat shock response |
| LC | = | light chains |
| Tg | = | thapsigargin |
| TTR | = | transthyretin |
| UPR | = | unfolded protein response |
Supplemental Material
Download MS Excel (5.3 MB)Supplemental Material
Download MS Excel (5.3 MB)Supplemental Material
Download MS Excel (8.6 MB)Supplemental Material
Download MS Excel (8.6 MB)Supplemental Material
Download MS Word (312.3 KB)Supplemental Material
Download MS Word (126 KB)Supplemental Material
Download MS Word (200 KB)Acknowledgements
The authors thank the Wiseman Laboratory of The Scripps Research Institute for providing recombinant human TTRs and tafamidis, the Microarray and Sequencing Resource Core Facility of Boston University School of Medicine for technical assistance with sample preparation, Dr. Gregory J. Miller of the Center for Regenerative Medicine (CReM) for technical and operational support and Dr. Kim Vanuytsel and Todd Dowrey of the CReM for helpful discussions.
Disclosure statement
No potential conflict of interest was reported by the author(s).
Additional information
Funding
References
- Giadone RM, Ghosh S, Murphy GJ. Chapter 4 – patient-specific induced pluripotent stem cells for understanding and assessing novel therapeutics for multisystem transthyretin amyloid disease. In: Birbrair A, editor. Novel concepts in iPSC disease modeling. Vol. 15. London: Academic Press; 2022. p. 105–122.
- Buxbaum JN. The systemic amyloidoses. Curr Opin Rheumatol. 2004;16(1):67–75. doi: 10.1097/00002281-200401000-00013
- Falk RH, Comenzo RL, Skinner M. The systemic amyloidoses. N Engl J Med. 1997;337(13):898–909. doi: 10.1056/NEJM199709253371306
- Giadone RM, Rosarda JD, Akepati PR, et al. A library of ATTR amyloidosis patient-specific induced pluripotent stem cells for disease modelling and in vitro testing of novel therapeutics. Amyloid. 2018;25(3):148–155. doi: 10.1080/13506129.2018.1489228
- Sanchorawala V. Light-chain (AL) amyloidosis: diagnosis and treatment. Clin J Am Soc Nephrol. 2006;1(6):1331–1341. doi: 10.2215/CJN.02740806
- Ando Y, Nakamura M, Araki S. Transthyretin-related familial amyloidotic polyneuropathy. Arch Neurol. 2005;62(7):1057–1062. doi: 10.1001/archneur.62.7.1057
- Buxbaum JN, Ruberg FL. Transthyretin V122I (pV142I)* cardiac amyloidosis: an age-dependent autosomal dominant cardiomyopathy too common to be overlooked as a cause of significant heart disease in elderly African Americans. Genet Med. 2017;19:733–742.
- Lashuel HA, Wurth C, Woo L, et al. The most pathogenic transthyretin variant, L55P, forms amyloid fibrils under acidic conditions and protofilaments under physiological conditions. Biochemistry. 1999;38(41):13560–13573. doi: 10.1021/bi991021c
- Giadone RM, Liberti DC, Matte TM, et al. Expression of amyloidogenic transthyretin drives hepatic proteostasis remodeling in an induced pluripotent stem cell model of systemic amyloid disease. Stem Cell Rep. 2020;15(2):515–528. doi: 10.1016/j.stemcr.2020.07.003
- Grandjean JMD, Plate L, Morimoto RI, et al. Deconvoluting stress-responsive proteostasis signaling pathways for pharmacologic activation using targeted RNA sequencing. ACS Chem Biol. 2019;4:784–795.
- Robinson MD, McCarthy DJ, Smyth GK. edgeR: a bioconductor package for differential expression analysis of digital gene expression data. Bioinformatics. 2010;26(1):139–140. doi: 10.1093/bioinformatics/btp616
- Korotkevich G, Sukhov V, Budin N, et al. Fast gene set enrichment analysis. doi: 10.1101/060012. 2016
- Buenrostro JD, Giresi PG, Zaba LC, et al. Transposition of native chromatin for fast and sensitive epigenomic profiling of open chromatin, DNA-binding proteins and nucleosome position. Nat Methods. 2013;10(12):1213–1218. doi: 10.1038/nmeth.2688
- Wei Z, Zhang W, Fang H, et al. esATAC: an easy-to-use systematic pipeline for ATAC-seq data analysis. Bioinformatics. 2018;34(15):2664–2665. doi: 10.1093/bioinformatics/bty141
- Schubert M, Lindgreen S, Orlando L. AdapterRemoval v2: rapid adapter trimming, identification, and read merging. BMC Res Notes. 2016;9:88.
- Langmead B, Salzberg SL. Fast gapped-read alignment with bowtie 2. Nat Methods. 2012;9(4):357–359. doi: 10.1038/nmeth.1923
- Boyle AP, Guinney J, Crawford GE, et al. F-Seq: a feature density estimator for high-throughput sequence tags. Bioinformatics. 2008;24(21):2537–2538. doi: 10.1093/bioinformatics/btn480
- Zeller KI, Jegga AG, Aronow BJ, et al. An integrated database of genes responsive to the myc oncogenic transcription factor: identification of direct genomic targets. Genome Biol. 2003;4(10):R69. doi: 10.1186/gb-2003-4-10-r69
- Grandjean JMD, Madhavan A, Cech L, et al. Pharmacologic IRE1/XBP1s activation confers targeted ER proteostasis reprogramming. Nat Chem Biol. 2020;16(10):1052–1061. doi: 10.1038/s41589-020-0584-z
- Rawat P, Boehning M, Hummel B, et al. Stress-induced nuclear condensation of NELF drives transcriptional downregulation. Mol Cell. 2021;81(5):1013–1026.e11. doi: 10.1016/j.molcel.2021.01.016
- Gibellini L, Borella R, De Gaetano A, et al. Evidence for mitochondrial Lonp1 expression in the nucleus. Sci Rep. 2022;12(1):10877. doi: 10.1038/s41598-022-14860-0
- Le Thomas A, Ferri E, Marsters S, et al. Decoding non-canonical mRNA decay by the endoplasmic-reticulum stress sensor IRE1α. Nat Commun. 2021;12(1):7310. doi: 10.1038/s41467-021-27597-7
- Dvela-Levitt M, Kost-Alimova M, Emani M, et al. Small molecule targets TMED9 and promotes lysosomal degradation to reverse proteinopathy. Cell. 2019;178(3):521–535.e23. doi: 10.1016/j.cell.2019.07.002
- Klimtchuk ES, Prokaeva TB, Spencer BH, et al. In vitro co-expression of human amyloidogenic immunoglobulin light and heavy chain proteins: a relevant cell-based model of AL amyloidosis. Amyloid. 2017;24(2):115–122. doi: 10.1080/13506129.2017.1336996
- Chen JJ, Genereux JC, Qu S, et al. ATF6 activation reduces the secretion and extracellular aggregation of destabilized variants of an amyloidogenic protein. Chem Biol. 2014;21(11):1564–1574. doi: 10.1016/j.chembiol.2014.09.009
- Reixach N, Deechongkit S, Jiang X, et al. Tissue damage in the amyloidoses: transthyretin monomers and nonnative oligomers are the major cytotoxic species in tissue culture. Proc Natl Acad Sci U S A. 2004;101(9):2817–2822. doi: 10.1073/pnas.0400062101
- Leung A, Nah SK, Reid W, et al. Induced pluripotent stem cell modeling of multisystemic, hereditary transthyretin amyloidosis. Stem Cell Rep. 2013;1(5):451–463. doi: 10.1016/j.stemcr.2013.10.003
- Philippakis AA, Falk RH. Cardiac amyloidosis mimicking hypertrophic cardiomyopathy with obstruction: treatment with disopyramide. Circulation. 2012;125(14):1821–1824. doi: 10.1161/CIRCULATIONAHA.111.064246
- Magalhães J, Eira J, Liz MA. The role of transthyretin in cell biology: impact on human pathophysiology. Cell Mol Life Sci. 2021;78(17–18):6105–6117. doi: 10.1007/s00018-021-03899-3
- Alemi M, Gaiteiro C, Ribeiro CA, et al. Transthyretin participates in beta-amyloid transport from the brain to the liver – involvement of the low-density lipoprotein receptor-related protein 1? Sci Rep. 2016;6:20164. doi: 10.1038/srep20164
- Fleming CE, Mar FM, Franquinho F, et al. Transthyretin internalization by sensory neurons is megalin mediated and necessary for its neuritogenic activity. J Neurosci. 2009;29(10):3220–3232. doi: 10.1523/JNEUROSCI.6012-08.2009
- Buxbaum JN, Ye Z, Reixach N, et al. Transthyretin protects Alzheimer’s mice from the behavioral and biochemical effects of Aβ toxicity. Proc Natl Acad Sci U S A. 2008;105(7):2681–2686. doi: 10.1073/pnas.0712197105
- Li X, Masliah E, Reixach N, et al. Neuronal production of transthyretin in human and murine Alzheimer’s disease: is it protective? J Neurosci. 2011;31(35):12483–12490. doi: 10.1523/JNEUROSCI.2417-11.2011
- Wang X, Cattaneo F, Ryno L, et al. The systemic amyloid precursor transthyretin (TTR) behaves as a neuronal stress protein regulated by HSF1 in SH-SY5Y human neuroblastoma cells and APP23 Alzheimer’s disease model mice. J Neurosci. 2014;34(21):7253–7265. doi: 10.1523/JNEUROSCI.4936-13.2014
- Chen JJ, Genereux JC, Hyun Suh E, et al. Endoplasmic reticulum proteostasis influences the oligomeric state of an amyloidogenic protein secreted from mammalian cells. Cell Chem Biol. 2016;23(10):1282–1293. doi: 10.1016/j.chembiol.2016.09.001
- Otaka Y, Nakazato Y, Tsutsui T, et al. Cardiac involvement in heavy and light chain amyloidosis. Medicine. 2019;98(46):e17999. doi: 10.1097/MD.0000000000017999
- Wang J, Marzolf A, Zhang JCL, et al. Cardiac amyloidosis masked as hypertrophic cardiomyopathy: a case report. Cardiol Res. 2016;7(5):178–180. doi: 10.14740/cr496w
- Snowden SG, Ebshiana AA, Hye A, et al. Association between fatty acid metabolism in the brain and Alzheimer disease neuropathology and cognitive performance: a nontargeted metabolomic study. PLoS Med. 2017;14(3):e1002266. doi: 10.1371/journal.pmed.1002266
- Liu Q, Zhang J. Lipid metabolism in Alzheimer’s disease. Neurosci Bull. 2014;30(2):331–345. doi: 10.1007/s12264-013-1410-3
- Luigetti M, Guglielmino V, Romano A, et al. A metabolic signature of hereditary transthyretin amyloidosis: a pilot study. Int J Mol Sci. 2022;23(24):16133. doi: 10.3390/ijms232416133
- Bulawa CE, Connelly S, Devit M, et al. Tafamidis, a potent and selective transthyretin kinetic stabilizer that inhibits the amyloid cascade. Proc Natl Acad Sci U S A. 2012;109(24):9629–9634. doi: 10.1073/pnas.1121005109
- Coelho T, Merlini G, Bulawa CE, et al. Mechanism of action and clinical application of tafamidis in hereditary transthyretin amyloidosis. Neurol Ther. 2016;5(1):1–25. doi: 10.1007/s40120-016-0040-x
- Adams D, Gonzalez-Duarte A, O'Riordan WD, et al. Patisiran, an RNAi therapeutic, for hereditary transthyretin amyloidosis. N Engl J Med. 2018;379(1):11–21. doi: 10.1056/NEJMoa1716153