
Abstract
Introduction
Histological examination of tissue specimens obtained during surgical treatment of trigger finger frequently encountered unclassifiable amyloid deposits in the annular ligament. We systematically explored this unknown type by a comprehensive analysis using histology, immunohistochemistry, and quantitative mass spectrometry-based proteomics.
Methods
205 tissue specimens of annular ligaments were obtained from 172 patients. Each specimen was studied by histology and immunohistochemistry. Tissue specimens obtained from ten patients with histology proven amyloid in annular ligament were analysed by label-free quantitative proteomics. Histological and immunohistochemical findings were correlated with patient demographics.
Results
Amyloid was present as band like deposits along the surface of annular ligament, dot like or patchy deposits within the matrix. Immunohistochemistry identified ATTR amyloid in 92 specimens (mostly patchy in the matrix), while the band like deposits of 100 specimens remained unclassifiable. Proteomic profiles identified the unknown amyloid as most likely of fibrinogen origin. The complete cohort was re-examined by immunohistochemistry using a custom-made antibody and confirmed the presence of fibrinogen alpha-chain (FGA) in a hitherto unclassifiable type of amyloid in annular ligament.
Conclusion
Our study shows that two different types of amyloid affect the annular ligament, ATTR amyloid and AFib amyloid, with distinct demographic patient characteristics and histomorphological deposition patterns.
Introduction
Acquired stenosis of the annular ligament is one of the most common diseases involving the tendons of the hand [Citation1]. It typically occurs at an age between 40 and 60 years, and it is more common in women [Citation1,Citation2]. In most cases, stenosis affects annular ligaments of the palm, guiding the flexor tendons of the fingers. The causes of the degenerative processes are wear and pressure. The mechanic forces result in microlesions, hypertrophy, and inflammation of the complex of flexor tendon, annular ligament, and flexor tendon sheath. This inflammation causes symptoms such as pain and impairment of movement (annular ligament stenosis, stenosing tenosynovitis) accompanied by swelling and node formation of the flexor tendon, with extreme cases showing the pathognomonic trigger finger phenomenon: during extension of the finger the flexor tendon is locked in the annular ligament. In an early stage, there is an abrupt release of the blockage by the pull of the extensors (digitus saltans). In later stages, the flexor tendon is fixed in the locked position with no ability to extend the finger. This phenomenon mostly appears during extension of the finger because the extensors are weaker than the flexors. If thickening of the tendons is distal to the A1 ligament there is rarely also a triggering during flexion. In most cases, the condition appears at the first ligament (A1), because lever forces are highest at this location during flexion and because the narrow tendon channel starts with the A1 ligament in the distal direction. However, the second annular ligament (A2) can be affected as well. Ring finger, middle finger and thumb are the most commonly affected fingers. Middle-aged women have the highest prevalence of annular ligament stenosis, chronic diseases like diabetes mellitus and gout are known risk factors [Citation1–3]. The initial treatment is conservative, namely injection of steroids and splinting. If conservative therapy does not have a sufficient effect, the annular ligament is released by surgery [Citation2]. This procedure involves dissection and sometimes even removal of parts of the annular ligament, the flexor tendon and synovialis followed by histopathological examination. Common histological findings are fibrocartilaginous metaplasia at the touching point of the annular ligament and flexor tendon. Additionally, there is hypertrophy, an inflammatory reaction and scarring [Citation1,Citation2]. Amyloid is also commonly detected in the annular ligament.
Amyloid and its related symptoms, i.e. amyloidosis, is characterised by the deposition of misfolded peptides and proteins in a β-sheet structure showing unique tinctorial and ultrastructural properties. Until now, 42 mostly autologous and physiological precursor proteins have been identified to cause amyloid [Citation4]. Despite great variability regarding their expression and physiological function, once aggregated into amyloid, all share a characteristic green birefringence after Congo red staining in polarisation microscopy and, ultrastructurally, non-branching fibrils of 10-12 nm width and variable length. Amyloid may occur strictly locally/organ-limited or as a systemic disease. The clinical phenotype varies greatly and depends on the nature of the amyloid protein and the extent of amyloid formation [Citation4].
In recent years, the Amyloid Registry Kiel received a large number of annular ligament specimens for subtyping of amyloid. Apart from ATTR amyloid, a substantial number of cases had unclassifiable amyloid deposits, i.e. the deposits could not be assigned to any known acquired amyloid type representing a putative novel unknown local type of amyloid. In this study, we aimed to identify the so far unknown type of amyloid, which is associated with annular ligament stenosis. Furthermore, we tested the hypothesis that there are differences between this unclassifiable type and ATTR amyloid concerning the distribution of gender, age as well as anatomical and histological localisation.
In the present study, we used correlation-based proteome profiling to identify the major components of the amyloid deposits allowing for the first time to identify fibrinogen-derived amyloid proteins as well as the well-known ATTR amyloid in annular ligament [Citation5].
Material and methods
Ethics statement
This project was approved by the local ethics committee of the University Hospital in Kiel conforming to the Declaration of Helsinki (D581/15-D585/15). Consent was not required for this retrospective study on archival tissue specimens under local or national guidelines.
Study cohort
The study population consisted of all cases with the diagnosis of trigger finger, stenosis of the annular ligament, and nodular tendinous disease submitted to the Amyloid Registry Kiel between 2010 and 2018, from whom specimens of the annular ligament were available. All cases with the diagnosis of carpal tunnel syndrome or ganglion were excluded from the study cohort. For each case, age at diagnosis, gender, anatomical side, and localisation were documented.
Histology
All tissue samples had been fixed in neutral buffered formalin and embedded in paraffin. Paraffin serial sections were used throughout this study. Congo red staining was performed as described by Puchtler et al. [Citation6]. The presence of amyloid was verified by polarisation microscopy using the Nikon Eclipse LV100POL polarisation microscope (Nikon, Hamburg, Germany).
Digital image analysis
The amyloid load was assessed by digital image analysis as described previously [Citation7]. Congo red stained tissue sections were scanned using a Hamamatsu NanoZoomer 2.0 RS scanner (Hamamatsu Photonics Deutschland GmbH, Herrsching am Ammersee, Germany) at 400 times magnification in sequential bright field and fluorescence mode (excitation/emission wavelength 560/607 nm for detection of Congo red fluorescence and 485/526 nm for compensation of unspecific background signal, respectively). ImageJ version 1.52p (National Institutes of Health, USA) was used to select and count all tissue pixels in the bright field image and all pixels showing Congo red signal in the fluorescence image (compensated for unspecific background), respectively. The amyloid load was calculated as the ratio of both pixel counts.
Generation of a polyclonal anti-fibrinogen antibody
A recombinant peptide spanning residues hFGA558-575 (NH2-CKESSSHHPGIAEFPSRGK-CONH2) of the fibrinogen protein was synthesised and purified by high pressure liquid chromatography (HPLC) with a purity of 86% and 89%, respectively. Two female 3–4 months old New Zealand white rabbits were injected with the synthetic peptide coupled to keyhole limpet haemocyanin according to a standardised immunisation protocol (Pineda Antibody-Service, Berlin, Germany). Serum was taken 60 and 100 days after immunisation and final bleed after 120 days. The IgG fraction was purified from the final bleed with a HiTrap Protein G HP affinity column (Amersham Biosciences AB, Freiburg, Germany).
The reactivity and specificity of the peptide-antibody were first tested by dot blot. Briefly, 5 µg of the same antigen as used for the immunisation was administered to a nitrocellulose membrane (Hybond-ECL, Amershan Bioscience, Freiburg, Germany) and air dried for 30 min at room temperature. Subsequently, the membrane was blocked with Tris-buffered saline (TBS) containing 3% bovine albumin for 30 min and incubated with either preimmune serum, IgG purified primary antibody, or without any primary antibody for 30 min. An alkaline phosphatase-conjugated goat-anti-rabbit antibody (1:1000, DAKO) served as the secondary antibody (30 min at room temperature). Washing between steps was carried out with TBS. The immunoreaction was visualised with the NBT/BCIP substrate (p-nitroblue tetrazolium chloride/5-bromo-4-chloro-3-indolyl phosphate; Pierce Biotechnology, Bonn, Germany).
Secondly, the specificity and sensitivity were tested on known cases with diverse types of amyloid, i.e. AA-, hereditary AFib-, ALκ-, ALλ-, and ATTR amyloidosis. In all cases with hereditary AFib amyloidosis, the anti-Fib-antibody showed even and strong immunostaining of the amyloid deposits (Supplementary Figure 1). No staining was found with any other type of amyloid (data not shown).
Immunohistochemistry
Immunostaining was done using commercially available antibodies directed against AA amyloid, amyloid-P component, lambda light chain, and kappa light chain antibody (all DAKO, Glostrup, Denmark). Additionally, the following non-commercially available antibodies were used: anti-Apo A1 [Citation8], anti-lambda light chain-peptide antibody AL7 [Citation9], anti-TTR 87-106 peptide antibody [Citation10], and anti-fibrinogen antibody (see above; Pineda Antibody Services, Berlin, Germany). The tissue samples were pre-treated with Leica Epitope Retrieval Solution (Leica Microsystems, Wetzlar, Germany). The samples were stained using Leica BOND-MAX fully automated immunohistochemistry and in situ-hybridization staining system (Leica Microsystems) and Leica Bond Polymer Refine Red Detection Kit (Leica Microsystems). Antigen-retrieval was performed for the following antibodies: anti-amyloid-P, anti-lambda light-chain, anti-kappa light-chain, anti-TTR (ER2-Bond- Epitope Retrieval Solution 2), anti-Apo-A1 (ER1-Bond Retrieval Solution 1) and anti-lambda light-chain AL7 (Enzyme 1). Immunohistochemical classification of amyloid was carried out and validated as described in detail elsewhere [Citation9].
Study design
For this study, all cases were re-evaluated histologically and the distribution patterns as well as the amount of amyloid were documented as follows: the histoanatomical site, e.g. of the annular ligament was divided into the ‘surface’ (which was in direct contact to the tendon), the matrix (where in addition dot-like and areal deposits were distinguished), and, if present, the ligament’s synovialis and flexor tendon. The amount of amyloid was categorised for each histoanatomical site as absent (0), small (1+), moderate (2+), or large amounts (3+). Both size and abundance of amyloid deposits were considered.
Statistical analysis
All scores and the general patient data were recorded in a table using Microsoft Excel. For statistical purposes, the data was converted to SPSS Statistics. For men and women, the median, the 25th, and 75th percentile were calculated each. Differences in the distribution of amyloid between the different fingers were analysed by a ‘6-sample test for equality of proportions without continuity correction’ with the computer program R. In the same way, the differences in distribution between the left and right hand were analysed by a 2-sample test for equality of proportions with continuity correction. Differences in the age distribution of amyloid n.o.s. and ATTR amyloid were analysed by Mann-Whitney-U-Test with SPSS Statistics. The Simes Method for Multiple Hypothesis Testing was conducted.
Sampling for histochemistry and proteome analysis
After the presence of amyloid was confirmed by Congo red staining and polarisation microscopy, amyloid enriched [median amyloid load 3.15% (range 1.20–14.88%)] and -depleted samples [median amyloid load .09% (range .04–.18%)] for proteome analyses were acquired by the following workflow (Supplementary Figure 2): serial sections were cut from paraffin blocks; one paraffin section (thickness 5 µm) was used for Congo red staining and the following six paraffin sections (10 µm each) were used to prepare one proteomics sample. The same scheme was used to prepare the following replicate samples for proteome analysis of the same donor. After overnight drying, the paraffin sections were de-paraffinized for 10 min in xylene and rehydrated for 10 min in 99% ethanol. Samples were stored at −20 °C until further use. In total, tissue sections were prepared from ten donors. Samples of two patients with histologically proven ATTR amyloidosis of annular ligament tissues biopsies were prepared in three replicates (6 samples/donor; 12 samples in total); samples of eight patients with transthyretin (TTR) negative amyloidosis of annular ligament tissue were prepared in duplicate (4 samples/donor, 32 samples in total).
Sample preparation for proteome analysis
To extract proteins from the collected tissue sections a trifluoroacetic acid (TFA) extraction protocol was applied [Citation11]. Briefly, 10 µL of TFA were added to each tissue section and after 10 min at room temperature, samples were neutralised by the addition of 100 µL of 2 M Tris-base in water. Proteins were reduced by incubation for 30 min at 95 °C with 11 µL of a 100 mM Tris(2-carboxyethyl) phosphine solution and then alkylated at room temperature for 20 min by adding 11 µL of a 400 mM chloroacetamide solution. Samples were diluted with 610 µL of water before adding 1 µg of trypsin (Promega, Madison, USA) in 10 µL of .1 M triethylammonium bicarbonate buffer. Samples were lyophilised to dryness and dissolved in 100 µL of .1% TFA. Pierce 100 µL C18-tips were used to desalt the samples, following the protocol of the manufacturer. After eluting the peptides with 100 µL of 90% acetonitrile (ACN), .1% TFA, samples were dried in a vacuum centrifuge, reconstituted in 40 µL of 3% ACN, .05% TFA, and transferred to HPLC-vials for LC-MS analysis. The concentration of the peptide extracts was determined by colorimetric peptide assay (Pierce™ Quantitative Colorimetric Peptide Assay; ThermoFisher Scientific, Dreieich, Germany).
LC-MS analysis
Peptide samples were analysed by LC-ESI MS/MS employing a Dionex U3000 uHPLC system coupled to a QExactive Plus mass spectrometer (ThermoFisher Scientific). Sample volumes of 4 µL were injected on a C18 PepMap 100 precolumn (column dimensions: 300 µm i.d. x 5 mm; ThermoFisher Scientific) with a flow rate of 30 µL/min, trapped and desalted for 2 min and then separated on an Acclaim PepMap RSLC column (column dimension: 75 µm i.d. x 50 cm; (ThermoFisher Scientific) over a gradient of eluent A (.05% aqueous formic acid (FA)) and eluent B (80% ACN, .04% FA) with a flow rate of 300 nL/min at a column temperature of 45 °C. Peptides were eluted over a gradient from 5% eluent B to 20% eluent B in 80 min, then to 40% eluent B in 40 min, followed by an increase to 90% eluent B in 8 min. After isocratic elution at 90% eluent B for 15 min, the column was equilibrated for 10 min with 5% eluent B. Each sample LC run was followed by a blank run, injecting 4 µL of loading buffer to wash the column.
Positive ion MS scans were acquired in profile mode with a resolution of 70,000 from 350 m/z to 1400 m/z. The AGC target was set to 3e6 and the maximum inject time was 50 ms. MS scans were recalibrated by a lock mass of siloxane at m/z 445.12003. The top 15 precursors with a charge of 2 to 6 were isolated in a window of 1.4 m/z and fragmented with a normalised collision energy of 27.5. MS2 spectra were acquired in profile mode with a resolution of 17,500 and a scan range from 200 m/z to 2,000 m/z. The AGC target was set to 1e5, the maximum injection time was 100 ms. Acquired precursors were excluded from acquisition for 30 s.
Database search and data analysis
MS spectra were searched using the Proteome Discoverer software (v2.2) and Sequest search algorithm with a human reference proteome (UniProt 01.2020; 74788 entries) database and common laboratory contaminants (cRAP, https://www.thegpm.org/crap/). Sequest searches were performed with a precursor mass accuracy of 8 ppm and fragment mass accuracy of .02 Da. Carbamidomethyl (+57.021 Da) at Cys was set as fixed modification and three missed cleavages were allowed in two database searches with different proteolytic specificity and variable modifications: (I) Fully trypsin-specific peptides were searched allowing for variable modifications of acetyl (+42.011 Da) and methionine-loss (−131.040 Da) at protein N-termini; oxidation (+15.995 Da) at Met and Pro; the ubiquitin remnant motive GG (+114.043 Da), methyl (+14.016), dimethyl (+28.031 Da) and acetyl (+42.047 Da) at Lys and deamidation (+.984 Da) of Asn and Gln.; (II) peptides with semi tryptic protease specificity were searched with dynamic modification of methylation (+14.016) and acetylation (+42.011 Da) at Lys and oxidation (+15.995 Da) at Met and Pro. The two Sequest searches were combined with percolator q-values below .01. LFQ was performed using the Minora Feature Detector. Chromatographic peaks were aligned, with a mass tolerance of 10 ppm, a retention time-dependent normalisation was performed and precursor abundance was based on the area of MS peaks. The sum of peak areas of unique and razor peptides was integrated to calculate LFI values of peptide- and protein groups. Median-normalised protein level LFI values were used for statistical analysis. Perseus 1.6.12.0 was used to correlate profiles of LFI values across 36 samples to detect amyloid-associated proteins by similarity to the profile of TTR and to calculate the false discovery rate (FDR or q-value) [Citation12].
LC-MS data were deposited to the ProteomeXchange Consortium via the PRIDE partner repository [Citation13] with the dataset identifier PXD039511.
Results
Study population
205 specimens obtained from 172 patients [88 (51.2%) women, 84 men (48.8%)] were retrieved from the Amyloid Registry Kiel. The median age at diagnosis was 73 years (ranging from 44-100 years). More than one specimen from a single patient was obtained, when different fingers were affected (14 cases), or when a relapse had occurred (10 cases).
Histology
All tissue samples contained variable amounts of amyloid. Amyloid was found band-like directly below the surface of the annular ligament (hereinafter referred to as surface) as small discontinuous deposits or continuous deposits with variable width along the entire length of the ligament (). Within the matrix, amyloid occurred as either small, singular, dot-like deposits, or as patchy deposits of variable size and distribution, some affecting large areas ().
Figure 1. Amyloid in the annular ligament. Amyloid in the annular ligament (A-cross sectional area) was found as band like-deposits immediately below the surface (B–E; serial sections), as well as dot-like or patchy deposits within the matrix (F–H; serial sections). The band-like deposits at the surface were immunonegative for transthyretin (D) and immunoreacted with an antibody directed against fibrinogen (E). The dot-like and patchy deposits within the matrix stained for transthyretin (H). In 13 cases, both transthyretin- and fibrinogen-immunoreactive amyloid deposits were present within the same resection specimen (I–L; serial sections). Haematoxylin and eosin (A, B), Congo red in polarised light (C), Congo red in fluorescence microscopy (F, I), anti-transthyretin antibody (D, H, K), anti-fibrinogen antibody (E, L), anti-amyloid P component (J). Original magnifications 2-fold (A), 100-fold (I-L), 200-fold (F–H), and 400-fold (B–E).
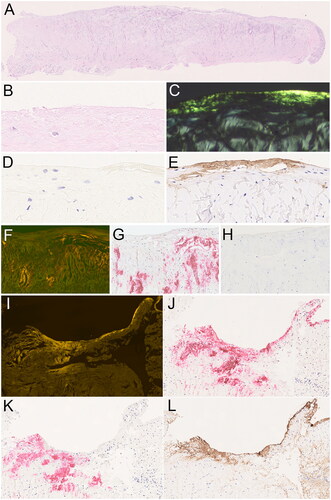
Regarding frequencies, the surface of the annular ligament was affected in 91 valid specimens, patchy in the matrix in 9, and dot-like in the matrix of the annular ligament in 5 specimens (). Overlapping deposition patterns, i.e. two or three, were observed in 86 and 14 specimens, respectively ().
Table 1. Histoanatomical distribution of two different types of amyloid in resection specimens obtained during treatment of trigger finger.
Immunohistochemistry
In 92 specimens, amyloid showed an immunoreaction with an anti-TTR antibody and was classified as ATTR amyloid. In 13 specimens, only some of the amyloid deposits were stained with an anti-TTR antibody, and these cases were therefore classified as mixed type amyloid (Figure 11-L). None of the specimens showed immunoreaction with antibodies directed against apolipoprotein A1, lambda, or kappa light chain. Therefore, for 100 specimens, the amyloid type remained unclassified (amyloid n.o.s.). In a small initial series of cases, antibodies directed against AA amyloid and ß2-microglobulin were used and showed no staining at all (data not shown).
outlines the frequencies of ATTR amyloid and amyloid n.o.s. among the different anatomical locations and deposition patterns. ATTR amyloid was most frequent in the matrix as patchy deposits (p < .001). Amyloid n.o.s. was found primarily at the surface of the annular ligament (p < .001) (). Remarkably, 13 specimens contained both, amyloid n.o.s. and ATTR amyloid (mixed-type) ().
Study cohort data and distribution between fingers
In our cohort of patients with trigger finger, at least two different types of amyloid were found in the annular ligament: ATTR amyloid and a yet unclassified type of amyloid (amyloid n.o.s.). To substantiate the presence of two different types of amyloid, we correlated the anatomical localisation and frequencies of the two different amyloid types with patient demographics and anatomical localisation.
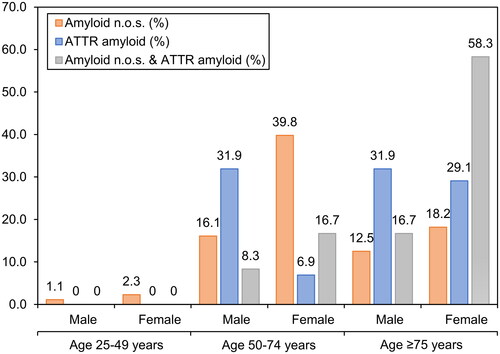
The median age of the ATTR patients (77.0 years; range 55–100 years) was significantly higher than the median age of patients with amyloid n.o.s. (69.5 years; range 44–88 years; p < .001). The same significant difference in age could be identified between patients with amyloid n.o.s. and patients with mixed-type amyloidosis (12 patients; median age 79.5 years, p < .001). There was no significant difference in the age distribution of ATTR and mixed-type amyloidosis. Categorised into three age groups, i.e. 25 to 49 years, 50 to 74 years, and ≥75 years, there was a small number of amyloid n.o.s. cases in the age group 25-50, and no ATTR case. There were more cases of amyloid n.o.s. than ATTR in the age group 50–75, and vice versa in the age group >75 years (). In summary, ATTR turned out to be the prevailing amyloid type in older patients, whereas amyloid n.o.s. was more frequent in younger patients ().
Figure 2. Correlation of amyloid type with patient demographics. Percentages of amyloid types at different age groups at diagnosis in years. Ages grouped into 25–49 years, 50–74 years, and ≥75 years.
There was a significant difference in the distribution of the fingers affected by amyloid n.o.s. (p < .001) and ATTR amyloid (p < .001). For amyloid n.o.s. in men, long and ring finger were affected most frequently (13 and 10 out of 40 specimens), and vice versa in women (ring finger 21 and long finger 20 out of 60 specimens). For ATTR amyloid in men, the ring and long finger were affected most frequently (24 and 15 out of 59 specimens), and vice versa in women (long finger 12 and ring finger 4 out of 33 specimens). Disregarding gender and type of amyloidosis, the long finger was affected most frequently (68 of 205 specimens), followed by the ring finger (60 of 205 specimens, , p < .001).
Amyloid proteome profiling
Amyloid-associated proteins can be classified by a strong correlation of label-free intensity (LFI) profiles with the amyloid protein in a set of samples of approximately equal size but heterogenous amyloid load [Citation5]. Conversely, it should be possible to determine the amyloid type by correlation with a selection of amyloid-associated proteins, which are generally detected as components of deposits irrespective of the amyloid type [Citation14]. To test this hypothesis, tissue specimens obtained from ten patients with histology proven amyloid in the annular ligament were analysed by label-free quantitative proteomics. In total, ten specimens were immunohistochemically characterised using the anti-TTR 87–106 peptide antibody (TTR) [Citation10]. For proteome analysis, two TTR positive and eight TTR negative (= amyloid n.o.s.) cases were dissected to provide samples of equal size with differential amyloid content. Amyloid enriched and depleted samples of the two patients with ATTR amyloidosis were prepared in three replicates (6 samples/donor; 12 samples in total); samples of eight patients with TTR negative amyloidosis of annular ligament tissue were prepared in duplicate (4 samples/donor, 32 samples in total).
In 62 LC-MS runs, 1693 human protein groups were identified, and 1637 were quantified, in the complete dataset of 44 analysed samples. In the subset of 32 TTR negative annular ligament samples from eight donors 1633 human proteins could be quantified. In 12 samples extracted from TTR positive tissues, 1620 human proteins were quantified. The complete dataset is provided in Supplementary Table 1.
To classify the amyloid in these datasets, the average log2 LFI profile of three known amyloid signature proteins, apolipoprotein E (APOE), vitronectin (VTN), and serum amyloid-P component (APCS), which are commonly present in amyloid deposits of any type [Citation14], was used to detect other proteins with correlating profiles.
For this purpose, the datasets were filtered to provide similar coverage and maximal statistical power (). The dataset of 32 TTR negative samples was filtered to 1368 proteins with a minimum of 18 LFI values, which allowed the classification of 125 proteins with significant Pearson correlation (FDR 5%), and 111 proteins with significant Spearman correlation with the averaged profile of the three proteins characteristic to amyloid deposits (). The dataset of 12 ATTR samples was filtered to 1379 proteins with a minimum of 10 LFI values, which allowed the classification of 110 proteins with significant Pearson correlation (FDR 5%) and 107 proteins with significant Spearman correlation with the averaged profile of the three signature proteins characteristic for amyloid deposits ().
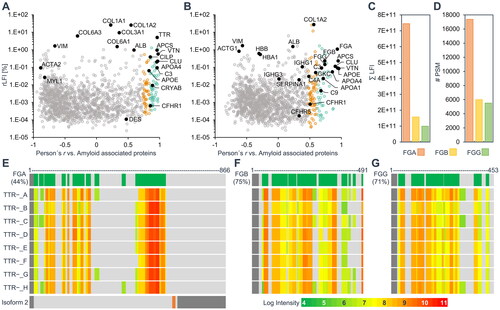
Figure 3. Identification of amyloid associated proteins by correlation of label-free intensity profiles. The scope of the datasets, when filtered for a minimum number of quantitative LFI values per protein among 12 TTR-positive samples (A) and 32 TTR − negative samples (B) is shown on the left axes. The right axes show the corresponding number of proteins with log2 LFI profiles significantly correlating with the average profile of three general amyloid signature proteins (APOE, SAMP and VTN, in black). Correlation-based assignment of TTR in ATTR amyloid (C) and FGA in the unknown amyloid (D). The Pearson’s correlation coefficient of log2 label-free intensity values profiles was tested against the average profile of three general amyloid associated proteins (shown in black). The protein abundance is displayed in relative label-free intensity values (rLFI).
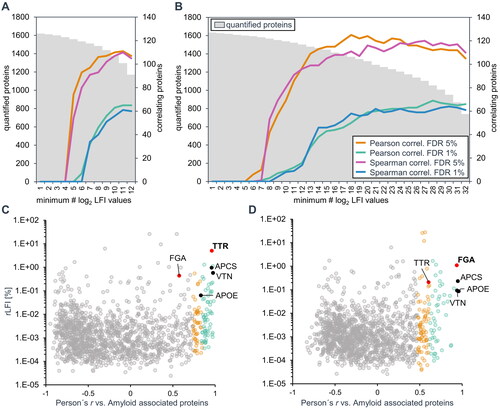
Using the amyloid signature profile to correlate amyloid-associated proteins, TTR could be identified confidently as the amyloidogenic protein in ATTR amyloidosis (as determined by immunohistochemistry), by showing a very strong correlation (r = .98) and the highest relative LFI among all correlating proteins. The annotation of TTR was possible both for the individual cases (Supplementary Figure 3), by including only the profiles of six samples of each case, as well as the complete set of 12 samples from two cases ().
The same parameters identified FGA as the most likely amyloid protein in the TTR negative cases with a very strong correlation (r = .94) to the averaged amyloid signature profile and high intensity values (). Although there are five proteins with higher intensity values among amyloid-associated proteins, three collagens (average r = .55), fibronectin (r = .69) and prolargin (r = .65), these proteins showed a much weaker correlation with the amyloid signature profile. In addition, all five proteins have been previously shown to be components of amyloid deposits but are not expected to be amyloidogenic [Citation14].
Amyloid quantification by estimation of absolute protein abundance
As opposed to relative quantification between samples, label-free quantification strategies have also been devised to generate an estimated index of absolute protein abundances across a sample [Citation15]. In this approach, LFI values are regarded as a measure of mass intensity. By normalising the respective label-free intensities against the complete dataset, relative values (rLFI) were generated for each protein to evaluate the sample composition and amyloid load of the analysed cases.
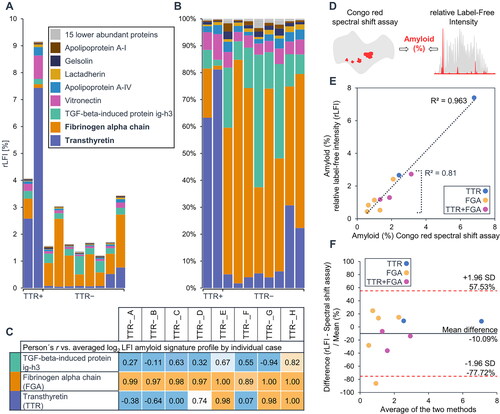
For proteome analysis, paraffin sections of individual patient samples were dissected into amyloid-enriched and amyloid-depleted samples. The sum of the LFI values of enriched and depleted samples before data normalisation was calculated to reflect the complete section specimen of the individual samples. The abundance and profile data of all detected known amyloidogenic proteins were analysed. In total, 26 potentially amyloidogenic proteins were quantified in the dataset [Citation16]. TTR accounted for an average of 5.04% of the sum of the label-free intensity of the two ATTR cases. Among the amyloid n.o.s. cases, FGA was the most abundant potential amyloidogenic protein with an average relative label-free intensity of 1.09%, followed by the TGF-beta-induced protein ig-h3 (.33%) and TTR (.21%), however, ig-h3 did not show a significant correlation with amyloid associated proteins, and profiles of TTR in individual cases indicated the possibility of mixed amyloidosis in three cases, which were determined to be TTR negative by histology. Subsequent re-evaluation of the immunohistochemically stained specimens confirmed the presence of a mixed type amyloidosis in one of these cases ().
We next tested if the abundance of the identified amyloid-causing protein(s) corresponds to the amount of amyloid as measured by digital image analysis using Congo red stained tissue sections [Citation7]. For the two ATTR cases, the rLFI values of TTR were used, while the intensity values of FGA or the sum of TTR and FGA were used in amyloid n.o.s. cases where the correlation-based assignment indicated a single- or mixed-type amyloid, respectively (). The relative abundance of the amyloid protein(s) determined by proteomics in the analysed tissue sections was between .44% and 7.4% and the amyloid quantification results determined by digital image analysis were between .58% and 6.79%. Both approaches show a high degree of conformity with a correlation coefficient of determination of .96 and the mean difference between methods indicated that the results of the digital image analysis were on average, approximately 10% higher ().
Figure 4. Amyloid quantification by proteomics and histology. The relative abundance of known potentially amyloidogenic proteins in each of the analysed cases is shown in (A) and (B). For amyloid n.o.s. cases, relative label-free intensity values of the two major amyloidogenic proteins, TTR, FGA, or the sum of both, were considered if a very strong correlation (r ≥ 0.8) with the amyloid signature profile was observed (C). These rLFI data were compared to the results of amyloid quantification by Congo red spectral shift assay (D). The comparison between the results of two analysis methods is shown in (E). The conformity of values achieved by both methods is shown by the bland altman plot (F).
These data show that FGA is a major component of the amyloid n.o.s. found in the annular ligament. It is noticeable that the amyloid concentration was generally lower in the tissue sections of TTR-negative cases, which matched the histological findings.
Evaluation of amyloid associated proteins
After identifying the most likely amyloid proteins, the presence of additional, type-specific amyloid associated proteins was assessed. The amyloid associated proteins detected in the two ATTR amyloidosis cases were compared with 22 proteins previously associated with renal, cardiac or synovial ATTR amyloid () [Citation17–20]. The FGA-rich annular ligament amyloid profile was matched against 25 proteins previously detected in proteome analyses of laser-microdissected renal AFib amyloid deposits () [Citation21–Citation25]. All of these proteins were also detected in the annular ligament dataset and 15 proteins showed a significant correlation of log2 LFI values to the amyloid signature profile. Some of these proteins can be classified as AFib-associated proteins, like the fibrinogen beta- and gamma-chain (FGB; r = .74, FGG; r = .74), which showed a weaker correlation than FGA and much lower intensity (). The same trend was observed for the number of identified peptides, peptide spectrum matches (), and identification score of the search algorithm for the fibrinogen proteins, even though the sequence coverage of FGA is considerably lower than the coverage of FGB and FGG (). The reason for this may be the lower accessibility of the amyloid for digestion. It is noticeable that the C-terminal part of FGA could not be identified, while the sequence from amino acid 528 to 573 was detected by a number of high-intensity peptides. However, from the proteomic data it is not possible to decide whether this is caused by a possible proteolytic truncation of FGA in the amyloid deposit or by the presence of the shorter isoform 2 of FGA (). The data on peptide identifications of the fibrinogen proteins are provided in Supplementary Table 1.
Figure 5. Amyloid associated proteins previously detected in ATTR or AFib amyloidosis in different tissues. The scatter plots show relative label-free intensities and Pearson correlation coefficients of log2 label-free intensity profiles against the average profile of three general amyloid associated proteins for the two datasets of ATTR amyloidosis cases (A) and the unknown amyloid (B). The 22 proteins previously detected in microdissected ATTR amyloid deposits from kidney, heart or synovial tissue are labelled and shown as black dots in (a). Only renal AFib amyloidosis cases were previously analysed by proteomics. The 25 previously detected AFib associated proteins are labelled and emphasised as black dots in (B). The sum intensity and number of peptide spectrum matches of fibrinogen alpha (FGA), beta (FGB), and gamma (FGG) chains are shown in (C) and (D), respectively. (E-G) show the total sequence coverage of fibrinogen proteins (green) on top, the signal peptides are indicated in dark grey. The relative log intensities of identified peptides for each case are illustrated below. Two isoforms of FGA are expressed by alternative splicing (E bottom). The second isoform differs in amino acids 631-644 (orange) and is truncated from amino acid 654 to 866 (dark gray), however, no peptide discerning the two isoforms could be identified.
Additionally, general amyloid signature proteins could be associated to the unknown amyloid by correlation. These include e.g. serum amyloid P-component (APCS; r = .95), vitronectin (VTN; r = .94), apolipoproteins E, A1, A4 and J (APOE, APOA1, APOA4; CLU; average r = .86), and several components of the complement system, CO3 (r = .69), CO4A (r = .48), CO9 (r = .68) and complement factor H-related protein (CFHR1; r = .5). The constant regions of immunoglobulin light chain kappa (IGKC; r = .59) and collagen type I alpha 2 chain (CO1A2; r = .55) also showed a significant correlation with the amyloid signature profile (). The remaining proteins previously detected in AFib showed no significant Pearson correlation to the averaged amyloid signature profile. Among these proteins, complement factor H-related protein (CFHR5; r = .33), alpha-1-antitrypsin (SERPINA1; r = .33), immunoglobulin heavy constant gamma 1 (IGHG1; r = .38) showed positive but not significant correlations. Lastly, several proteins can be categorised as highly abundant proteins, likely associated with the natural matrix of the analysed tissue. These include haemoglobin subunits α and β (HBA, HBB; r = −.14 for both), cytoplasmic actin 1 filament (ACTG1; r = −.62), vimentin (VIM; r = −.57), and albumin (ALB; r = .23).
In summary, FGA was the most abundant potential amyloidogenic protein among the analysed cases of amyloid n.o.s. The rLFI values of the amyloidogenic proteins TTR, FGA, or the sum of both, in dependence of their correlation with the amyloid signature profile, were in good agreement with the amyloid concentration of sections of the same tissue samples analysed by Congo red digital image analysis. Finally, by correlation with the amyloid signature profile, known components of renal AFib amyloid could be classified as proteins associated with the unknown amyloid. These data show that proteomic profiling was able to successfully type the unknown amyloidosis.
Identification of fibrinogen by immunohistochemistry
A detailed view of the sequence coverage of fibrinogen alpha chain (FGA) achieved by bottom-up proteome analysis is shown in Supplementary Figure 4. After establishing FGA as the most likely fibrillar protein in amyloid n.o.s. cases, we raised an anti-fibrinogen peptide antibody to verify the colocalization of amyloid deposits and FGA by histology on a larger cohort.
Specimens with amyloid n.o.s. in the annular ligament were stained with this antibody, giving the following results: 97 of 99 assessable specimens with amyloid n.o.s. (in two specimens with sparse amyloid n.o.s. the deposits were absent in deeper step sections) at the surface immunoreacted with the anti-FGA antibody (matrix dot-like: 0 of 3 specimens; matrix patchy near the surface: 9 of 9) (). For the 13 cases with mixed-type amyloidosis, i.e. ATTR amyloid and amyloid n.o.s., anti-FGA immunostaining showed both overlapping and non-overlapping immunostaining with the anti-TTR antibody. However, immunostaining of both antibodies covered the entire area of the amyloid deposits present in an individual specimen (). Immunostaining for FGA at the surface in the absence of amyloid (as assessed by Congo red staining and polarisation microscopy) was not observed in any case (). Therefore, our data support the contention that the annular ligament of the trigger finger encloses two distinct types of amyloids, which differ in patient demographics, histoanatomical distribution, protein origin, and most likely also in their aetiology. Finally, among all valid cases of our study cohort, no amyloid deposit remained unclassifiable.
Discussion
ATTR amyloidosis is one of the most common types of amyloidosis. It is caused by a deposition of TTR that is synthesised by the liver and plexus choroideus cells. Transthyretin is a transport protein for retinol and thyroid hormones. It is normally present as a tetramer. There are two different types, i.e. acquired (ATTRwt) and hereditary (ATTRv, approximately 1/3 of the cases) ATTR amyloidosis. The median age at manifestation is around 70 years for ATTRwt and around 60 years for ATTRv amyloidosis. The ATTRv amyloidosis is autosomal-dominant with incomplete penetrance [Citation26]. It is caused by point mutations of the TTR gene. These mutations reduce the stability of the TTR tetramer and promote its disintegration and amyloid formation [Citation26].
Hereditary and non-hereditary ATTR amyloidosis are classified as systemic amyloidoses, where amyloid deposits in multiple organs and tissues, including leptomeningeal vessels. Affection of the heart and nervous system is clinically most relevant. Cardiac involvement limits life expectancy and is characterised by restrictive cardiomyopathy. Cardiac amyloidosis is often preceded by a manifestation in retinaculum flexorum. Regularly, patients describe carpal tunnel syndrome and other manifestations of the connective tissue, such as stenosis of the annular ligament and spinal stenosis caused by affection of the ligamentum flavum in their past medical history. Thus, histological examination of specimens obtained during surgery for carpal tunnel syndrome or spinal stenosis provides an opportunity for early detection of ATTR amyloid before cardiac involvement is manifest [Citation27,Citation28].
To the best of our knowledge, we show here for the first time that the annular ligament of trigger finger is another common anatomical deposition site of ATTR amyloid. Trigger fingers can now be added to a growing list of connective tissue diseases associated with and indicative for ATTR amyloidosis. ATTR amyloid in annular ligament shares many similarities with its counterpart in retinaculum flexorum with regard to patient age and gender [Citation7,Citation29]. Like carpal tunnel syndrome, the prevalence of ATTR amyloid in the annular ligament increases with age and mainly affects men.
Up to now, AFib amyloidosis was only known to occur as a hereditary form, affecting the kidney, heart, liver and nervous system among other anatomical sites. Incomplete penetrance and negative family history make it difficult to detect hereditary AFib amyloidosis without a histological assessment of an affected tissue specimen. Initially, it is often misdiagnosed as AL amyloidosis. Therefore, histology and gene sequencing are mandatory if AFib amyloidosis is suspected [Citation30–33].
As of current knowledge, there are only mutations in the alpha-chain. Mainly, these are autosomal-dominant point mutations with variable penetrance. The most common mutation is the substitution of valine by glutamate at position 526 [Citation34]. Interestingly, wildtype FGA colocalizes with amyloid-β plaques and complexes between the amyloid-β peptide. FGA accumulation in cerebrovascular amyloid-β deposits has been described previously and these complexes are suspected to contribute to vascular damage in Alzheimer’s disease [Citation35,Citation36].
Here we provide evidence that wildtype FGA may also form amyloid at distinct anatomical sites. A comprehensive analysis of resection specimens of the annular ligament during treatment of trigger finger provided evidence of the occurrence of two distinct types, i.e. ATTR amyloid and a hitherto unknown type of amyloid. Using bottom-up proteomics and subsequent immunohistochemistry we could demonstrate that FGA deposits at the immediate surface of the annular ligament as amyloid. No FGA staining was found at the surface in the absence of amyloid.
Fibrinogen is an acute-phase protein and a key component of blood clots. During an acute phase response serum levels of FGA increase [Citation37]. It interacts with other serum proteins, such as Aß and serum amyloid A (SAA). During coagulation, FGA is converted into insoluble fibrin. Clot formation, structure, and stability are strongly influenced by the conditions present during fibrin generation [Citation37]. Amyloid-like structures formed by FGA may be present in thrombi [Citation38]. Although, at present mechanisms of amyloid formation of wildtype FGA remain elusive, it is tempting to speculate that biophysical mechanisms operating specifically at the annular ligament enable amyloid formation. Its almost exclusive presence at the ‘surface’ of the annular ligament points towards pressure and friction as contributing factors. Thus, wild-type FGA might indeed be able to form amyloid under specific pathophysiological conditions.
This study highlights the benefits of quantitative proteomic profiling to analyse amyloid-affected tissue. We show that the correlation-based method described earlier by our group does not only enable the identification of amyloid-associated proteins but can also be used to identify hitherto unknown amyloid proteins in cases with tiny deposits [Citation5]. In addition, label-free quantification allows the assessment of protein abundances, the composition of amyloid deposits, patient categorisation, and amyloid quantification in a tissue sample as a valuable adjunct to histology.
Author contributions
E.G. conducted tissue sample preparation, C.T. performed proteomics sample preparation and LC-MS experiments, C.T. and A.T. performed LC-MS data interpretation. C.T. provided and Supplementary Figures 2–4, and Supplementary Tables 1; N.M.M. and C.R. performed histological and immunohistochemical studies of the study cohort; N.M.M., and C.R. provided . R.R.M., P.U., H.D.A., F.S., K.B., and K.M. provided tissue samples and clinical patient data. C.R., P.U. and R.R.M. carried out primary histological studies. All authors conceptualised and wrote the manuscript.
Data deposition
LC-MS data were deposited to the ProteomeXchange Consortium via the PRIDE partner repository [Citation13] with the dataset identifier PXD039511.
| List of Abbreviations | ||
| ACN | = | Acetonitrile |
| ACTG1 | = | Cytoplasmic actin 1 filament |
| AFib | = | Fibrinogen amyloidosis |
| ALB | = | Albumin |
| APCS | = | Amyloid P component |
| APO | = | Apolipoprotein (APOE, APOAI, APOAIV, APOB, APOC3, APOD, APOH) |
| ATTR | = | Transthyretin amyloidosis |
| CFHR5 | = | Complement factor H-related protein |
| CLUS | = | Apolipoprotein J |
| CO | = | Complement component (CO3, CO4A, CO9) |
| FDR | = | False discovery rate |
| FGA | = | Fibrinogen alpha-chain |
| HBA/B | = | Hemoglobin subunits α and β |
| HPLC | = | High-performance liquid chromatography |
| IGHG1 | = | Immunoglobulin heavy constant gamma 1 |
| IGKC | = | Immunoglobulin light chain kappa |
| LC-ESI MS/MS | = | Liquid chromatography-electrospray ionization-mass spectrometry |
| LC-MS | = | Liquid chromatography–mass spectrometry |
| LFI | = | Label-free intensity |
| rLFI | = | relative label-free intensity |
| LFQ | = | Label-free quantification |
| n.o.s. | = | not otherwise specified |
| SERPINA 1 | = | Alpha-1-antitrypsin |
| TBS | = | Tris-buffered saline |
| FA | = | Trifluoroacetic acid |
| TTR | = | Transthyretin |
| VTN | = | Vitronectin |
Supplemental Material
Download MS Excel (2.2 MB)Supplemental Material
Download PDF (874.7 KB)Disclosure statement
No potential conflict of interest was reported by the author(s).
Data availability statement
Anonymized data are available on request from the senior author.
Additional information
Funding
References
- Scharf H-P, Rüter A, Pohlemann T, et al. Orthopädie und Unfallchirurgie. 2nd. ed. Berlin: Elsevier; 2018.
- Jeanmonod R, Harberger S, Waseem M. Trigger finger. In StatPearls. Treasure Island (FL): StatPearls Publishing; 2023.
- Lee M, Jung YR, Lee YK. Trigger finger secondary to a neglected flexor tendon rupture. Medicine. 2019;98(1):e13980. doi: 10.1097/MD.0000000000013980
- Buxbaum JN, Dispenzieri A, Eisenberg DS, et al. Amyloid nomenclature 2022: update, novel proteins, and recommendations by the international society of amyloidosis (ISA) nomenclature committee. Amyloid. 2022;29(4):213–219. doi: 10.1080/13506129.2022.2147636
- Treitz C, Gottwald J, Gericke E, et al. Quantitative proteome profiling provides evidence of an activation of the complement Cascade in ATTR amyloidosis. Amyloid. 2022;29(2):102–109. doi: 10.1080/13506129.2021.2015316
- Puchtler H, Sweat F, Levine M. On the binding of Congo red by amyloid. J Histochem Cytochem. 1962;10(3):355–364. doi: 10.1177/10.3.355
- Hahn K, Nilsson KPR, Hammarstrom P, et al. Establishing and validating the fluorescent amyloid ligand h-FTAA (heptamer formyl thiophene acetic acid) to identify transthyretin amyloid deposits in carpal tunnel syndrome. Amyloid. 2017;24(2):78–86. doi: 10.1080/13506129.2017.1316711
- Gregorini G, Izzi C, Obici L, et al. Renal apolipoprotein A-I amyloidosis: a rare and usually ignored cause of hereditary tubulointerstitial nephritis. J Am Soc Nephrol. 2005;16(12):3680–3686. doi: 10.1681/ASN.2005040382
- Schönland SO, Hegenbart U, Bochtler T, et al. Immunohistochemistry in the classification of systemic forms of amyloidosis: a systematic investigation of 117 patients. Blood. 2012;119(2):488–493. doi: 10.1182/blood-2011-06-358507
- Gioeva Z, Urban P, Meliss RR, et al. ATTR amyloid in the carpal tunnel ligament is frequently of wildtype transthyretin origin. Amyloid. 2013;20(1):1–6. doi: 10.3109/13506129.2012.750604
- Doellinger J, Schneider A, Hoeller M, et al. Sample preparation by easy extraction and digestion (SPEED) - a universal, rapid, and detergent-free protocol for proteomics based on acid extraction. Mol Cell Proteomics. 2020;19(1):209–222. doi: 10.1074/mcp.TIR119.001616
- Tyanova S, Cox J. Perseus: a bioinformatics platform for integrative analysis of proteomics data in cancer research. In: von Stechow L, editor. Cancer systems biology: methods and protocols. New York, NY: Springer New York; 2018. p. 133–148.
- Vizcaino JA, Deutsch EW, Wang R, et al. ProteomeXchange provides globally coordinated proteomics data submission and dissemination. Nat Biotechnol. 2014;32(3):223–226. doi: 10.1038/nbt.2839
- Gottwald J, Röcken C. The amyloid proteome: a systematic review and proposal of a protein classification system. Crit Rev Biochem Mol Biol. 2021;56(5):526–542. doi: 10.1080/10409238.2021.1937926
- Wisniewski JR, Ostasiewicz P, Dus K, et al. Extensive quantitative remodeling of the proteome between normal colon tissue and adenocarcinoma. Mol Syst Biol. 2012;8:611.
- Varadi M, De Baets G, Vranken WF, et al. AmyPro: a database of proteins with validated amyloidogenic regions. Nucleic Acids Res. 2018;46(D1):D387–D392. doi: 10.1093/nar/gkx950
- Helder MR, Schaff HV, Nishimura RA, et al. Impact of incidental amyloidosis on the prognosis of patients with hypertrophic cardiomyopathy undergoing septal myectomy for left ventricular outflow tract obstruction. Am J Cardiol. 2014;114(9):1396–1399. doi: 10.1016/j.amjcard.2014.07.058
- Lavatelli F, Vrana JA. Proteomic typing of amyloid deposits in systemic amyloidoses. Amyloid. 2011;18(4):177–182. doi: 10.3109/13506129.2011.630762
- Maleszewski JJ, Murray DL, Dispenzieri A, et al. Relationship between monoclonal gammopathy and cardiac amyloid type. Cardiovasc Pathol. 2013;22(3):189–194. doi: 10.1016/j.carpath.2012.09.001
- Rezania K, Pytel P, Smit LJ, et al. Systemic transthyretin amyloidosis in a patient with bent spine syndrome. Amyloid. 2013;20(2):131–134. doi: 10.3109/13506129.2013.792248
- Garnier C, Briki F, Nedelec B, et al. VLITL is a major cross-beta-sheet signal for fibrinogen aalpha-chain frameshift variants. Blood. 2017;130(25):2799–2807. doi: 10.1182/blood-2017-07-796185
- Sethi S, Theis JD, Leung N, et al. Mass spectrometry-based proteomic diagnosis of renal immunoglobulin heavy chain amyloidosis. Clin J Am Soc Nephrol. 2010;5(12):2180–2187. doi: 10.2215/CJN.02890310
- Sethi S, Vrana JA, Theis JD, et al. Laser microdissection and mass spectrometry-based proteomics aids the diagnosis and typing of renal amyloidosis. Kidney Int. 2012;82(2):226–234. doi: 10.1038/ki.2012.108
- Sethi S, Vrana JA, Theis JD, et al. Mass spectrometry based proteomics in the diagnosis of kidney disease. Curr Opin Nephrol Hypertens. 2013;22(3):273–280. doi: 10.1097/MNH.0b013e32835fe37c
- Sethi S, Theis JD. Pathology and diagnosis of renal non-AL amyloidosis. J Nephrol. 2018;31(3):343–350. doi: 10.1007/s40620-017-0426-6
- Chiti F, Dobson CM. Protein misfolding, amyloid formation, and human disease: a summary of progress over the last decade. Annu Rev Biochem. 2017;86:27–68. doi: 10.1146/annurev-biochem-061516-045115
- Fosbol EL, Rorth R, Leicht BP, et al. Association of carpal tunnel syndrome with amyloidosis, heart failure, and adverse cardiovascular outcomes. J Am Coll Cardiol. 2019;74(1):15–23. doi: 10.1016/j.jacc.2019.04.054
- Lauppe RE, Liseth Hansen J, Gerdeskold C, et al. Nationwide prevalence and characteristics of transthyretin amyloid cardiomyopathy in Sweden. Open Heart. 2021;8(2):e001755. doi: 10.1136/openhrt-2021-001755
- Hahn K, Urban P, Meliss RR, et al. Carpal tunnel syndrome and ATTR-amyloidosis. Handchir Mikrochir Plast Chir. 2018;50(5):329–334.
- Eriksson M, Schönland S, Bergner R, et al. Three German fibrinogen alpha-chain amyloidosis patients with the p.Glu526Val mutation. Virchows Arch. 2008;453(1):25–31. doi: 10.1007/s00428-008-0619-4
- Gillmore JD, Lachmann HJ, Rowczenio D, et al. Diagnosis, pathogenesis, treatment, and prognosis of hereditary fibrinogen a alpha-chain amyloidosis. J Am Soc Nephrol. 2009;20(2):444–451. doi: 10.1681/ASN.2008060614
- von Hutten H, Mihatsch M, Lobeck H, et al. Prevalence and origin of amyloid in kidney biopsies. Am J Surg Pathol. 2009;33(8):1198–1205. doi: 10.1097/PAS.0b013e3181abdfa7
- Picken MM. Fibrinogen amyloidosis: the clot thickens!. Blood. 2010;115(15):2985–2986. doi: 10.1182/blood-2009-12-236810
- Chapman J, Dogan A. Fibrinogen alpha amyloidosis: insights from proteomics. Expert Rev Proteomics. 2019; Sep16(9):783–793. doi: 10.1080/14789450.2019.1659137
- Hur WS, Flick MJ. Abeta peptide and fibrinogen weave a web of destruction in cerebral amyloid angiopathy. Proc Natl Acad Sci U S A. 2020;117(27):15391–15393. doi: 10.1073/pnas.2009999117
- Paul J, Strickland S, Melchor JP. Fibrin deposition accelerates neurovascular damage and neuroinflammation in mouse models of Alzheimer’s disease. J Exp Med. 2007;204(8):1999–2008. doi: 10.1084/jem.20070304
- Kattula S, Byrnes JR, Wolberg AS. Fibrinogen and fibrin in hemostasis and thrombosis. Arterioscler Thromb Vasc Biol. 2017;37(3):e13–e21.
- Page MJ, Thomson GJA, Nunes JM, et al. Serum amyloid a binds to fibrin(ogen), promoting fibrin amyloid formation. Sci Rep. 2019;9(1):3102. doi: 10.1038/s41598-019-39056-x