
ABSTRACT
Introduction
Individuals with high schizotypy or schizophrenia exhibit difficulties in distributing their attention across space, leading to a reduction in their “perceptual span” – the extent of visual space that can be attended to at once. In this study, we aim to explore the correlation between schizotypy and perceptual span in a non-clinical sample to investigate whether perceptual span correlates with schizotypy across its range.
Methods
Schizotypy was assessed in fifty-five participants using the Schizotypy Personality Questionnaire (SPQ; Raine, Citation1991). Participants were required to attend to two dynamic targets displayed in a head-mounted virtual reality display. Perceptual span was estimated as the lateral angle of separation between the two targets beyond which performance in the task dropped to threshold.
Results
Participants with higher schizotypy scores performed significantly worse on the task. Of all the factors associated with schizotypy, the shared variance between Disorganisation and Cognitive/Perceptual Factors was most predictive of task performance.
Conclusion
The results support the hypothesis that schizotypy predicts perceptual span in non-clinical samples. Furthermore, the demonstration of a reduced perceptual span in individuals with higher trait schizotypy shows that variations in an individual’s capacity to divide attention across space can be accurately captured using a virtual reality head-mounted display.
Schizotypy is an underlying trait occurring at various levels within the general population, with those scoring higher on schizotypy being more likely to meet the clinical diagnostic criteria for schizophrenia (Raine, Citation1991). Individuals with schizophrenia have been shown to have significant impairments in processing visual information (Fuller et al., Citation2006), including visual search (Gold et al., Citation2007; Kurachi et al., Citation1994), selective attention (Bozikas et al., Citation2005; Chen & Faraone, Citation2000) and divided-attention (Gray et al., Citation2014). In non-clinical populations, research has found that individuals with higher levels of trait schizotypy perform worse on both perceptual (Ettinger et al., Citation2015) and attentional tasks (Lenzenweger et al., Citation1991). One critical aspect of visual attention is an observer’s ability to distribute attention across space, known as “perceptual span” (Rayner, Citation1975). Those with larger perceptual spans can “widen” their attentional window to attend to more visual information from a scene at once; for example, readers with larger spans can comprehend more words at once, and musicians can read more notes at a time (Burman & Booth, Citation2009; Rayner et al., Citation2010).
Individuals with a clinical diagnosis of schizophrenia exhibit significantly smaller perceptual spans than those without a clinical diagnosis, and this has been speculated to be related to difficulty staying focussed when presented with distractions (Strauss et al., Citation1984). Indeed, it has been found that the perceptual spans of people with schizophrenia decrease when there is more distracting visual information in an environment (Neale, Citation1971). Furthermore, research suggests that individuals exhibiting more symptoms of schizophrenia not only have smaller perceptual spans but also experience greater susceptibility to attention disruptions (Strauss et al., Citation1984). These findings have noteworthy implications, as the constrained perceptual span contributes to substantial reading deficits among individuals with schizophrenia (Whitford et al., Citation2013). Additionally, it may lead to deficits in various everyday tasks, such as driving (Fuermaier et al., Citation2019). However, limited research has explored the relationship between perceptual span and trait schizotypy in non-clinical populations.
Prior research into the relationship between schizotypy and visual attention in non-clinical populations has focussed on manipulating attention across either time or space. In tasks where attention was spread spatially but constrained in time, higher trait schizotypy resulted in worse performance measured by slower reaction times (Fuggetta et al., Citation2015; Stotesbury et al., Citation2018). Indeed, when non-clinical participants were tasked with identifying targets within a spatially distributed array of letters, individuals with higher trait schizotypy performed worse (Stotesbury et al., Citation2018). In tasks where stimuli were constrained in space but distributed across time, higher schizotypy also resulted in worse performance (Chen et al., Citation1997; Rawlings & Goldberg, Citation2001). Performance in a task in which participants had to identify target numbers presented for a limited time was similarly impaired in those with higher trait schizotypy (Chen et al., Citation1997). However, little research has been conducted in non-clinical populations in tasks which require attention to be distributed across both time and space.
One recent exception appeared in an unpublished doctoral thesis by Ryan (Citation2020) who reported a link between trait schizotypy and perceptual span. In this experiment, participants completed the Schizotypy Personality Questionnaire (SPQ; Raine, Citation1991), followed by a continuous divided-attention task. The stimuli were two coloured bars, each containing a target zone and a randomly moving white line, and participants were tasked with pressing keys to keep the white lines within the target zones. The researchers measured perceptual span by tracking task performance as the lateral distance between two stimuli was increased. The results revealed that individuals with higher schizotypy scores had significantly smaller perceptual spans. However, it was noted that ceiling effects potentially limited the true extent of this relationship (Ryan, Citation2020).
The link between trait schizotypy and cognitive ability has been studied using a number of techniques including, more recently, using virtual reality environments. Spatial memory abilities in schizotypy have been measured in a virtual environment by testing two groups of high and low schizotypy individuals on a spatial recognition task and found no difference in performance between the two groups (García-Montes et al., Citation2014). Similarly, a virtual environment was used to explore the relationship between schizotypy and navigational ability, finding that individuals with higher schizotypy had impaired ability to learn geometric cues (Quijano et al., Citation2022). The present study aims to extend this work by investigating the association between scores on the SPQ and performance on a divided-attention task, conducted in virtual reality. Establishing whether perceptual span varies with differing levels of trait schizotypy will allow us to understand more about the nature of attentional deficits in individuals with schizophrenia. We hypothesise that task performance will be associated with schizotypy scores, with higher scores on the schizotypy scale correlating with lower perceptual span thresholds, thus indicating poorer task performance.
Materials and methods
Participants
Fifty-five participants (twenty-one male and thirty-four female) with normal, or corrected to normal vision participated in the experiment. Their age ranged from eighteen to sixty. They were recruited from a non-clinical population from the University of Queensland paid participant pool, which largely consisted of undergraduate students. Participants were given a $20 gift card for their time. There were no exclusion criteria for this experiment. The study was approved by the University of Queensland’s Heath and Behavioural Science Low and Negligible Risk Human Research Ethics Committee (2022/HE001599).
Schizotypy assessment
Schizotypy was measured using the Schizotypy Personality Questionnaire (SPQ; Raine, Citation1991). This scale contains seventy-four questions which comprise nine traits associated with schizotypy: Ideas of reference, Excessive social anxiety, Odd beliefs or magical thinking, Unusual perceptual experiences, Odd or eccentric behaviour, No close friends, Odd speech, Constricted affect, and Suspiciousness. Questions on the test include “I find it hard to be emotionally close to people”, and “I often hear voices speaking my thoughts aloud”. These nine traits can be grouped into three factors; Cognitive perceptual deficits, Interpersonal factors, and Disorganisation, although some support has also been shown for two-factor models (Raine et al., Citation1994). The SPQ has been found to have high internal reliability (0.91), high test-retest reliability (0.81), and fifty-five percent of those who score in the highest ten percent met the criteria for a clinical diagnosis for schizotypal personality disorder (Raine, Citation1991).
Stimuli and apparatus
The SPQ was administered using a survey tool (Qualtrics), to allow for easy data acquisition. The virtual reality component of the experiment was conducted with the HTC Vive Pro Eye (2880 × 1600 combined pixels, 90 Hz), and coded in Unity 3D (version 2019.4.12f1). Virtual stimuli were placed at a simulated distance of 130 cm from the participant. This distance was chosen as it was the most comfortable viewing distance during pilot testing. The display was fixed with respect to the head and did not change with head movements.
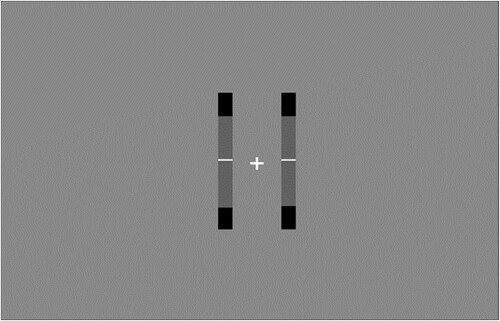
Two vertical bars were presented on either side of a fixation cross, starting at an initial separation of four degrees of visual angle (0.058 m) (). Within each of these two bars was a central grey target zone and a white line. These white lines moved according to a sum of three sines, and always started their movement from the middle of the bar. The left and right lines sampled random phase offsets independently, meaning that movement was unique for each line. The amplitudes of each sine ensured that the white line left the grey target zone at least once per trial.
Figure 1. Image of the virtual reality task.
Note: This image is taken from the game view of the Unity editor.
The size of the stimuli was increased according to a M-scaling formula (Rovamo & Virsu, Citation1979) as they moved further apart to ensure participants could clearly see the stimuli even in the periphery. Eye movements were monitored (HTC SRanipal software) to ensure participants fixated the fixation cross in the centre of the display.
Procedure
Participants first completed the schizotypy assessment. They were then fitted with a VR headset to perform the divided-attention task. Participants completed a rigorous training session before they could begin the experiment. During this training session, they were required to get nine out of ten trials correct before proceeding. In this practice, the two bars remained at four degrees of separation. This ensured that participants understood the task and that their scores were sufficiently high to get an accurate threshold measurement during the staircase procedure. If participants were not able to get nine trials correct, they would receive detailed feedback from the experimenter, and continue to practice until they were able to complete the task. Participants who were unable to get nine trials correct during the practice phase did not proceed to the testing phase and their data were excluded from analysis. After passing this practice, participants then completed three blocks of thirty-five trials, each trial lasting ten seconds.
Participants were asked to fixate on a fixation cross and respond when each white line had left the grey target zone and entered the black box. Responses were made on a keyboard according to direction- for the left box, when the white line was above the grey target zone they pressed the “A” key and when it was below they pressed “Z”. For the right box, the procedure was the same but they pressed keys “K” or “M”. Keystrokes were recorded alongside the eye movement data in Unity. Participants were asked to respond only once per side per trial.
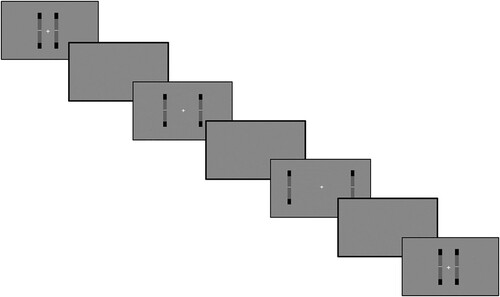
Perceptual span was measured by a 1-up, 2-down staircase procedure (), which converges on sixty-seven percent correct (Kaernbach, Citation1991). As the task was a 4-alternate forced-choice, chance performance was 25%. If participants responded correctly when both white lines left the grey target zone, the bars would move apart laterally by four degrees (0.058m). If participants responded incorrectly, they would move closer together laterally by eight degrees (0.116m). The maximum possible separation between the two bars was 84 degrees, which was deemed the furthest the bars could be seen during pilot testing. Perceptual span was calculated as the grand mean of performance on the last ten trials of the task, across the three experimental blocks.
Figure 2. Task procedure.
Note: An example of the one-up, two-down staircase procedure. The lateral separation of the stimuli is increased following correct responses (frames 1 and 3) and reduced twice as much after an incorrect response (frame 5). Trials are separated by a one second break screen. Time runs from the top-left to the bottom-right of the figure.
If participants gaze deviated more than four degrees in either direction from fixation, the screen turned red until they re-fixated. A comprehensive outline of the materials and results is available at the project’s OSF page (https://osf.io/jyhb2).
Data analysis
A regression analysis with fifty-five participants (N = 50) would be sensitive to medium effects of f2 = 0.148 with a significance criteria of α = .05, and power = .80 (Faul et al., Citation2009).
Results
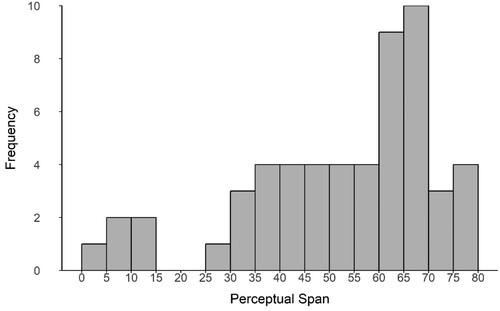
Schizotypy scores collected with the SPQ ranged from 5 to 61, with a mean score of 28.75 and a standard deviation of 14.37, which is consistent with findings of a study of more than five hundred participants (Raine, Citation1991). Scores were normally distributed (W = 0.96, p = 0.17; ), and the value for Chronbach’s alpha was α = .88. Of the fifty-five participants, 12 scored within the top 10% of scores (over 41). A previous study (Raine, Citation1991) reported that 55% of participants exceeding this score met the diagnostic criteria for schizotypal personality disorder. Perceptual span values ranged from 4.7° to 76.8° of visual angle, with an average of 52.42°. Perceptual span was not normally distributed (W = 0.91, p < 0.01; ).
Figure 3. The distribution of participant scores on the Schizotypal personality questionnaire.
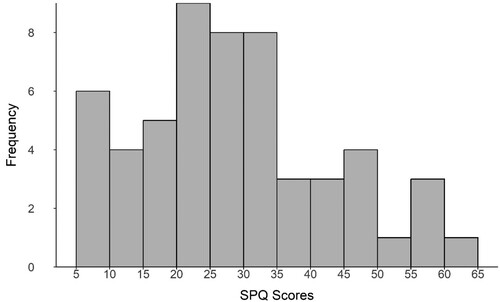
Figure 4. The distribution of perceptual span across participants.
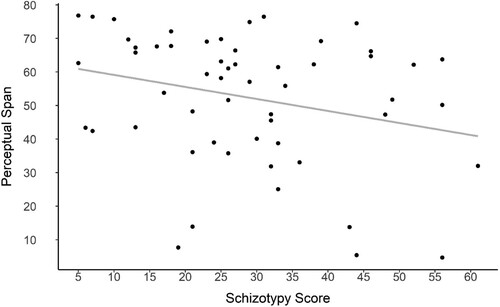
SPQ scores and perceptual span were significantly negatively correlated, (Spearman ρ = −.28, p = .03), such that participants who had higher schizotypy scores had lower perceptual spans. A regression analysis () showed that schizotypy scores significantly predicted perceptual span (β = −0.36, p = 0.048) with schizotypy scores predicting approximately 7% of the variance in perceptual span.
Figure 5. Regression analysis between Schizotypy scores and Perceptual Span.
Note: Perceptual span is expressed in degrees of lateral separation between the stimuli.
As the SPQ is believed to be comprised of three underlying factors (Cognitive/Perceptual deficits, Interpersonal deficits and Disorganisation; Raine et al., Citation1994), we analysed the association between each factor and perceptual span. Cognitive/Perceptual Deficits was a significant predictor of perceptual span (r = −.27, p = 0.049), and Disorganisation was marginally significant (r = −.26, p = 0.58) (). However, it should be noted that there were high intercorrelations between these factors ().
Figure 6. Scatter plot of the relationship between the two Schizotypy factors of cognitive/perceptual deficits and disorganisation.
Note: Scores are indicative of each participant’s Schizotypy score, with the questions separated into the two associated factors.
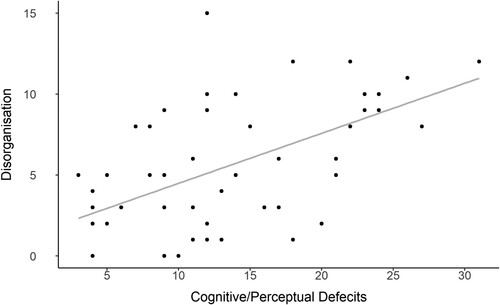
Table 1. Correlations between SPQ factors and perceptual span.
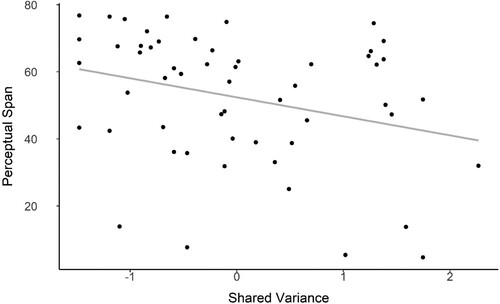
The correlation of Perceptual Span with Cognitive/Perceptual Deficits was similar to that with Disorganisation. This suggested that it was the shared variance between these factors that may have been associated with Perceptual Span. A principal components analysis was conducted to isolate the shared variance between Cognitive/Perceptual Deficits and Disorganisation. The Pearson correlation coefficient between the shared variance and perceptual span was r = −.29, indicating a moderate negative relationship (df = 53, p = .028; ). This shared variance was more predictive than either Cognitive/Perceptual Deficits and Disorganisation individually (r = −.27 and r = −.26, respectively).
Figure 7. Scatter plot showing the shared variance between cognitive/perceptual deficits and disorganisation and perceptual span.
Discussion
The current study investigated the relationship between schizotypy and perceptual span in a non-clinical sample. Given that individuals with schizophrenia exhibit significantly smaller perceptual spans (Strauss et al., Citation1984), we hypothesised that a similar effect may occur within a non-clinical population where individuals with higher schizotypy scores would display significantly smaller perceptual spans than those with lower trait schizotypy. Indeed, we found that individuals with higher schizotypy scores performed significantly worse on our divided-attention task. This is consistent with the literature suggesting that attentional deficits are associated with higher trait schizotypy (Ettinger et al., Citation2015; Lenzenweger et al., Citation1991). Furthermore, we have demonstrated that virtual reality is an effective tool to measure this relationship.
Cognitive/Perceptual Deficits and Disorganisation were the two factors of the SPQ which demonstrated a marginal association with perceptual span. This finding is consistent with that of Stotesbury et al. (Citation2018), who reported that deficits in attention distributed across space, particularly under increasing perceptual load, were significantly associated with the Cognitive/Perceptual factor of the SPQ. This evidence suggests that performance on distributed attention tasks may predominantly be associated with this factor of the three-factor model of schizotypy.
In contrast to our findings of Cognitive/Perceptual Deficits and Disorganisation being predictive of perceptual span, Chen et al. (Citation1997), reported that Interpersonal factors and Disorganisation were the most predictive of attention in their sustained attention task, where stimuli were constrained in space and manipulated temporally. Some of this may be explained by the high shared variance between factors. Nevertheless, this difference could also be attributed to the use of different tasks with distinct demands. Notably, the stimuli used in their study did not vary in space, as only one stimulus was presented at a time within a 2-inch square. This discrepancy suggests that different factors associated with schizotypy may be more predictive of attention distributed across space, compared to attention distributed temporally. This data gives insight into what may be driving the attentional deficits experienced by individuals with schizophrenia, and may also help explain why those with more symptoms of schizophrenia experience smaller perceptual spans (Strauss et al., Citation1984).
Another potential point of divergence is the ability to shift attention. Due to the random movement of the stimuli, it is possible that in some trials participants may have rapidly switched their covert attention between sides. Research indicates that individuals with high schizotypy exhibit increased costs when switching attention across modalities (Wilkins & Venables, Citation1992) or task-relevant features (Breeze et al., Citation2011). Thus, it is conceivable that the factors identified as predictive in our task could be associated with covert attentional shifting, as well as perceptual span. However, little research has been done to explore which of the three factors underlying schizotypy are more predictive of deficits in attentional shifting.
The shared variance between Cognitive/Perceptual Deficits and Disorganisation was more strongly related to task performance than either of these factors alone. This finding aligns with prior research, as these factors have been found to be highly intercorrelated, accounting for a shared variance of approximately fifty percent (Raine et al., Citation1994). Although the broader literature supports the three-factor model of schizotypy (Raine et al., Citation1994; Reynolds et al., Citation2000), the strong association of the shared variance found in our study is consistent with a two-factor model of schizotypy, in which Disorganisation is absorbed into Cognitive/Perceptual Factors (Raine et al., Citation1994). The high intercorrelation between Disorganisation and both Cognitive/Perceptual and Interpersonal factors has been documented in other studies (Grove et al., Citation1991). Indeed, this high shared variance between Disorganisation and other factors has led to speculation that disorganisation may be central to a single underlying trait that accounts for all variability in schizotypy, referred to as the vulnerability dimension (Grove et al., Citation1991; Raine et al., Citation1994).
It is also worth noting that the inclusion of Disorganisation in the factor structure of schizotypy was not justified for statistical reasons, but rather because it was a significant factor in schizophrenia research (Arndt et al., Citation1991; Bilder et al., Citation1985).
The findings from the present study also lend support to the idea that schizophrenia related traits lie on a continuum (Claridge, Citation1997; Owen et al., Citation2016). Trait schizotypy has been documented as a continuum in non-clinical populations when assessing performance on cognitive tasks (Cochrane et al., Citation2012), social anhedonia (Blanchard et al., Citation2011) and severity of symptoms related to schizophrenia (Thomas et al., Citation2019). In these tasks, as schizotypy scores increase, performance on cognitive tasks decreases, and social anhedonia and severity of symptoms increases. Our results lend support to the idea that trait schizotypy is a continuum as perceptual span decreases with increases in schizotypy. This may suggest that variances in trait schizotypy within the general population could be predictive of visual attention span.
Future research should explore whether this effect also persists with other assessments of trait schizotypy such as the Oxford Liverpool Index of Feelings & Experiences (OLIFE; Mason et al., Citation1995), and the Wisconsin Schizotypy Scales (Chapman et al., Citation1995). Both these inventories have underlying factors, some of which differ from those associated with SPQ (Asai et al., Citation2011; Gross et al., Citation2014). Primarily, these scales all have large variations in the factor of Disorganisation (Oezgen & Grant, Citation2018). Exploring how perceptual span relates to the factors in each different schizotypy assessment will provide a better understanding of which factors are associated with distributed visual attention.
Supplemental Material
Download MS Word (334 KB)Acknowledgements
The authors would like to thank Cassandra Hinckley for her support and assistance with this project.
Disclosure statement
No potential conflict of interest was reported by the author(s).
Data availability statement
The data that supports the findings of this study are openly available at the projects OSF page at [https://osf.io/jyhb2].
Additional information
Funding
References
- Arndt, S., Alliger, R. J., & Andreasen, N. C. (1991). The distinction of positive and negative symptoms: The failure of a two-dimensional model. The British Journal of Psychiatry, 158(3), 317–322. https://doi.org/10.1192/bjp.158.3.317
- Asai, T., Sugimori, E., Bando, N., & Tanno, Y. (2011). The hierarchic structure in schizotypy and the five-factor model of personality. Psychiatry Research, 185(1-2), 78–83. https://doi.org/10.1016/j.psychres.2009.07.018
- Bilder, R. M., Mukherjee, S., Rieder, R. O., & Pandurangi, A. K. (1985). Symptomatic and neuropsychological components of defect states. Schizophrenia Bulletin, 11(3), 409–419. https://doi.org/10.1093/schbul/11.3.409
- Blanchard, J. J., Collins, L. M., Aghevli, M., Leung, W. W., & Cohen, A. S. (2011). Social anhedonia and schizotypy in a community sample: the Maryland longitudinal study of schizotypy. Schizophrenia Bulletin, 37(3), 587–602. https://doi.org/10.1093/schbul/sbp107
- Bozikas, V. P., Andreou, C., Giannakou, M., Tonia, T., Anezoulaki, D., Karavatos, A., Fokas, K., & Kosmidis, M. H. (2005). Deficits in sustained attention in schizophrenia but not in bipolar disorder. Schizophrenia Research, 78(2-3), 225–233. https://doi.org/10.1016/j.schres.2005.05.014
- Breeze, J. M., Kirkham, A. J., & Mari-Beffa, P. (2011). Evidence of reduced selective attention in schizotypal personality disorder. Journal of Clinical and Experimental Neuropsychology, 33(7), 776–784. https://doi.org/10.1080/13803395.2011.558495
- Burman, D. D., & Booth, J. R. (2009). Music rehearsal increases the perceptual span for notation. Music Perception, 26(4), 303–320. https://doi.org/10.1525/mp.2009.26.4.303
- Chapman, J. P., Chapman, L. J., & Kwapil, T. R. (1995). Scales for the measurement of schizotypy.
- Chen, W., Hsiao, C. K., & Lin, C. C. (1997). Schizotypy in community samples: the three-factor structure and correlation with sustained attention. Journal of Abnormal Psychology, 106(4), 649–654. https://doi.org/10.1037/0021-843X.106.4.649
- Chen, W. J., & Faraone, S. V. (2000). Sustained attention deficits as markers of genetic susceptibility to schizophrenia. American Journal of Medical Genetics, 97(1), 52–57. https://doi.org/10.1002/(SICI)1096-8628(200021)97:1<52::AID-AJMG7>3.0.CO;2-6
- Claridge, G. S. (1997). Schizotypy: Implications for illness and health. Oxford University Press.
- Cochrane, M., Petch, I., & Pickering, A. D. (2012). Aspects of cognitive functioning in schizotypy and schizophrenia: evidence for a continuum model. Psychiatry Research, 196(2-3), 230–234. https://doi.org/10.1016/j.psychres.2012.02.010
- Ettinger, U., Mohr, C., Gooding, D. C., Cohen, A. S., Rapp, A., Haenschel, C., & Park, S. (2015). Cognition and brain function in schizotypy: a selective review. Schizophrenia Bulletin, 41(2), S417–S426. https://doi.org/10.1093/schbul/sbu190
- Faul, F., Erdfelder, E., Buchner, A., & Lang, A.-G. (2009). Statistical power analyses using G*Power 3.1: Tests for correlation and regression analyses. Behavior Research Methods, 41(4), 1149–1160. https://doi.org/10.3758/BRM.41.4.1149
- Fuermaier, A. B., Piersma, D., Huntjens, R. J., de Waard, D., Westermann, C., Bossert, M., Lange, K. W., Weisbrod, M., Bruggeman, R., Aschenbrenner, S., & Tucha, O. (2019). Simulated car driving and its association with cognitive abilities in patients with schizophrenia. Schizophrenia Research, 204, 171–177. https://doi.org/10.1016/j.schres.2018.09.005
- Fuggetta, G., Bennett, M. A., & Duke, P. A. (2015). An electrophysiological insight into visual attention mechanisms underlying schizotypy. Biological Psychology, 109, 206–221. https://doi.org/10.1016/j.biopsycho.2015.06.007
- Fuller, R. L., Luck, S. J., Braun, E. L., Robinson, B. M., McMahon, R. P., & Gold, J. M. (2006). Impaired control of visual attention in schizophrenia. Journal of Abnormal Psychology, 115(2), 266–275. https://doi.org/10.1037/0021-843X.115.2.266
- García-Montes, J. M., Noguera, C., Álvarez, D., Ruiz, M., & Cimadevilla Redondo, J. M. (2014). High and low schizotypal female subjects do not differ in spatial memory abilities in a virtual reality task. Cognitive Neuropsychiatry, 19(5), 427–438. https://doi.org/10.1080/13546805.2014.896786
- Gold, J. M., Fuller, R. L., Robinson, B. M., Braun, E. L., & Luck, S. J. (2007). Impaired top–down control of visual search in schizophrenia. Schizophrenia Research, 94(1-3), 148–155. https://doi.org/10.1016/j.schres.2007.04.023
- Gray, B. E., Hahn, B., Robinson, B., Harvey, A., Leonard, C. J., Luck, S. J., & Gold, J. M. (2014). Relationships between divided attention and working memory impairment in people with schizophrenia. Schizophrenia Bulletin, 40(6), 1462–1471. https://doi.org/10.1093/schbul/sbu015
- Gross, G. M., Mellin, J., Silvia, P. J., Barrantes-Vidal, N., & Kwapil, T. R. (2014). Comparing the factor structure of the Wisconsin Schizotypy Scales and the Schizotypal Personality Questionnaire. Personality Disorders: Theory, Research, and Treatment, 5(4), 397. https://doi.org/10.1037/per0000090
- Grove, W. M., Lebow, B. S., Clementz, B. A., Cerri, A., Medus, C., & Iacono, W. G. (1991). Familial prevalence and coaggregation of schizotypy indicators: a multitrait family study. Journal of Abnormal Psychology, 100(2), 115–121. https://doi.org/10.1037/0021-843X.100.2.115
- Kaernbach, C. (1991). Simple adaptive testing with the weighted up-down method. Perception & Psychophysics, 49(3), 227–229. https://doi.org/10.3758/BF03214307
- Kurachi, M., Matsui, M., Kiba, K., Suzuki, M., Tsunoda, M., & Yamaguchi, N. (1994). Limited visual search on the WAIS picture completion test in patients with schizophrenia. Schizophrenia Research, 12(1), 75–80. https://doi.org/10.1016/0920-9964(94)90086-8
- Lenzenweger, M. F., Cornblatt, B. A., & Putnick, M. (1991). Schizotypy and sustained attention. Journal of Abnormal Psychology, 100(1), 84–89. https://doi.org/10.1037/0021-843X.100.1.84
- Mason, O., Claridge, G., & Jackson, M. (1995). New scales for the assessment of schizotypy. Personality and Individual Differences, 18(1), 7–13. https://doi.org/10.1016/0191-8869(94)00132-C
- Neale, J. M. (1971). Perceptual span in schizophrenia. Journal of Abnormal Psychology, 77(2), 196. https://doi.org/10.1037/h0030751
- Oezgen, M., & Grant, P. (2018). Odd and disorganized–comparing the factor structure of the three major schizotypy inventories. Psychiatry Research, 267, 289–295.
- Owen, M. J., Sawa, A., & Mortensen, P. B. (2016). Schizophrenia. The Lancet, 388(10039), 86–97. https://doi.org/10.1016/S0140-6736(15)01121-6
- Quijano, S. A. M. A., Ryczek, C. A., & Horne, M. R. (2022). The effect of schizotypy on spatial learning in an environment with a distinctive shape. Frontiers in Psychology, 13, 929653–929653. https://doi.org/10.3389/fpsyg.2022.929653
- Raine, A. (1991). The SPQ: a scale for the assessment of schizotypal personality based on DSM-III-R criteria. Schizophrenia Bulletin, 17(4), 555–564. https://doi.org/10.1093/schbul/17.4.555
- Raine, A., Reynolds, C., Lencz, T., Scerbo, A., Triphon, N., & Kim, D. (1994). Cognitive-perceptual, interpersonal, and disorganized features of schizotypal personality. Schizophrenia Bulletin, 20(1), 191–201. https://doi.org/10.1093/schbul/20.1.191
- Rawlings, D., & Goldberg, M. (2001). Correlating a measure of sustained attention with a multi- dimensional measure of schizotypal traits. Personality and Individual Differences, 31(3), 421–431. https://doi.org/10.1016/S0191-8869(00)00147-1
- Rayner, K. (1975). The perceptual span and peripheral cues in Reading. Cognitive Psychology, 7(1), 65–81. https://doi.org/10.1016/0010-0285(75)90005-5
- Rayner, K., Slattery, T. J., & Bélanger, N. N. (2010). Eye movements, the perceptual span, and Reading speed. Psychonomic Bulletin & Review, 17(6), 834–839. https://doi.org/10.3758/PBR.17.6.834
- Reynolds, C. A., Raine, A., Mellingen, K., Venables, P. H., & Mednick, S. A. (2000). Three-factor model of schizotypal personality: Invariance across culture, gender, religious affiliation, family adversity, and psychopathology. Schizophrenia Bulletin, 26(3), 603–618. https://doi.org/10.1093/oxfordjournals.schbul.a033481
- Rovamo, J., & Virsu, V. (1979). An estimation and application of the human cortical magnification factor. Experimental Brain Research, 37(3), 495–510. https://doi.org/10.1007/BF00236819
- Ryan, A. E. (2020). The interplay of eye movements and attention in a continuous flight related task. Unpublished doctoral dissertation, University of Queensland. UQ eSpace. https://doi.org/10.14264/uql.2020.152.
- Stotesbury, H., Gaigg, S. B., Kirhan, S., & Haenschel, C. (2018). The influence of schizotypal traits on attention under high perceptual load. Schizophrenia Research: Cognition, 11, 6–10. https://doi.org/10.1016/j.scog.2017.10.002
- Strauss, M. E., Bohannon, W. E., Stephens, J. H., & Pauker, N. E. (1984). Perceptual span in schizophrenia and affective disorders. The Journal of Nervous and Mental Disease, 172(7), 431–435. https://doi.org/10.1097/00005053-198407000-00010
- Thomas, E. H., Rossell, S. L., Tan, E. J., Neill, E., Van Rheenen, T. E., Carruthers, S. P., Sumner, P. J., Louise, S., Bozaoglu, K., & Gurvich, C. (2019). Do schizotypy dimensions reflect the symptoms of schizophrenia? Australian & New Zealand Journal of Psychiatry, 53(3), 236–247. https://doi.org/10.1177/0004867418769746
- Whitford, V., O'Driscoll, G. A., Pack, C. C., Joober, R., Malla, A., & Titone, D. (2013). Reading impairments in schizophrenia relate to individual differences in phonological processing and oculomotor control: evidence from a gaze-contingent moving window paradigm. Journal of Experimental Psychology: General, 142(1), 57–75. https://doi.org/10.1037/a0028062
- Wilkins, S., & Venables, P. H. (1992). Disorder of attention in individuals with schizotypal personality. Schizophrenia Bulletin, 18(4), 717–723. https://doi.org/10.1093/schbul/18.4.717