
ABSTRACT
Studies on university campuses public spaces have recognized that there is a significant relationship between the built environment and people’s perceptions of creativity. There is, however, little empirical evidence to support this claim. This research quantifies and measures this relationship, defined as ‘spatial affordances for creativity’, using two types of Dutch university campuses as case studies: inner-city campuses and science parks (SPs). This study found statistical associations that locations of built environment features influenced creativity between people. Moreover, spatial affordances for creativity must be considered in the planning and design of campuses, as a suite of spatial and perceptual conditions.
Introduction
Public spaces of university campuses are knowledge and creative hubs, and enablers of interactions, knowledge sharing, and a sense of place and community (Brown and Perkins Citation1992; Williams and Patterson Citation2008; Atkinson, Fuller, and Painter Citation2012). They are meeting points and catalysts that bring people, ideas, and resources together before a creative process can occur (Sternberg and Lubart Citation1991; Meusburger Citation2009). In recent years, there has been increasing scientific interest from an urban design and planning perspective in how the characteristics of the physical environment of public spaces play a role in creativity (Meusburger Citation2009, Citation2018; Stevens Citation2015; Wood and Dovey Citation2015). Such characteristics, (urban functions and physical features) have been proven to contribute to a strong sense of place and have been associated with improved trust, and consequently the exchange of information between people (Dolan and Metcalfe Citation2012; Rantisi, Leslie, and Christopherson Citation2006). The relationship between the physical environment and the actions, reactions, and creative expressions that it causes in people is conceptualized as the ‘spatial affordances for creativity’.
Spatial affordances for creativity is defined as the ‘ability to engage in creative work depending on the affordances of the spatial layout’ (Sailer Citation2011, 9). Creativity is ‘the production, conceptualization, or development of novel, original and useful ideas, processes, or procedures by an individual or by a group’ (Shalley, Gilson, and Blum Citation2000, 215). Creative ideas emerge and develop in complex, dynamic interaction between a human (the creator) and his or her environment (Amabile Citation1983; Amabile et al. Citation1996; Csikszentmihalyi Citation2014; Meusburger Citation2009, Citation2018). The concept of spatial affordances for creativity is aligned with Gibson (Citation1979) theory of affordances, defined as the relationships between the abilities of organisms (humans) and features of the environment (Gibson Citation1979; Chemero Citation2003).
In the context of university campuses, the meaning of spatial affordances for creativity refers to what the built environment has to ‘offer’ concerning a (creative) individual and how it guides, facilitates, and also constrains creativity or creative encounters on campus (Glǎveanu Citation2012). Therefore, in practical terms, the added value of studying spatial affordances for creativity of campuses' public spaces enables the understanding of how the built environment enhances or hinders, among others, campuses’ teaching activities, researching, learning, peoples’ development of abilities and ideas, cross-disciplinary discussions, interactions between knowledgeable agents, and the possibilities of identifying and solving problems (Meusburger Citation2009, Citation2018). In other words, creativity on campuses is the result of systematic interdependencies between the physical environment and social interactions in which people share knowledge and exchange ideas (Soares, Weitkamp, and Yamu 2020).
Several urban design studies have used the concept of affordances to empirically investigate relationships between humans and locational relations with the built environment. Wood and Dovey (Citation2015), for instance, found that a mix of urban functions facilitates symbiotic relationships between different creative activities, which is further connected to the diversity of users’ locational preferences. Studies of socio-spatial post-occupancy evaluation of public spaces (Hadavi, Kaplan, and Hunter Citation2015; Kim Citation2019; Simões Aelbrecht Citation2019) have indicated that the location of small physical features, such as sitting opportunities and natural features, are key mediators in enabling multiple user activities and interactions. This is not only with their physical aspects but also with their locational relations. In other words, interactions in public spaces are afforded by and dependent on the location of built environment features. Scott Shafer et al. (Citation2013) suggest that short distances between residents and stream corridors, the availability of pedestrian access, and tree cover were the best predictors to afford participation in recreational activities. Furthermore, Kyttä, Kahila, and Broberg (Citation2011) and Samuelsson et al. (Citation2018) found positive associations between perceived ‘quality factors’ and distances to the urban characteristics of people’s home zones.
A common aspect found in those studies was that for an environment to be preferred over others it must afford the functions and physical features that are perceived as important and meaningful to individuals. It was thus evident that the arrangement and design of built environment features could influence people’s behaviour and enable certain kinds of actions in public spaces. Although campuses’ built environment features are known to enhance or hinder certain behaviours including people’s interactions (Strange, Banning, and Delworth Citation2001; Strange and Banning Citation2015; Dober Citation1992; Wohl Citation2016), empirical research that addresses spatial affordances for creativity for university campuses and their public spaces has yet to be conducted.
To understand spatial affordances for creativity concept, it is fundamental to understand perceptions since affordances refer to the interrelated qualities of built environments and the action-oriented aspects of human perceptions (Meusburger Citation2009; Sailer Citation2011; Glǎveanu Citation2012; Soares, Weitkamp, and Yamu Citation2020). Perception is a direct sensory experience and involves the individual in a specific environment (Rapoport Citation1977). People’s perceptions, behaviour, and actions are intrinsically interlinked (Heft Citation2010). Such actions at campuses’ public spaces are actualized affordances and at the same time, a subset of perceived opportunities (coined as ‘perceived affordances’; Ghavampour, Del Aguila, and Vale Citation2017). Perceived affordances can guide humans’ actions, sometimes over considerable distances (Gibson Citation1979). Spatial affordances for creativity of campuses and their public spaces are herein determined and measured by the relationship between perceived affordances (through knowledge sharing and the exchange of ideas) and the influence of the locations of built environment features.
This case-study research explored inner-city campuses and science parks (SPs) located in the cities of Amsterdam, Utrecht, and Groningen. The reason behind selecting these cases is based on the following hypotheses: the locations of built environment features play a role in creative encounters in public spaces and that the public spaces of inner-city campuses have a higher potential to afford creative encounters compared to SPs. SPs were implemented at the cities’ peripheries, designed as a car-based, orthogonal grid of roads with large lots. This composition reduced the diversity of ownership, occupancy and function, and was frequently associated with monotonous streetscapes, minimal street-life, and fragmented environments (Wood and Dovey Citation2015; Magdaniel Citation2016; Cannas da Silva and Heitor Citation2017). This composition is different to inner-city campuses, which were composed of organically-grown small lots (Bott Citation2018). University buildings are located within short distances to a land-use mix, keeping life close to the street where students and university employees can easily interact with tourists, day-trippers, workers, and residents.
To overcome the aforementioned limitations of previous researches, this study aims to empirically investigate ‘spatial affordances for creativity’ of university campuses’ public spaces by understanding the relationship between users’ perceived creativity (through knowledge sharing and exchange of ideas) and the locations of built environment features. Therefore, it answers the following research questions: (i) which characteristics of the physical environment play a role in the frequency of creative encounters through knowledge sharing and the exchange of ideas? Additionally, this research explores (ii) to what extent campuses differ in terms of the relationship between the built environment and creative encounters? To answer the research questions, the relationships between the frequency of perceived creativity (through knowledge sharing and the exchange of ideas) and distances to urban functions and physical features were computed. Thus, this study further explores differences and similarities between two campus types: inner-city campuses and SPs.
The novelty of this research lies in the evidence found through statistical associations of the relationships between perceived creativity and the locations of built environment features. The statistical approach adds value to this study since it provides evidence for the assessment and interpretation of the aforementioned relationship. Such associations can be used as a strategic tool for solving campuses’ public space problems and for raising awareness of the importance of their quality, revealing the role of built environment features in perceived affordances for creativity. The evidence thus enables practitioners to gain a deeper understanding of spatial and perceptual aspects of creativity in public spaces, providing knowledge transfer between research and practice. It could, therefore, be applicable to early campus decision-making and urban design.
Methodology
Study areas
The cities of Amsterdam, Utrecht, and Groningen are located in the Netherlands and have two campus types that are the subject of this research: inner-city campuses and SPs (Cannas da Silva and Heitor Citation2017; den Heijer and Magdaniel Citation2018) (). In the context of the Netherlands, a ‘campus’ includes all buildings and sites that pass through the university or for university-related functions, are used, rented or owned by the university, and are not necessarily in one location. A campus can be a collection of buildings in an isolated area or the buildings can be scattered throughout the main city centre (den Heijer et al. Citation2016). Normally, inner-city campuses evolved with the historic city centre and postwar SPs were implemented in isolated areas on the city peripheries.
Figure 1. Location of cities and campuses: (a) Amsterdam, Utrecht, and Groningen; (b) location of inner-city campuses and SPs in each city.
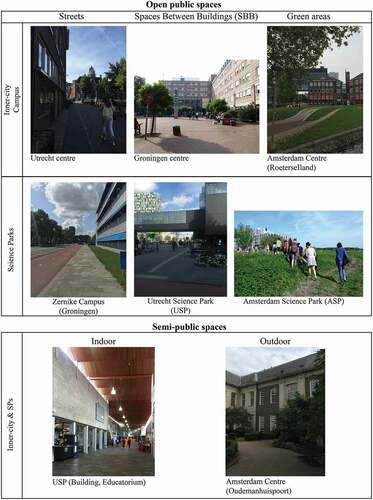
Public spaces of inner-city campuses and SPs have their specific characteristics and two main typologies: open spaces and semi-public spaces. The public spaces of inner-city campuses are predominantly roads and sidewalks. Semi-public spaces thereof are enclosed gardens and patios with limited access. At inner-city campuses, building façades commonly face public urban squares, which have a strong relationship with the streets of the old city centre (Bott Citation2018), surrounded by high-density buildings and streets (Carr et al. Citation1993). SPs are known to have extensive availability of land and a broad offer of footpaths, passages, terraces, yards, backyards, plazas, and semi-public passages. However, their public spaces are often spatially and socially disconnected from their immediate context, as are their buildings (Turner Citation1986; Coulson, Roberts, and Taylor Citation2017; Hajrasouliha Citation2017) since their design and implementation often happen at different times. summarizes examples of open and semi-public spaces of inner-city campuses and SPs, based on studies conducted by Carr et al. (Citation1993), Van Melik (Citation2008), Carmona (Citation2010), Lee (Citation2013), and Soares, Weitkamp, and Yamu (Citation2020).
Figure 2. Visualization of public spaces typologies.
Data collection
Volunteered Geographic Information (VGI)
Data were collected using VGI, a type of Public Participatory GIS (PPGIS) that combines internet maps with traditional questionnaires (Brown and Kyttä Citation2014). With PPGIS, perceptual affordances can be collected by the researcher, while citizens act as active sensors within an environment (Goodchild Citation2007). Perceptual data were collected through the web platform Maptionnaire (maptionnaire.com) to understand how people perceive the built environment and to identify public spaces that afford creativity.
In total, responses from 418 people were collected in September and October 2019, generating 744 polygon responses (). Data were collected from students, university employees, companies’ employees, and campus visitors. For this research, ‘creativity’ or ‘creative encounters’ were represented by the act of sharing knowledge and the exchange of ideas with others. Participants were approached on-site by the researchers to answer the questionnaire and were asked to draw polygons on the campus map to indicate on the campus map indoor and/or outdoor public space(s) where they have shared knowledge or exchanged ideas with people in the past year. The participants who could not respond to the questionnaire on the spot were contacted by the researchers to answer it on their own at a later time.
Table 1. Number of VGI responses and frequency of creative encounters per campus
For the data preparation, the collected polygon data were aggregated into 100 × 100 m grid-cells, an approach similar to Curtis et al. (Citation2014) and Soares, Weitkamp, and Yamu (Citation2020) resulting in 1132 cells. The grid-cell size corresponded to the scale of the campuses’ public spaces and buildings. For the perimeter of the study areas, institutional boundaries were used for SPs, and for inner-city campuses, the limits were set following an 800 m distance buffer, representing a 10-minute walk from university buildings. After the aggregation, the value of the sum of creative encounters was added to each cell. Therefore, the 100 × 100 m grid-cells were intersected with the VGI data (polygons) in ArcGIS, which resulted in a new attribute representing the number of encounters in each grid-cell. The number of encounters was calculated by the count of all polygons that intersect with each cell. This count value was the dependent variable of this research. Moreover, the cells with value zero were removed from the data set since they represented spaces where no creative encounter occurred.
Location of built environment features
Studies on architecture, urban design, campus design and planning such as ‘flexible spaces’ (Whyte Citation1980), 'life between buildings' (Gehl Citation2011; Gehl and Svarre Citation2013), ‘physical features’ and ‘urban design qualities’ (Ewing and Clemente Citation2013; Ewing et al. Citation2016), ‘landscape taxonomy’ (Dober Citation1992; Mehta Citation2019), and ‘post-occupancy evaluation (POE) for outdoor spaces’ (Göçer et al. Citation2018) have shown that the location of built environment features can structurally and aesthetically support peoples’ behaviour and perceptions in public spaces. For this research, the relational pair of the built environment and perceived affordances of creativity at campuses was based on campus design literature (Dober Citation1992, Citation2014; Strange et al., Citation2001; Strange and Banning Citation2015; Kenney et al., Citation2005; Hajrasouliha Citation2017; Lau and Yang Citation2009; Zeng et al. Citation2020).
Campus design literature explores a broad range of built environment features that can affect peoples’ interactions on campus, including aesthetics, land-uses, functions, shapes, materials, colours, or height. For this research, the variables urban functions and physical features were chosen to be translated into data and to be tested as explanatory variables. The choice relates to the fact that to stimulate encounters, urban functions ought to be arranged in such a way that different academic activities, knowledge-based institutions, research, open and semi-public spaces, residences, green areas, and sports facilities are mixed throughout the area. Thus, they should promote cohesion with campuses’ physical features (or micro-features of the public space layout), such as paved surfaces, shared spaces, sitting opportunities, trees, water features, shade and shelter, cafés, or dining halls. The variables representing the built environment were conceptualized as follows:
Campus buildings. Elements that can afford various uses, such as residence halls, sports centre, libraries, private knowledge-based companies, student unions, and indoor semi-private public spaces. Close relationships and short travel times between institutions located on the campus are key for the affordance of cross-disciplinary collaboration, interactions, reinforcing a sense of place, and institutional identity (Dober Citation1992, Citation2014; Kenney, Dumont, and Kenney Citation2005; Strange and Banning Citation2015).
Restaurants, cafés, and canteens. These are informal settings that afford opportunities for interaction through eating, having a coffee or a drink, beyond the realms of home and work (Oldenburg Citation2007; Mehta Citation2014). These places, also called ‘third places’, facilitate informal community-gathering, a sense of place on campus, and consequently communication between people from multiple backgrounds.
Streets and sidewalks. For inner-city campuses, streets are commonly narrow and do not have a strong physical differentiation between car roads and sidewalks. In Dutch city centres, there is limited circulation of cars, therefore people walk freely (Carr et al. Citation1993). At SPs, the composition of the streets follows a masterplan with an orthogonal grid of roads. There is an orthodox separation between spaces for cars and spaces for people (Magdaniel Citation2016).
Spaces between buildings. Examples of space between buildings at both inner-city campuses and SPs are footpaths, passages, terraces, yards, backyards, plazas, and semi-public passages (Carr et al. Citation1993). They can be open public spaces and semi-public spaces. Open public spaces are those that everyone can access and semi-public spaces are those to which access is limited by doors or gates (Lee Citation2013).
Green areas. Green areas, such as neighbourhood parks (NP), community gardens (CG) and areas with grass, afford opportunities for recreation and relaxation, promoting physical and mental health benefits (Lau and Yang Citation2009; Zeng et al. Citation2020). NPs can be accessed from inner-city campuses at walking or cycling distance. They are defined as ‘publicly developed and managed open spaces’ (Carr et al. Citation1993, 79). In SPs, the common green areas are NPs and CGs. CGs are spaces designed, developed, or managed by residents.
Sitting opportunities. This is an important aspect of successful public spaces. Particularly important features of comfortable sitting areas include orientation, good accessibility, movable seating, seating for individuals and groups, and seating that enables reading, eating, talking, resting, and privacy (Carr et al. Citation1993; Hadavi, Kaplan, and Hunter Citation2015; Kim Citation2019; Simões Aelbrecht Citation2019).
Water features. These are places where people feel attracted, are recreational facilities, and places for comfortable resting. Interaction with others while having contact with natural features can influence creativity in a relaxed manner (Carr et al. Citation1993; Lau and Yang Citation2009).
Vegetation. These are street trees, shades, and shelter that are highly valued parts of campuses. These elements soften the quality of the spaces, attract the passer-by, and are important for their restorative qualities. Areas with vegetation can be used for meetings, studying, or simply relaxing (Dober Citation1992).
Six dummy variables, representing the grid-cells of the six campuses were added as explanatory variables. With this strategy, it was possible to control aspects specific to those campuses that could not be measured or foreseen.
categorizes the geospatial secondary data (representing built environment features) used in this research, which were gathered from: (1) the Dutch national and open geodatabase, the Basisregistratie Grootschalige Topografie (BGT); (2) Dutch national and open geodatabase of topographic layers (Top10.NL); (3) Open Street Map (OSM); and (4) Open access geodata of Amsterdam (https://maps.amsterdam.nl/open_geodata/). These datasets contained, among others, shape-files of buildings, roads, watercourses, open and semi-public public spaces, railway lines, trees, and street furniture.
Table 2. Explanatory variables
The distances between the locations of urban functions and physical features at campuses are a major determinant of peoples’ perceived affordances in public spaces. Studies have shown that such linear distances have to be ‘short enough’ so that human figures become individuals and that it is possible to notice the person’s sex, approximate age and activities (Gehl Citation2011); this can consequently enhance close neighbourly interactions (Canter Citation1977; Talen and Shah Citation2007; Stojanovski Citation2020). Gehl and Svarre (Citation2013) state that human sight allows the detection of peoples’ movement at a distance of 100 meters; however, to interact socially and determine details much shorter distances are needed. Giles-Corti et al. (Citation2005) additionally explain that although the use of public spaces is inversely related to distance, the impact of distance also depends on the points of interest and attractions, such as the location of urban functions and physical features.
In line with the aforementioned researches, Talen (Citation2011) suggests that the best approach to measure distance in urban design is to select a set of features or places that are important to have access to and then evaluate the distances to them. Therefore, for this research ArcGIS software was used to calculate the linear distance in meters between every 100x100m grid-cells, which represented the frequency of creative encounters, to a set of built environment features (described in ). Furthermore, the statistical relationships between the frequency of creativity and distances to built environment features were calculated similarly to other PPGIS studies, such as Kyttä et al. (Citation2011) and Samuelsson et al. (Citation2018).
Statistical analysis
For this research, the explanatory variables were the distances to the location of built environment features and the dependent variable was the frequency of responses within 100x100m grid-cells, which represented creativity at indoor and outdoor public spaces. For the dependent variable, many cells in the study had zero or low frequency of creative encounters, a few cells had high frequency, and no cell had negative counts.
Two regression methods, Poisson and negative binomial, are applicable when the dependent variable is a count, that is when there are non-negative integer values with many small values and a few large ones (Ameli et al. Citation2015; Marshall and Garrick Citation2011; Dumbaugh and Rae Citation2009). The dependent variable of this research was over-dispersed, meaning that the variance was greater than the mean. The indicators of over-dispersion were the Pearson and chi-square (x2) statistics divided by the degrees of freedom (d. f.), so-called dispersion statistics. If these statistics are greater than 1.0, a model is said to be over-dispersed (Hilbe Citation2011). By these measures, there was an over-dispersion of the frequency of creative encounters; therefore, a negative binomial model was more appropriate than the Poisson model. Generalized Linear Negative Binomial Regression models with log link were calculated using IBM SPSS 25.0 to understand the extent to which the built environment features could predict the frequency of creative encounters at campuses public spaces and the differences and similarities between campuses typologies (inner-city campuses and SPs). Multi-collinearity tests were conducted by calculating the variance inflation factor (VIF) of each explanatory variable. The VIF values of the explanatory variables were smaller than 10, thus could be included in the regression analysis (Guisan and Zimmermann Citation2000).
Results
This section presents the visualization of the frequencies of creative encounters in each case study area and three negative binomial models used to estimate the relationship between the frequency of creativity and characteristics of the built environment. The models comprised distance to the eight built environment features (see ) and the location-specific dummies. In the first model (), observations on all six case study areas were pooled. Next, in the comparative models (), the dataset was split between inner-city campuses and SPs to explore to what extent campuses typologies had an impact for the spatial affordances for creativity. For these models, city-level dummies were applied.
Table 3. Generalized negative binomial linear model
Table 4. Generalized negative binomial linear models: Comparison between inner-city campuses and SPs
Frequency of creative encounters
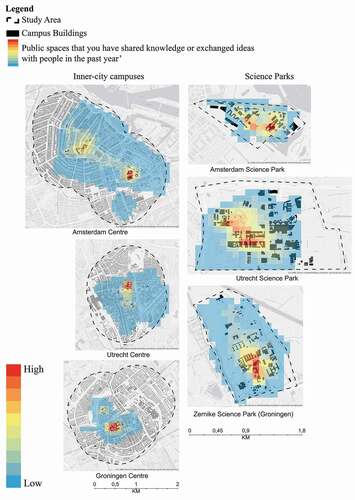
As part of the data preparation and analysis, the ArcGIS ‘spatial join’ operation resulted in the following dependent variable: frequency of creative encounters (through knowledge sharing and the exchange of ideas). The histograms () show that the majority of locations had low-frequency values, especially for inner-city campuses and that in both typologies, high creativity was concentrated in a few locations. In other words, at inner-city campuses, encounters were absent outside the ‘hotspot’ cells, and in SPs, creative encounters were spread throughout the campuses. presents the visualization of frequencies across the campuses. The degree of variability of the mapped frequency across the study areas reflects the campuses’ different spatial sizes and contexts. The results showed that at SPs the ‘hotspots’ of creativity were distributed throughout the campuses. At inner-city campuses, however, high values were concentrated around one or two grid-cells.
Figure 3. Frequency of responses per 100x100m grid-cell: (a) total dataset; (b) Inner-city; (c) SPs.
Figure 4. Mapped frequency of creative encounters per campus, aggregated to 100 × 100 grid-cells.
Pooled model
To understand which characteristics of the physical environment played a role in the frequency of creative encounters through knowledge sharing and the exchange of ideas, a (pooled) Generalized Negative Binomial Model was calculated, comprising the whole dataset (N = 1132). presents the model results, showing the regression coefficients and significance.
No evidence was found that the variables ‘DIST_StreetsSidewalks’ and ‘DIST_Green’ played a role in the frequency of creative encounters. Even though everyone needs a physical way (streets and sidewalks) to move from A to B or to stand and interact with others, this variable presented no significance. Additionally, green areas such as parks, CGs, and areas with grass were not predictive of creative encounters, compared to the other features.
The model also showed that with increasing distance to campus buildings, restaurants, cafés, canteens, spaces between buildings, tables, and benches, creative encounters became less likely. The variable ‘DIST_Buildings’ was by far the most important predictor, followed by ‘DIST_RestCafeCanteen’. The variables ‘DIST_Water’ and ‘DIST_Vegetation’ were both significant; however, their positive coefficients showed that being close to them does not improve possibilities for creative encounters. Relative to Groningen city centre, the other locations generated more creative encounters.
Comparative models
To understand to what extent SP and inner-city campuses differ in their relationship between the built environment and creative encounters, two negative binomial regression models were used to compare inner-city campuses (N = 711) with SPs (N = 421). For these models, dummies representing the location of the cities of Amsterdam, Utrecht, and Groningen were added as control variables ().
For both, inner-city campus and SPs, the variables ‘DIST_StreetsSidewalks’, ‘DIST_Green’, and ‘DIST_Water’ showed no significance and therefore did not play a role in creative encounters in neither typology. For both campuses, ‘DIST_RestCafeCanteen’ and ‘DIST_SBB’ were significant predictors for the frequency of creative encounters. The variable ‘DIST_RestCafeCanteen’ had the highest explanatory power for inner-city campuses. The variable ‘DIST_Vegetation’ was significant for both typologies; however, in SPs, the positive coefficient indicated that being close to vegetation did not affect creative encounters.
For inner-city campuses, ‘DIST_Buildings’ was the most important predictor, meaning that the effects of buildings on the frequency of creative encounters increased with proximity. However, for SPs, being close to buildings did not play a role in the frequency of creative encounters. Additionally, for inner-city campuses, sitting opportunities (DIST_TablesBenches) presented no significant relationship with the frequency of creative encounter. Nevertheless, for SPs, the easy access to places to sit (to eat, to meet or to communicate) increased the possibilities for creative encounters.
Discussion and conclusion
This research empirically investigated ‘spatial affordances for creativity’ in university campuses and their public spaces. This case study research explored the inner-city campuses and SPs of Amsterdam, Utrecht, and Groningen to test the extent to which the locations of a mix of urban functions and physical features found in earlier research (Dober Citation1992, Citation2014; Strange, Banning, and Delworth Citation2001; Strange and Banning Citation2015; Kenney, Dumont, and Kenney Citation2005; Hajrasouliha Citation2017; Wood and Dovey Citation2015; Lau and Yang Citation2009; Zeng et al. Citation2020) are related to the perceived frequency of creative encounters. The results indicated that the locations of built environment features played a role in how they guide, facilitate, and also constrain creative encounters at campuses. Most of the variables tested in this research that represent the built environment had the expected relationship with creativity; however, two variables, namely ‘DIST_StreetsSidewalks’ and ‘DIST_Green’, despite being strongly associated in the literature, presented no significance in all statistical models.
The relationship between the perceived creativity and locations of built environment features were calculated using a statistical pooled model and two comparative models. The models were composed by the relationship between frequency of creative encounters (dependent variable), the explanatory variables, which were distances to eight built environment features (campus buildings, restaurants, cafés and canteens, streets and sidewalks, spaces between buildings, green areas, sitting opportunities, water features, and vegetation), and location-specific dummies. The comparative models tested the differences and similarities between bottom-up inner-city campuses and top-down modernistic SPs. The explanatory variables were generalized for both types of campuses, in line with the literature review.
Regarding the first research question, it is interesting to note that the pooled model, which included distances to the locations of built environment features together with the six campuses as dummy variables, worked well as a group, improving the fit of the model. This suggests value in seeing the spatial affordances for creativity not in isolation but rather as a suite of conditions. With regard to the second research question, the results of the comparative models contradict the research hypothesis, which suggested that the public spaces of inner-city campuses have a higher potential to afford creative encounters compared to SPs. Instead, the comparative analysis confirmed to a high extent that some of the explanatory variables matter differently depending on the campus type.
The results showed that the variable ‘DIST_Buildings’ had the highest explanatory power (Wald-chi square) in the pooled model, which was consistent with the literature that creative encounters in the campus environment were reinforced by the appropriate closeness of buildings and juxtaposition of activities that complement one another (Dober Citation1992, Citation2014). However, ‘DIST_Buildings’ was not a significant predictor for SPs on the comparative models (). This result contradicted Dober’s studies, which proved that campus typology ought to be taken into account for campus planning and design. This outcome was particularly interesting when compared to the mapped frequency of creative encounters (). At inner-city campuses, creativity was localized in one or two spots, and somewhat dependent on university buildings. This was different for SPs as there was a greater variety of creative encounters throughout the campuses, proving that creativity did not necessarily depend on buildings. Such variation is thus visible in the frequency table (see ).
The variable ‘DIST_RestCafeCanteen’ was significant in all models. Interestingly, in the comparative models, this variable presented the highest explanatory power for SPs, supporting the findings of Oldenburg (Citation2007) and Mehta (Citation2014). The presence of ‘third places’, such as cafés, restaurants, and canteens, have the power of facilitating a sense of community-gathering on campus and consequently communication between people from multiple backgrounds. The variable ‘spaces between buildings’ (‘DIST_SBB’) was significant and had a negative coefficient in all three models. It is worth noting that in the comparative model, this variable presented higher significance for inner-city campuses compared to SPs. Even though SPs had a (visually) higher abundance of public spaces or even left-over spaces between buildings (), inner-city campuses presented a stronger relationship with the frequency of creative encounters.
Additionally, despite being strongly associated in the literature (Carr et al. Citation1993; Lau and Yang Citation2009; Zeng et al. Citation2020), the variables representing natural features (‘DIST_Green’, ‘DIST_Vegetation’ and ‘DIST_Water’) either presented no significance or were significant with positive coefficients in the models. This meant that even though such natural features could be significant for creativity, in the cases of Dutch inner-city campuses and science parks, their presence did not necessarily play a role in the number of creative encounters.
This study presents advantages and limitations regarding the procedures of data collection, data preparation and analysis. Firstly, it adhered to a well-defined and reliable standardized methodology for collecting and analysing data that were described in adequate detail to provide a model for future research. Secondly, although mapping perceptions with polygons has its advantages, such as that the participants were able to precisely locate and draw where creativity occurred on campuses to represent their experiences and mental maps, the ArcGIS ‘spatial join’ intersection strategy also had disadvantages. For instance, the polygons mapped by respondents differed in size, shape, and overlapped with each other and if a polygon was drawn in an area that was larger than a 100x100m cell, it was computed as a value in more than one cell. Therefore, the intersection strategy is at risk of redundancy and repetition of the data. Thirdly, the data were collected only in delimited university campus areas. As a result, it was not possible to visualize the other knowledge hotspots and their spatial distribution throughout the cities. Lastly, although the statistical pooled model worked well as a group, it generalized the campuses without considering their typologies and other contextual characteristics.
The added value of this research relates to the empirical findings, which have significant practical implications. This study identified areas with high and low frequencies of perceived creativity and, through statistical associations, explored how those mapped locations relate to the built environment features at inner-city campuses and SPs. The obtained results provide insights for urban designers, planners and policymakers as they can depart from evidence-based information to plan, design and re-develop successful campuses' public spaces that can bring people, ideas and resources together to promote creative encounters. The statistical approach can potentially aid in urban analyses striving to objectively pinpoint specific areas on campuses that can subsequently be correlated with increased opportunities for creativity. The practical implications of the empirical findings are in line with the concept of ‘spatial affordances for creativity’, showing that creativity or creative ideas depend not only on the interactions between people, but can also be enhanced or hindered by their contextual built environment (Amabile Citation1983; Amabile et al. Citation1996; Sternberg and Lubart Citation1991; Csikszentmihalyi Citation2014; Meusburger Citation2009, Citation2018).
Future research should be undertaken to expand the empirical investigation of the ‘spatial affordances for creativity’ narrative. This would allow the possibility of exploring whether the methodological procedures used in this research are generalizable for other knowledge spill-overs, with varying environmental patterns; for instance, to investigate larger sample sizes and broader territory of the cities, such as the metropolitan scale. Additionally, future research could thus include in the statistical model variables that represent physical and sensorial aspects of the built environment. Characteristics such as ‘density’, ‘diversity’, and ‘design’ (Ewing and Cervero Citation2010; Ewing et al. Citation2011), urban design qualities such as ‘imageability’, ‘enclosure’, ‘transparency’, and ‘human scale’ (Ewing and Clemente Citation2013; Ameli et al. Citation2015), or even spatial characteristics, such as shapes, materials, colours, or height (Gehl and Svarre Citation2013) could be further added to the models. Also, environmental conditions such as weather, temperature, shade or wind can affect sensory and bodily experiences (Lenzholzer and van der Wulp Citation2010; Simões Aelbrecht Citation2019) and consequently encounters and interactions in public spaces. Such variables could provide strength to the models and may highlight nuances between inner-city campuses and SPs.
In conclusion, this research adds to the understanding of spatial affordances for creativity in university campuses and their public spaces. Using rigorous data-gathering and statistical analysis methodology, it was concluded that the explanatory power of location of urban functions and physical features varies depending on the campus typology. It thus provides insights for urban designers and planners who may apply the results of this study to design university campuses that promote and contemplate creativity and creative encounters across open and semi-public spaces. This research suggests that the maximization of creative encounters in university campuses and their public spaces depends not only on providing easy access to urban functions and physical features, but also suggests that fully developed, high-quality, and meaningful place-making depends on the acknowledgement, investigation, and measurement of people’s perceptual affordances and experiences.
Disclosure statement
No potential conflict of interest was reported by the author(s).
References
- Amabile, T. M. 1983. “The Social Psychology of Creativity: A Componential Conceptualization.” Journal of Personality and Social Psychology 45 (2): 357–376. doi:https://doi.org/10.1037/0022-3514.45.2.357.
- Amabile, T. M., R. Conti, H. Coon, J. Lazenby, and M. Herron. 1996. “Assessing the Work Environment for Creativity.” Academy of Management Journal 39 (5): 1154–1184. doi:https://doi.org/10.2307/256995.
- Ameli, S. H., S. Hamidi, A. Garfinkel-Castro, and R. Ewing. 2015. “Do Better Urban Design Qualities Lead to More Walking in Salt Lake City, Utah?” Journal of Urban Design 20 (3): 393–410. doi:https://doi.org/10.1080/13574809.2015.1041894.
- Atkinson, S., S. Fuller, and J. Painter. 2012. “Wellbeing and Place.” In Wellbeing and Place, 1–14. doi:https://doi.org/10.1080/02673037.2014.891363.
- Bott, H. 2018. “City and University—An Architect’s Notes on an Intriguing Spatial Relationship.” In, 375–437. doi:https://doi.org/10.1007/978-3-319-75593-9_12.
- Brown, B. B., and D. D. Perkins. 1992. “Disruptions in Place Attachment.” In Place Attachment, 279–304. doi:https://doi.org/10.1007/978-1-4684-8753-4_13.
- Brown, G., and M. Kyttä. 2014. “Key Issues and Research Priorities for Public Participation GIS (PPGIS): A Synthesis Based on Empirical Research.” Applied Geography 46: 122–136. doi:https://doi.org/10.1016/j.apgeog.2013.11.004.
- Cannas da Silva, L., and T. V. Heitor. 2017. “Campuses as Sustainable Urban Engines ‘A Morphological Approach to Campus Social Sustainability’.” In World Sustainability Series, 259–276. doi:https://doi.org/10.1007/978-3-319-47889-0_19.
- Canter, D. 1977. The Psychology of Place. St Martin’s Press.
- Carmona, M. 2010. “Contemporary Public Space, Part Two: Classification.” Journal of Urban Design 15 (2): 157–173. doi:https://doi.org/10.1080/13574801003638111.
- Carr, S., M. Francis, L. G. Rivlin, and A. M. Stone. 1993. “Public Space.” Public Space. doi:https://doi.org/10.4324/9781315794808-4.
- Chemero, A. 2003. “An Outline of a Theory of Affordances.” Ecological Psychology 15: 181–195. doi:https://doi.org/10.1207/S15326969ECO1502_5.
- Coulson, J., P. Roberts, and I. Taylor. 2017. University Trends. Routledge. doi:https://doi.org/10.4324/9781315213606.
- Csikszentmihalyi, M. 2014. “Society, Culture, and Person: A Systems View of Creativity.” In The Systems Model of Creativity, 47–61. doi:https://doi.org/10.1007/978-94-017-9085-7_4.
- Curtis, J. W., E. Shiau, B. Lowery, D. Sloane, K. Hennigan, and A. Curtis. 2014. “The Prospects and Problems of Integrating Sketch Maps with Geographic Information Systems to Understand Environmental Perception: A Case Study of Mapping Youth Fear in Los Angeles Gang Neighborhoods.” Environment and Planning B: Planning and Design 41 (2): 251–271. doi:https://doi.org/10.1068/b38151.
- den Heijer, A. C., and F. T. J. C. Magdaniel. 2018. “Campus–City Relations: Past, Present, and Future.” In, 439–459. doi:https://doi.org/10.1007/978-3-319-75593-9_13.
- den Heijer, A. C., M. H. Arkesteijn, P. de Jong, and E. de Bruyne. 2016. “Campus NL: Investeren in De Toekomst.”
- Dober, R. P. 1992. Campus Design. New York, NY: J. Wiley.
- Dober, R. P. 2014. Campus Landscape: Functions, Forms, Features. New York: John Wiley & Sons.
- Dolan, P., and R. Metcalfe. 2012. “The Relationship between Innovation and Subjective Wellbeing.” Research Policy 41 (8): 1489–1498. doi:https://doi.org/10.1016/j.respol.2012.04.001.
- Dumbaugh, E., and R. Rae. 2009. “Safe Urban Form: Revisiting the Relationship between Community Design and Traffic Safety.” Journal of the American Planning Association 75: 309–329. doi:https://doi.org/10.1080/01944360902950349.
- Ewing, R., A. Hajrasouliha, K. M. Neckerman, M. Purciel-Hill, and W. Greene. 2016. “Streetscape Features Related to Pedestrian Activity.” Journal of Planning Education and Research 36 (1): 5–15. doi:https://doi.org/10.1177/0739456X15591585.
- Ewing, R., M. Greenwald, M. Zhang, J. Walters, M. Feldman, R. Cervero, L. Frank, and J. Thomas. 2011. “Traffic Generated by Mixed-Use Developments—Six-Region Study Using Consistent Built Environmental Measures.” Journal of Urban Planning and Development 137 (3): 248–261. doi:https://doi.org/10.1061/(asce)up.1943-5444.0000068.
- Ewing, R., and O. Clemente. 2013. Measuring Urban Design: Metrics for Livable Places. doi:https://doi.org/10.5822/978-1-61091-209-9.
- Ewing, R., and R. Cervero. 2010. “Travel and the Built Environment.” Journal of the American Planning Association 76. doi:https://doi.org/10.1080/01944361003766766.
- Gehl, J. 2011. Life between Buildings. Washington, DC: Island Press.
- Gehl, J., and B. Svarre. 2013. How to Study Public Life. doi:https://doi.org/10.5822/978-1-61091-525-0.
- Ghavampour, E., M. Del Aguila, and B. Vale. 2017. “GIS Mapping and Analysis of Behaviour in Small Urban Public Spaces.” Area 49: 349–358. doi:https://doi.org/10.1111/area.12323.
- Gibson, J. J. 1979. “The Theory of Affordances.” In The Ecological Approach to Visual Perception. Boston: Houghton Mifflin.
- Giles-Corti, B., M. H. Broomhall, M. Knuiman, C. Collins, K. Douglas, K. Ng, A. Lange, and R. J. Donovan. 2005. “Increasing Walking: How Important Is Distance To, Attractiveness, and Size of Public Open Space?” American Journal of Preventive Medicine 28: 169–176. doi:https://doi.org/10.1016/j.amepre.2004.10.018.
- Glǎveanu, V. P. 2012. “What Can Be Done with an Egg? Creativity, Material Objects, and the Theory of Affordances.” Journal of Creative Behavior 46 (3): 192–208. doi:https://doi.org/10.1002/jocb.13.
- Göçer, Ö., K. Göçer, A. M. Başol, M. F. Kıraç, A. Özbil, M. Bakovic, F. P. Siddiqui, and B. Özcan. 2018. “Introduction of a Spatio-Temporal Mapping Based POE Method for Outdoor Spaces: Suburban University Campus as a Case Study.” Building and Environment 145: 125–139. doi:https://doi.org/10.1016/j.buildenv.2018.09.012.
- Goodchild, M. F. 2007. “Citizens as Sensors: The World of Volunteered Geography.” GeoJournal 69: 211–221. doi:https://doi.org/10.1007/s10708-007-9111-y.
- Guisan, A., and N. E. Zimmermann. 2000. “Predictive Habitat Distribution Models in Ecology.” Ecological Modelling 135 (2–3): 147–186. doi:https://doi.org/10.1016/S0304-3800(00)00354-9.
- Hadavi, S., R. Kaplan, and M. C. R. Hunter. 2015. “Environmental Affordances: A Practical Approach for Design of Nearby Outdoor Settings in Urban Residential Areas.” Landscape and Urban Planning 134: 19–32. doi:https://doi.org/10.1016/j.landurbplan.2014.10.001.
- Hajrasouliha, A. H. 2017. “Master-Planning the American Campus: Goals, Actions, and Design Strategies.” Urban Design International 22 (4): 363–381. doi:https://doi.org/10.1057/s41289-017-0044-x.
- Heft, H. 2010. “Affordances and the Perception of Landscape: An Inquiry into Environmental Perception and Aesthetics.” In Innovative Approaches to Researching Landscape and Health: Open Space: People Space 2. doi:https://doi.org/10.4324/9780203853252.
- Hilbe, J. M. 2011. Negative Binomial Regression. 2nd ed. doi:https://doi.org/10.1017/CBO9780511973420.
- Kenney, D. R., R. Dumont, and G. Kenney. 2005. Mission and Place: Strengthening Learning and Community through Campus Design. ACE/Praeger Series on Higher Education. Westport: Praeger.
- Kim, J. 2019. “Designing Multiple Urban Space: An Actor-Network Theory Analysis on Multiplicity and Stability of Public Space.” Journal of Urban Design 24 (2): 249–268. doi:https://doi.org/10.1080/13574809.2018.1468214.
- Kyttä, M., M. Kahila, and A. Broberg. 2011. “Perceived Environmental Quality as an Input to Urban Infill Policy-Making.” Urban Design International 16 (1): 19–35. doi:https://doi.org/10.1057/udi.2010.19.
- Lau, S. S. Y., and F. Yang. 2009. “Introducing Healing Gardens into a Compact University Campus: Design Natural Space to Create Healthy and Sustainable Campuses.” Landscape Research 34 (1): 55–81. doi:https://doi.org/10.1080/01426390801981720.
- Lee, S. 2013. “Does Context Matter? Understanding the Urban Design Requirements of Successful Neighborhood Parks.” ProQuest Dissertations and Theses, no. May, 136. https://librarylink.uncc.edu/login?url=https://search.proquest.com/docview/1355212898?accountid=14605%0Ahttps://uncc.primo.exlibrisgroup.com/openurl/01UNCC_INST/01UNCC_INST:01UNCC_INST?url_ver=Z39.88-2004&rft_val_fmt=info:ofi/fmt:kev:mtx:dissertation&genr
- Lenzholzer, S., and N. Y. van der Wulp. 2010. “Thermal Experience and Perception of the Built Environment in Dutch Urban Squares.” Journal of Urban Design 15 (3): 375–401. doi:https://doi.org/10.1080/13574809.2010.488030
- Magdaniel, F. C. 2016. “Technology Campuses and Cities: A Study on the Relation between Innovation and the Built Environment at the Urban Area Level.” Doctoral dissertation, Delft University of Technology. https://repository.tudelft.nl/islandora/object/uuid:681830ff-db15-44f7-829c-95e6ee100385?collection=research [Accessed 21 June 2021].
- Marshall, W. E., and N. W. Garrick. 2011. “Does Street Network Design Affect Traffic Safety?” Accident Analysis and Prevention 43: 769–781. doi:https://doi.org/10.1016/j.aap.2010.10.024.
- Mehta, V. 2014. “Evaluating Public Space.” Journal of Urban Design 19 (1): 53–88. doi:https://doi.org/10.1080/13574809.2013.854698.
- Mehta, V. 2019. “Streets and Social Life in Cities: A Taxonomy of Sociability.” Urban Design International 24 (1): 16–37. doi:https://doi.org/10.1057/s41289-018-0069-9.
- Meusburger, P. 2009. “Milieus of Creativity: The Role of Places, Environments, and Spatial Contexts.” In Milieus of Creativity, 97–153. doi:https://doi.org/10.1007/978-1-4020-9877-2_7.
- Meusburger, P. 2018. “Knowledge Environments at Universities: Some Theoretical and Methodological Considerations.” In, 253–290. doi:https://doi.org/10.1007/978-3-319-75593-9_7.
- Oldenburg, R., 2007. The Character of Third Places. Routledge.
- Rantisi, N. M., D. Leslie, and S. Christopherson. 2006. “Placing the Creative Economy: Scale, Politics, and the Material.” Environment and Planning A. doi:https://doi.org/10.1068/a39210.
- Rapoport, A. 1977. Human Aspects of Urban Form. 1st ed. Oxford, UK: Pergamon Press, Headignton Hill Hall. doi:https://doi.org/10.1016/c2013-0-02616-3.
- Sailer, K. 2011. “Creativity as Social and Spatial Process.” Facilities 29 (1): 6–18. doi:https://doi.org/10.1108/02632771111101296.
- Samuelsson, K., M. Giusti, G. D. Peterson, A. Legeby, S. A. Brandt, and S. Barthel. 2018. “Impact of Environment on People’s Everyday Experiences in Stockholm.” Landscape and Urban Planning 171: 7–17. doi:https://doi.org/10.1016/j.landurbplan.2017.11.009.
- Scott Shafer, C., D. Scott, J. Baker, and K. Winemiller. 2013. “Recreation and Amenity Values of Urban Stream Corridors: Implications for Green Infrastructure.” Journal of Urban Design 18 (4): 478–493. doi:https://doi.org/10.1080/13574809.2013.800450.
- Shalley, C. E., L. L. Gilson, and T. C. Blum. 2000. “Matching Creativity Requirements and the Work Environment: Effects on Satisfaction and Intentions to Leave.” Academy of Management Journal 43 (2): 215–223. doi:https://doi.org/10.2307/1556378.
- Simões Aelbrecht, P. 2019. “Introducing Body-Language Methods into Urban Design to Research the Social and Interactional Potential of Public Space.” Journal of Urban Design 24 (3): 443–468. doi:https://doi.org/10.1080/13574809.2018.1537712.
- Soares, I., G. Weitkamp, and C. Yamu. 2020. “Public Spaces as Knowledgescapes: Understanding the Relationship between the Built Environment and Creative Encounters at Dutch University Campuses and Science Parks.” International Journal of Environmental Research and Public Health 17 (20): 1–30. doi:https://doi.org/10.3390/ijerph17207421.
- Sternberg, R. J., and T. I. Lubart. 1991. “An Investment Theory of Creativity and Its Development.” Human Development 34 (1): 1–31. doi:https://doi.org/10.1159/000277029.
- Stevens, Q. 2015. “Creative Milieux: How Urban Design Nurtures Creative Clusters.” Journal of Urban Design 20: 1–7. doi:https://doi.org/10.1080/13574809.2015.981393.
- Stojanovski, T. 2020. “Urban Design and Public Transportation – Public Spaces, Visual Proximity and Transit-Oriented Development (TOD).” Journal of Urban Design 25 (1): 134–154. doi:https://doi.org/10.1080/13574809.2019.1592665.
- Strange, C. C., J. H. Banning, and U. Delworth. 2001. Educating by Design : Creating Campus Learning Environments that Work. The Jossey-Bass Higher and Adult Education Series. San Francisco: Jossey-Bass.
- Strange, C. C., and J. Banning. 2015. Designing for Learning: Creating Campus Environments for Student Success. San Francisco: Wiley.
- Talen, E., and S. Shah. 2007. “Neighborhood Evaluation Using GIS.” Environment and Behavior 39 (5): 583–615. doi:https://doi.org/10.1177/0013916506292332.
- Talen, E. 2011. “The Geospatial Dimension in Urban Design.” Journal of Urban Design 16 (1): 127–149. doi:https://doi.org/10.1080/13574809.2011.521029.
- Turner, P. V. 1986. “Campus: An American Planning Tradition.” Landscape Journal 5 (1): 66–67. doi:https://doi.org/10.3368/lj.5.1.66.
- Van Melik, R. 2008. “Changing Public Space: The Recent Redevelopment of Dutch City Squares.” Nederlandse Geografische Studies, no. 373: 1–230.
- Whyte, W. H. 1980. The Social Life of Small Urban Spaces. Common Ground?: Readings and Reflections on Public Space. New York: Project for Public Spaces. doi:https://doi.org/10.4324/9780203873960.
- Williams, D., and M. E. Patterson. 2008. “Place, Leisure and Well-Being.” In Sense of Place, Health and Quality of Life. Aldershot, UK: Ashgate Publishing Limited.
- Wohl, S. 2016. “Considering How Morphological Traits of Urban Fabric Create Affordances for Complex Adaptation and Emergence.” Progress in Human Geography 40 (1): 30–47. doi:https://doi.org/10.1177/0309132514566344.
- Wood, S., and K. Dovey. 2015. “Creative Multiplicities: Urban Morphologies of Creative Clustering.” Journal of Urban Design 20 (1): 52–74. doi:https://doi.org/10.1080/13574809.2014.972346.
- Zeng, C., B. Lyu, S. Deng, Y. Yu, N. Li, W. Lin, D. Li, and Q. Chen. 2020. “Benefits of a Three-Day Bamboo Forest Therapy Session on the Physiological Responses of University Students.” International Journal of Environmental Research and Public Health 17 (9): 3238. doi:https://doi.org/10.3390/ijerph17093238.