
ABSTRACT
The paper presents a field study analysing how pedestrians walked for leisure purposes in a familiar urban area, and why they walked as they did. Using mobile-based GPS, the walking trajectories of 44 participants were recorded, followed by the administration of a post-walk survey. Results show that participants gravitated towards five distinct paths that were similar in length (three shorter and two longer paths), yet observably different with respect to specific street features. Correspondingly, participants rated street features associated with these differences as factors that either attracted them towards, or repelled them away, from walking in specific streets.
Introduction
Walking in cities is linked with a plethora of positive effects including health, environmental, and economic benefits (Forsyth Citation2015; Kelly et al. Citation2018; Southworth Citation2005). In turn, urban designers have put forth a range of design strategies to promote walking in cities (Duany, Plater-Zyberck, and Krieger Citation1991; Forsyth Citation2015; Mueller et al. Citation2020; Pozoukidou and Chatziyiannaki Citation2021; Scudellari, Staricco, and Vitale Brovarone Citation2020). These include macro-scale interventions such as increasing the connectivity of streets and diversifying the mix of land-use, or micro-scale interventions at the street scale such as the addition of shading elements, street furniture or widening sidewalks and increasing separation from motorized traffic. Such strategies are gradually adopted by city councils and planning authorities who invest substantial amounts of resources to redesign existing streets and neighbourhoods to promote walking.
To guide effective urban interventions and responsible allocation of resources, it is necessary to understand pedestrians’ walking preferences across a range of trip purposes, from functional trips to leisure walks. Functional walks often highlight the role of distance and time as main considerations for choosing a walking path, and it is generally accepted that pedestrians will prefer to walk in the shortest path when performing a functional walk (Meyer Citation2016). In contrast, leisure walks are more experiential in nature and guided by a wider set of considerations (Cachón-Zagalaz et al. Citation2019; Kachkaev and Wood Citation2014).
Research studying considerations governing pedestrians’ walking behaviour has distinguished internal walking preferences and the external characteristics of available path choices (Golledge Citation1999). Nevertheless, previous studies have mostly investigated internal and external considerations separately, and at a macro-scale. Health research identified demographic characteristics that affect a person’s decision to walk. Urban design and planning researchers mostly calculate objective walkability indexes on the basis of urban form characteristics. Such indexes use either Geographical Information Systems (GIS) analysis (usually considering land use mix, residential density and street connectivity) or systematic field observations. Although subjective measures of walkability also exist, these rely on retrospective self-assessments of individual pedestrians (Dawson et al. Citation2007; Foster, Hillsdon, and Thorogood Citation2004). This method is often criticized for its inability to capture the experiential nature of walkability under natural conditions (Hill Citation1984; Millonig and Gartner Citation2007).
Differently, research from environmental psychology has taken a more empirical, micro-scale approach to study pedestrians’ walking behaviour. Methods employed include observations and recordings of pedestrians’ preferences and behaviours in-situ, using direct observations, trip diaries, surveys or localization technologies (Millonig and Gartner Citation2007). However, findings often fail to distinguish between leisure and functional walks, and repeatedly demonstrate the importance of distance, time and path complexity as critical considerations that affect pedestrians’ choice of walking paths (Gim and Ko Citation2017; Guo and Loo Citation2013; Hillier and Iida Citation2005; Hillier, Penn, and Hanson et al. Citation1993; Jiang et al. Citation2009; Lerman, Rofè, and Omer Citation2014; Penn et al. Citation1998; Seneviratne and Morrall Citation1985).
While some fewer empirical studies identify competing considerations that could lead pedestrians to avoid the shortest or the least complex paths (Guo and Ferreira Citation2008; Miranda et al. Citation2021; Muraleetharan and Hagiwara Citation2007; Weinstein Agrawal, Schlossberg, and Irvin Citation2008), the trip purpose and the characteristics of the walking environment considered are highly diverse across participants and path alternatives. For instance, comparing high versus low walkable environments or comparing trips for different purposes (e.g., functional versus leisure). This approach limits urban designers’ and planners’ ability to substantiate their design strategies at the street-scale with evidence linking walking preferences with specific street features.
Evidently, prior studies have mostly focused on functional trips (e.g., from home to work) in which pedestrians’ preferences are dominated by the need to minimize their walking time and distance, which can be met by increasing the connectivity and proximity between key origin and destination pairs. However, although there is substantial literature on long-distance walks for leisure purposes along hiking trails, or on leisure walks for tourism purposes (Hall and Ram Citation2019), the topic of leisure walks in familiar urban areas is considerably less researched.
To address this gap, this paper aims to deepen current knowledge and understanding of pedestrians’ walking preferences for leisure purposes in familiar urban areas. Specifically, the research questions guiding this study focus on the influence of micro-scale street features on pedestrian walking behaviour during leisure walks. To answer these questions a real-world field study in Tel Aviv was conducted to observe pedestrians’ walking behaviour for leisure purposes in an urban area they knew well.
The main goal of the field study conducted was to capture how pedestrians walk for leisure and why they walk as they do. Using a mobile-based GPS app, the walking trajectories of 44 participants who were asked to walk for leisure in Tel Aviv’s city centre were recorded. Participants were instructed to walk from a familiar origin towards a familiar destination where they completed a post-walk questionnaire surveying why they chose a specific walking path.
By analysing the data collected, the field study contributes insights that can inform urban design strategies at the street level, with the aim of promoting walking for leisure in cities. The findings of this research hold practical implications for urban designers and planners, providing evidence-based guidance for designing human-centred, pedestrian-friendly environments.
Relevant studies
This section provides an overview of relevant studies and theoretical perspectives concerned with pedestrian route choice and its relationship with urban design and walkability. By examining studies on objective and subjective measures of walkability, factors influencing pedestrian route choice, variations in walking trip and environment characteristics, the use of big geodata in pedestrian behaviour analysis, and theories linking urban design and pedestrian behaviour, this section aims to establish a solid foundation to critically discuss and contextualize the methods and findings of the presented field study.
Objective and subjective measures of walkability
Objective measures of walkability
Objective walkability measures can be generated using two primary methods: calculating a walkability index using GIS and collecting objective data through direct observations using auditing tools (Brownson et al. Citation2009; Gao et al. Citation2020; Lee and Talen Citation2014; Su et al. Citation2019). Audit tools involve using a standardized form of checklist to code the built environment characteristics and typically focus on a street segment or block (Brownson et al. Citation2009). Examples of audit tools include the Objective Walkability Index (OWI) which focuses on census blocks using GIS (Lee and Talen Citation2014). Recent research has shown that subjective measures of walkability can be predicted from objective measures using an artificial neural networks approach (Yameqani and Alesheikh Citation2019).
Subjective measures of walkability
Subjective measures of walkability focus on individuals’ perceptions and evaluations of barriers to walking in their neighbourhood, and are obtained through interviews or self-reported questionnaires (Dawson et al. Citation2007; Foster, Hillsdon, and Thorogood Citation2004). These measures can reveal associations between aspects of the built or social environment and walking behaviour, such as satisfaction with neighbourhood walking amenities, access to local walking programmes, and fear of crime (Dawson et al. Citation2007; Foster, Hillsdon, and Thorogood Citation2004; Plaut et al. Citation2021). The Neighbourhood Environment Walkability Scale (NEWS) is a commonly used 68-item questionnaire developed by Sallis et al. that assesses residents’ perceptions of certain built environment characteristics and their relationship to walking and bicycling behaviour (Brownson et al. Citation2009; Dawson et al. Citation2007; Saelens et al. Citation2003). The questionnaire includes sub-scales that cover residential density, proximity to stores and facilities, street connectivity, aesthetics, safety from traffic and crime, and facilities for walking and cycling. Subjective measures of walkability can also highlight the importance of older adults’ perceptions of the built environment in relation to their physical activity levels (Yang et al. Citation2021).
Comparing objective and subjective measures
Objective and subjective measures of walkability differ depending on the aspect being evaluated and the scale of the neighbourhood being studied (Michael et al. Citation2006; Weiss, Maantay, and Fahs Citation2010; Yameqani and Alesheikh Citation2019). A significant limitation of both types of measures is that they rely on retrospective assessments, which may not capture perceived walkability during a situated walk under natural conditions (Hill Citation1984; Millonig and Gartner Citation2007).
Despite being based on direct observation and data collection, objective measures such as the Objective Walkability Index (OWI) and other audit tools are not entirely free from subjective influences (Brownson et al. Citation2009; Lee and Talen Citation2014). The choice of variables used to calculate the index and the weighting assigned to each variable can impact the final results. On the other hand, subjective measures of walkability such as the Neighbourhood Environment Walkability Scale (NEWS) questionnaire are subject to social desirability bias and personal experiences that may not reflect the objective characteristics of the built environment (Dawson et al. Citation2007; Foster, Hillsdon, and Thorogood Citation2004; Saelens et al. Citation2003). Additionally, the fixed questionnaire format may limit participants’ ability to fully express their opinions or provide context to their responses.
To gain a more comprehensive understanding of the walking environment, it is important to use a combination of objective and subjective approaches and consider the limitations of each method when interpreting the results (Michael et al. Citation2006; Weiss, Maantay, and Fahs Citation2010; Yameqani and Alesheikh Citation2019).
Real-world behavioural studies to reveal pedestrians walking preferences
Factors influencing pedestrian route choice
Pedestrian route choice is influenced by various factors, including distance, time, and path complexity. Several studies have found that distance alone can explain about 50–80% of route choice (Gim and Ko Citation2017; Guo and Loo Citation2013; Seneviratne and Morrall Citation1985). This suggests that pedestrians tend to choose the shortest path between an origin and a destination. Path complexity, measured by the number of directional changes, is also important in route choice. Configurational properties of walking routes and street networks, such as the number of directional changes, have been shown to explain between 55% and 75% of pedestrian movement in streets (Hillier and Iida Citation2005; Hillier, Leaman, and Stansall et al. Citation1976; Hillier, Hanson, and Peponis Citation1984; Hillier, Penn, and Hanson et al. Citation1993; Jiang et al. Citation2009; Lerman, Rofè, and Omer Citation2014; Penn et al. Citation1998). Correspondingly, Seneviratne and Morrall (Citation1985) randomly approached 2900 pedestrians who were walking in the central business district of Calgary, Alberta in Canada and found that nearly three-quarters of respondents (72.4%) chose the shortest route with 50.7% believing it to be the quickest.
Competing considerations in pedestrian route choice
Prior studies have identified competing considerations that caused pedestrians to avoid the shortest path. These include route attraction, number of crossings, degree of crowding, weather protection, noise, and security (Seneviratne and Morrall Citation1985), social milieu, sidewalk amenities and activities, building attractiveness, and personal safety (Brown et al. Citation2007), and improved level of service on walkways and at crosswalks (Muraleetharan and Hagiwara Citation2007). Weinstein Agrawal, Marc, and Irvin (Citation2008) found that distance and safety factors were important attributes of chosen routes to transit stops in California and Oregon. Cho, Rodríguez, and Khattak (Citation2009) measured the quality of 338 street segments and found a significant correlation between perceived street quality and associated pedestrian counts. Guo and Ferreira (Citation2008, Guo Citation2009) studied pedestrians’ route choices after leaving subway stations in downtown Boston and found that the presence of retail and open space, sidewalk width, street crossings, and topography affected route choice decisions. provides an overview of factors reported in these studies.
Table 1. Factors influencing pedestrian route choice based on empirical studies.
Variations in walking trip and environment characteristics
It is worth noting that there is a lack of clarity regarding the specific characteristics of the walking trip and the walking environment being considered in the aforementioned studies. This may be due to variations in these factors between participants and path alternatives. Additionally, if there are significant differences in walkability between path alternatives, pedestrian choices may not necessarily reflect more subtle differences at the street level (e.g., the role of micro-scale features).
Use of big geodata in pedestrian behaviour analysis
Recently, Miranda et al. (Citation2021) analysed big geodata to calculate pedestrian’s deviations from the shortest path for a pair of origin and destination. Authors then applied computer vision methods to analyse the street features associated with desirable streets to which pedestrians deviated from the shortest paths. Their results were used to develop a desirability street index, suggesting that desirable streets are more visually enclosed, have less complex facades, and offer greater accessibility to parks, sidewalks, and businesses. This approach requires access to big data which is often difficult to obtain, and it does not directly account for how street features are perceived by pedestrians who walk for leisure purposes.
Theories linking urban design and pedestrian behaviour
Space syntax theory and pedestrian behaviour
In addition to the empirical studies linking urban design features and pedestrians’ walking behaviour, several theoretical perspectives should be considered as well. One such perspective is space syntax theory (Hillier et al. Citation1984; Dalton Citation2003), which posits that the spatial configuration of urban environments, such as the connectivity and accessibility of streets and buildings, shapes human behaviour and movement. According to this theory, the spatial configuration of street networks, streets and building layouts influences the perceived attractiveness and legibility of different routes, which, in turn, affects pedestrian behaviour. Studies have shown that the number of directional changes, a metric grounded in space syntax theory, can explain between 55% and 75% of pedestrian movement in streets. Other studies have found that urban environments with a more connected street network tend to promote more walking, as they offer more direct and accessible routes between destinations.
Affordances theory and its relevance to walking behaviour
Affordances theory is another theoretical concept that can be applied in analysing pedestrians’ walking behaviour. According to Gibson’s ecological approach to perception (Gibson Citation1979/2014), affordances refer to the possibilities for action offered by the environment to an organism. In the context of walking behaviour, the built environment can offer various affordances that may influence pedestrians’ choices of walking paths. For example, an open and well-lit sidewalk may afford safe and easy walking, while a narrow and cluttered sidewalk may afford the risk of tripping or colliding with obstacles. Affordances theory can provide insights into how pedestrians perceive the built environment and how they interact with it, and how these perceptions and interactions affect their walking behaviour.
Method
Field study
To overcome the gaps described in the literature review, a real-world field study and an on-site survey were carried out. The field study took place in Tel Aviv’s city centre and was restricted to an area where a walkability index is almost the same for all streets in the study area (). Streets included in the study area were highly walkable according to a Walk Score® analysis resulting in an average score of 97.15 (out of 100). Participants were instructed to perform a leisure-purposed walk from a pre-set origin to a pre-set destination (fixed across participants). Participants chose their own walking route between these two fixed points. A GPS-based mobile app was used to record participants’ trajectories. At the end point of the route, participants filled out a survey in which they were asked to rank their walking preferences for the trip they just completed.
Table 2. Average Walk Score®. analysis for N = 26 street segments included in the study area.
The study area
The chosen study area is considered the cultural, commercial, and economic centre of Tel Aviv, a city on Israel’s Mediterranean coast, offering a broad range of pedestrian spaces, from shaded streets to wide boulevards. A total of 26 streets were included in the study area. A Walk Score® analysis applied to all 26 streets generated a mean walkability score of 97.15 points, ranging from 91 in Merkas Ba’alei Melaha St. to 99 in the streets of Allenby, Rothschild Boulevard, Ben Zakai, Karl Netter, and Balfour. It is equivalent of a ‘walker’s paradise’ according to Walk Score® definitions.
Participants
44 participants (22 females, 22 males; mean age = 31 years; age range = 20–45) took part in the study. Participants recruitment was through an open call distributed online and at public notice boards around the study area. The study was approved by the Research Ethics Committee of the Technion, Israel’s Institute of Technology and the experiment was performed in accordance with relevant guidelines and regulations. All participants provided informed consent before participating in the study. Measures were taken to ensure participant confidentiality and anonymity. Personal identifying information was kept separate from survey responses and trajectory data. Participants were free to withdraw from the study at any time without consequences. The study also ensured the well-being and safety of participants during the walking trip by providing clear instructions and guidelines. Any potential risks or discomfort associated with the study were minimized. The study adhered to principles of voluntary participation, informed consent, privacy, and confidentiality to protect the rights and welfare of the participants.
The main inclusion criteria were formal residency in Tel Aviv for a period of 3–5 years, to ensure that participants were familiar with the navigation environment, excluding the effects of disorientation. Participants’ average walk duration was 99.6 minutes (max walk duration = 120 minutes, min walk duration = 79 minutes). Participants were rewarded with a rechargeable smart-phone battery upon arriving to the final destination.
Procedure
The field study included a single walking trip. On the day of the experiment, all participants arrived at a single pre-set location (i.e., the origin) within the study area (The Great synagogue in Tel Aviv). shows the location of the origin and destination in the study area. The experiment started at 9:30 on a Friday morning (considered a day-off for most people in Israel) and participants were scheduled to arrive at 10-minute intervals to avoid interaction between one another. The temperature measured throughout the day was between 19–23 degrees Celsius. Prior to starting the walking trip, participants were asked to instal and activate a route tracking app on their smartphones. Upon installing the tracking app, participants were instructed to walk for leisure purposes and arrive at the end of their walk to a specific destination point (i.e., destination, a coffee shop named Bakery at 206 Dizengof Street). Participants’ familiarity with the destination was confirmed. Participants were further instructed to not use any navigation apps or ask for route directions. They were told to remain within the bounds of the study area. Upon arriving to the destination point, participants were asked to turn off the route tracking app and were administered with a concluding, post-walk survey.
Figure 1. A mapping showing the spatial distribution of participants’ walking routes (retrieved from the GPS app recording) from the origin to the destination within the study area. The origin and destination pair specifically chosen for the leisure walk (fixed across participants) is indicated by a circle on the map.
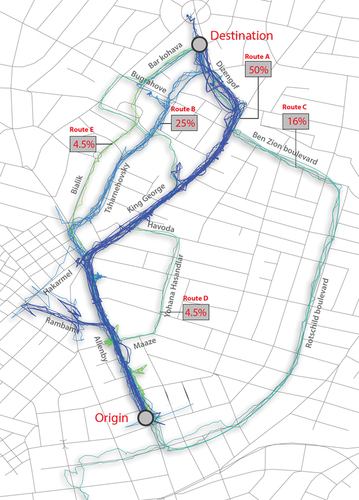
The choice to focus on a single walking trip was made deliberately to control for the impact of differences in the walking trip characteristics and the walking environment. By selecting a fixed pair of origin and destination, it was possible to ensure that all participants faced the same set of path alternatives and that differences in their path choices reflected more subtle differences at the street level rather than general preferences for more walkable streets. Moreover, In Israel, Friday is a half-day off before the Sabbath, which begins at sunset. Many shops and other points of interest may close early on Fridays, particularly in the late afternoon or early evening. Therefore, if the study had included a return trip on the same day as the leisure walk, participants may have encountered different points of interest and walking environments due to the timing of shop closures.
Post-walk survey
The on-site survey was administered using a digital tablet immediately upon completion of the walking trip and upon participants’ arrival at the pre-set destination, which was fixed for all participants. The survey comprised 14 questions, and an overview of the survey items and response scales is presented in . The first question asked participants to rate their level of familiarity with the walking path they had chosen using a 6-point Likert response scale, ranging from ‘not familiar’ (1) to ‘highly familiar’ (6). The second question asked participants to rank the three most important factors that influenced their choice of walking path during the leisure walk they had just completed. Response options included 14 considerations, such as crowdedness, noise, distance, points of interest, sidewalk width, parks, and safety. Questions 3–5 were open-ended and asked participants to provide additional details on why they chose each of these factors.
Table 3. An overview of the post-walk survey structure. Items are categorized by topic and response scale.
Questions 6–14 concerned participants’ subjective perceptions of the walking path they had chosen and asked them to rank their level of agreement (on a 3-point Likert scale, ‘disagree’, ‘neutral’, ‘agree’) with a total of nine statements. These statements included, for example, ‘I walked in the path I perceived to be the shortest/fastest/safest/most shaded’ and ‘The walking path had the widest sidewalks/the least number of barriers and obstacles’. The direction of agreement varies for each item. For example, for items such as ‘least crowded’ and ‘least noisy’, participants who select ‘Agree’ perceive the path to be less crowded or less noisy, respectively. However, for items such as ‘most shaded’ and ‘widest sidewalks’, participants who select ‘Agree’ perceive the path to have more shade or wider sidewalks, respectively. This was clarified in the instructions of the survey. In addition, the term ‘barriers and obstacles’ refers to any physical obstruction or impediment that may hinder pedestrian movement, such as uneven pavement or obstructed sidewalks. Finally, the statement about the path being ‘safest and has a separate lane for cyclists’ is intended to capture the perception that the path provides a safe and comfortable environment for pedestrians and cyclists, free from the hazards of motorized traffic. These nuances were clarified in the survey’s instructions and participants were able to ask members of the research team for clarifications on-site.
Finally, the survey was presented to participants after completing the entire walking trip, and their responses were for the whole trip rather than for specific street segments. The questions were designed to elicit participants’ overall perceptions of the trip and were formulated in a general manner to prevent bias towards specific segments.
Analysis
To analyse the survey data, a frequency and crosstabs analysis of participants’ responses was performed. For the unstructured questions in the survey (items 3–5), participants were asked ‘Why was [x]* an important consideration for your choice of walking path?’ for each of the walking considerations they chose. To analyse these responses each response was manually classified into distinct thematic categories, specifically avoidance statements and attraction statements. Avoidance statements referred to reasons why participants avoided certain walking path characteristics, while attraction statements referred to reasons why participants were drawn to certain walking path characteristics. The coding process was performed independently by two assessors, and any conflicts or disagreements were reconciled by a third independent assessor. Additionally, trajectory data from the mobile app was mapped using GIS, and the total distance and duration of the walk per participant were calculated.
Results
Where people walked?
A spatial mapping of participants trajectories revels that participants walked in a total of five distinct paths (). 50% of participants chose to walk in path A, 25% in path B, 16% in path C, 4.4% in path D and 4.5% in path E ()Footnote1. Exemplary pictures of the streets corresponding to the five paths are presented in . As can be seen, walking path A (along Allenby and King George St.) which was the walking path traversed by most of the participants, is a main route, characterized with an agglomeration of commerce and entertainment related functions (). It is also a main route with public transport lanes, and evidently is characterized with relatively high levels of noise (). Routes A, B and E all share a joint segment along the commercial Allenby Street. In comparison to route A, Route B, along its second part (Tsharnehovsky street) is more internal, quieter, and characterized with more restaurants and cafes than commerce. Along its second segment route E (along Bialik street) goes through a less commercial street which is quieter. The main part of route C goes through the city’s boulevards – Rothschild boulevard and Ben-Zion boulevard. As can be seen in , the boulevards are paved with bike lanes and are low on commercial functions. Both boulevards are characterized with relatively high noise levels. Route D goes through Gan Meir, A large park in the city centre.
Figure 2. An overview of the streets traversed by participants across the five walking paths in the real-world field study (images captured from Google Street View).
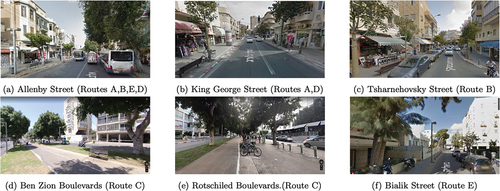
Figure 3. Spatial analysis of the study area augmented with participants’ walking paths.
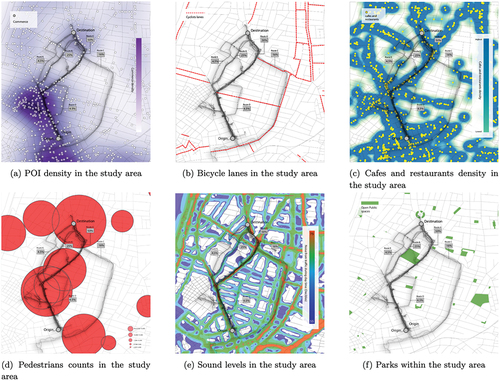
Table 4. The distribution of participants’ choice of walking route showing the % of participants who walked in each of the five routes (A-E).
As can be seen in , the shortest path (route B) has a length of 1.6 km and the longest path (Route E) has a length of 2.2 km. Interestingly, Routes A, B and D (identified as the short routes) have the same estimated walking distances and walking duration. However, participants’ route choices exhibited considerable disparity, with distinct percentages of individuals selecting each route; 50% for Path A, 25% for Path B, and only 4.5% for Path D. Moreover, the actual average duration of the trip was varied among these routes (120 min., 89 min. and 100 min. respectively). Complementary, routes C and E (identified as long routes) have similar estimated walking distance and walking duration and as with the shortest routes, the percentage of those who chose these routes are completely different, 16% and 4.5% respectively, and the actual average duration of the trip was varied between them (79 min. and 110 min. respectively). This might indicate that the characteristics of the specific streets play an important role in participants’ route choice.
Who walked and what were their walking preferences?
Out of the 44 participants, 43% reported to have no physical limitation. The remaining 57% of participants reported to have some type of special characteristics that may affect their walking behaviour; 18% walk on high heels, 20% walk with a dog, and 18% walk with baby strollers. presents the results from the post-walk survey, which revealed that Points of Interest (POI), Crowdedness, Cyclists, and Noise were the most important considerations that shaped participants’ choice of a walking path. When asked to rank the three most important factors during a leisure walk, 27% of participants chose Points of Interest as the most important factor, followed by 18% of participants choosing Sidewalk Width, 18.18% choosing Parks, 11% choosing Separation from Cyclists, and 11.35% choosing crowdedness. Crowdedness and Point of Interest (POI) were each chosen as the second most important factor by 23% of participants. Separation from Cyclists was chosen as the third most important consideration by 27% of respondents, followed by 25% of participants choosing Noise, and 20% choosing crowdedness.
Table 5. Participants’ choice (in %) of first, second and third most important walking considerations, sampled as part of the post-walk survey. Items that were not chosen are not mentioned in this table.
presents selected statements from participants’ responses to items 3–5 in the post-walk survey, and shows the percentage of avoidance and attraction statements for each walking consideration. Interestingly, the same consideration was perceived as both attractive and something to avoid. For instance, 44% of participants considered Points of Interest as a reason to choose a path, while 32% viewed it as a reason to avoid it. Similarly, crowdedness was seen as an attraction by 22% of participants but as an avoidance factor by 37%. When it comes to specific reasons for avoiding a path, Noise was the most frequently mentioned concern, cited by 43% of participants. This was followed by air pollution at 28% and cyclists at 21%. Conversely, Separation from Cyclists emerged as the most frequently mentioned factors attracting participants to choose a path, highlighted by 46% of participants. Sidewalk Width ranked next, with 31% of participants valuing it, followed by Parks at 28%. These findings underscore the complex decision-making process participants undergo when selecting a walking path for leisure.
Table 6. Selected statements by participants in response to items 3–5 in the post-walk survey (‘Why was [x]* an important consideration for your choice of walking path?’). Participants unstructured responses were manually classified as either ‘avoidance’ or ‘attraction’ statements.
Figure 4. % of participants’ unstructured responses classified as ‘avoidance’ or ‘attraction’ statements. Responses are for items 3–5 in the post-walk survey, answering the question: ‘Why was [x]* an important consideration for your choice of walking path?’.
![Figure 4. % of participants’ unstructured responses classified as ‘avoidance’ or ‘attraction’ statements. Responses are for items 3–5 in the post-walk survey, answering the question: ‘Why was [x]* an important consideration for your choice of walking path?’.](/cms/asset/49a6f1b4-14a9-4a4f-9f27-6eec1eb0edb5/cjud_a_2237468_f0004_oc.jpg)
Why did people walk as they did?
The previous analysis identified factors considered important in choosing a walking path but did not explore how participants perceived these factors or how the chosen paths aligned with their perceptions. To address this, an analysis of participants’ responses to items 6–14 in the post-walk survey was performed. Each of these items required participants to rank agreement with statements about their chosen path using a 3-point Likert scale (). Results reveal striking differences in participant perceptions. 100% of participants who chose path A strongly agreed that it was the shortest and fastest, while 50% of participants agreed that it had the most coffee shops and stores. For path B, which was slightly shorter (1.6 km), more than 50% of participants agreed that it had the least number of barriers and separation from cyclists. Path D, with the same length as paths A and B, had 100% agreement that it was the shortest and fastest, as well as the least crowded and noisy. Paths C and E, with almost the same length (2.1 km vs 2.2 km), had different participant perceptions. Both paths were perceived by 100% of participants to be the least noisy, safe in terms of separation from cyclists, having the least number of barriers, and the most shaded. However, 100% of participants who chose path E agreed that it was the least crowded, while 100% of those who chose path C disagreed.
Figure 5. Participants’ agreement with statements regarding their chosen walking path. Agreement levels were measured on a 3-point Likert scale (agree, disagree, neutral) for various statements, such as the path being the shortest, fastest, having the most coffee shops and stores, least crowded, least noisy, most shaded, least number of barriers, widest sidewalks, and separation from cyclists.
Discussion and conclusions
‘What is most walkable differs by walking purposes’ (Forsyth Citation2015). As this quote by Ann Forsyth demonstrates, the ‘walkability’ of a place greatly depends on the purpose of the walk. The aim of this study was to shed new light on leisure-purposed walks by residents of an urban city centre who are familiar with the walking environment, a topic which has received less attention when compared to considerable research efforts on functional walks (Meyer Citation2016), long-distance leisure walks in nature, or leisure walks by tourists in city centres (Hall and Ram Citation2019).
The study revealed three key findings about leisure walking in urban areas. Firstly, despite walking for leisure purposes, almost 80% of participants chose the shortest paths to reach their destinations. Secondly, Points of Interest, Crowdedness, Cyclists, and Noise were the most important factors shaping the hierarchy of route choice for leisure across pedestrians. Thirdly, pedestrians’ perceptions of micro-scale street features often determined whether they were attracted to or repelled from a particular path.
Remarkably, and although participants were free to choose any route amongst many available path alternatives, participants gravitated towards a total of five distinct walking paths (A-E), each with their own unique characteristics. Paths A and B were the shortest, with path A being perceived as the shortest and fastest. Path B, while only slightly longer than path A, was chosen by participants for having the least number of barriers and for being separated from cyclists. Path D was the same length as paths A and B and crossed through secondary streets. It was chosen by participants for being the shortest and fastest, but also the least crowded and least noisy. Path C and path E were perceived by participants as having the least noise, the most shading, and the least number of barriers. Path C, however, was perceived as highly crowded, while path E was chosen for being the least crowded. Walking duration across paths that were equal in length differed considerably, possibly due to differences in leisure walking patterns.
The written statements made by participants further illuminate the complexity of walking environments, showing that different pedestrians may perceive the same features as either an attraction or something to avoid. For example, the perception of crowdedness along the paths positively corresponds to a mapping of pedestrian counts along streets (), which showed high crowdedness in path C that goes through the main boulevards of the city and lower pedestrian counts in the area of path E that goes through secondary streets and a public park. This is further exemplified by a participant who chose Path C, stating that ‘Fridays are the worst, I just wanted to stay clear of the crowds, so I preferred to walk on Rothschild instead of Allenby’. In contrast, another participant who walked along Path A perceived crowdedness as being a positive attraction, as demonstrated by their quote: ‘I like to walk in busy streets and walk amongst many people, so I chose to walk along Allenby and King George’.
The study findings align with prior research on factors influencing pedestrian route choice. Firstly, it was found that pedestrians tend to choose the shortest path, which is consistent with previous studies that reported distance as the primary consideration in route choice (Gim and Ko Citation2017; Guo and Loo Citation2013; Seneviratne and Morrall Citation1985). However, this current study focused on leisure walks and demonstrated that distance remains a critical consideration even in this context. Secondly, it was revealed that specific social and environmental factors such as Points of Interest, Crowdedness, Cyclists, and Noise influenced pedestrian route choice, which supports previous research on the importance of social, environmental, and safety factors in shaping pedestrian route choice (Guo and Ferreira Citation2008, Guo Citation2009; Muraleetharan and Hagiwara Citation2007; Seneviratne and Morrall Citation1985). Thirdly, results highlight that pedestrians’ perceptions of micro-scale street features played a key role in determining their attraction or repulsion towards a particular path, even when paths were of the same length. This finding supports recent research by Miranda et al. (Citation2021) that identified specific street features, such as parks, sidewalks, separation from vehicular traffic, and urban furniture, as being associated with desirable streets (Adkins et al. Citation2012) that attracted pedestrians away from their shortest path. The field study extends these findings by demonstrating that micro-scale street features are associated with pedestrian route choice, also in the context of leisure purposed trips, and underscores the importance of these features in shaping pedestrian behaviour in urban areas. Moreover, the methodological approach developed offers a simple and effective method to study pedestrians’ walking preferences in the absence of big geo-referenced data.
Finally, the presented findings are especially relevant to inform urban design decisions concerning micro-scale design elements, namely sidewalk characteristics and their role in facilitating walkability that goes beyond functional considerations such as distance and direction changes.
Limitations
While the study provides valuable insights into pedestrian route choice for leisure walks in urban areas, there are several limitations that should be considered when interpreting the results. Firstly, the sample size was relatively small, consisting of only 44 participants. While this sample size was sufficient to provide a descriptive understanding of pedestrian preferences complemented by a qualitative analysis of their written statements, a larger sample size would increase the generalizability of the presented findings and could provide deeper insights into the hierarchy of walking preferences and the influence of specific street features (Neale, Boukhechba, and Cinderby Citation2023). Secondly, the study did not explicitly explore the influence of socio-cultural factors on pedestrian perceptions and behaviour. Future research could explore the role of factors such as gender, age, culture, and physical ability in shaping perceptions of the built environment and preferences for different streetscapes (Almahmood et al. Citation2017). Thirdly, the field study was conducted in a specific socio-cultural context in which leisure walks are common on Friday afternoons. Therefore, the findings may not be generalizable to other cultural contexts or times of the week. Fourthly, while measures to avoid participants getting lost during the walk were taken, it is not possible to rule out the possibility that participants’ walking patterns may have been influenced by their familiarity with the city and their usual walking routes. Finally, while the study provides insight into the micro-scale features that attract or repel pedestrians, it does not account for macro-scale factors such as land use patterns, street connectivity, and the overall urban form. Future research could explore the interaction between micro and macro-scale factors and their influence on pedestrian route choice.
Future research
The present field study provides valuable insights into pedestrian preferences and perceptions of urban walking paths for leisure purposes. However, there are several areas that warrant further investigation, opening up possibilities for future research.
First, future studies could use larger sample sizes to increase the generalizability of the presented findings and explore the influence of individual differences, such as age, gender, and physical constraints, on pedestrian perceptions and behaviour. Second, socio-cultural factors could be investigated to understand how they shape pedestrian preferences for different streetscapes, particularly in non-Western contexts. Third, the use of virtual reality to isolate the effect of specific street features on walking behaviour could be explored, and its correspondence with real-world findings could be analysed. Fourth, future research could examine the interaction between micro and macro-scale factors in shaping pedestrian route choice, such as street network connectivity and land-use patterns. Fifth, future research could explore the potential of emerging technologies, such as mobile electroencephalography (EEG), to gain deeper insights into the subjective experiences of pedestrians during leisure walks in urban areas (Mavros, Austwick, and Smith Citation2016). By utilizing mobile EEG devices, researchers can collect neurophysiological data that captures individuals’ cognitive and emotional responses in real-time as they navigate urban environments. This approach allows for a more objective understanding of the psychological aspects of pedestrian walking experiences in the context of leisure walks, offering valuable insights into the impact of urban design on mental states, attentional processes, and overall well-being during walking.
Broader research directions may include conducting longitudinal studies to track long-term walking behaviours, supplementing quantitative findings with qualitative research methods to explore subjective factors influencing pedestrian choices, investigating the interaction between walking and other modes of transportation, conducting experimental interventions to assess the impact of design elements on pedestrian behaviour, and comparing pedestrian preferences across different urban contexts. These future research efforts address the limitations of the study and offer a range of possibilities to improve walking experience in cities through evidence-based and human-centred urban design.
Acknowledgments
We would like to express our gratitude to the study participants for their valuable contribution. Additionally, we would like to acknowledge the Atel Fridman Excellence Scholarship, awarded by Tel Aviv’s Municipality Center for Economic and Social Research, for supporting this study.
Disclosure statement
No potential conflict of interest was reported by the author(s).
Additional information
Funding
Notes
1. Regarding the GPS traces in , it should be noted that a few data points around Rambam street did not fall on a path. These data points were excluded from the analysis because they were suspected to be a localization error.
References
- Adkins, A., J. Dill, G. Luhr, and M. Neal. 2012. “Unpacking Walkability: Testing the Influence of Urban Design Features on Perceptions of Walking Environment Attractiveness.” Journal of Urban Design 17 (4): 499–510. https://doi.org/10.1080/13574809.2012.706365.
- Almahmood, M., E. Scharnhorst, T. Agervig Carstensen, G. Jørgensen, and O. Schulze. 2017. “Mapping the Gendered City: Investigating the Socio-Cultural Influence on the Practice of Walking and the Meaning of Walkscapes among Young Saudi Adults in Riyadh.” Journal of Urban Design 22 (2): 229–248.
- Borst, H. C., S. I. de Vries, J. M. A. Graham, J. E. F. van Dongen, I. Bakker, and H. M. E. Miedema. 2009. “Influence of Environmental Street Characteristics on Walking Route Choice of Elderly People.” Journal of Environmental Psychology 29 (4): 477–484. https://doi.org/10.1016/j.jenvp.2009.08.002.
- Brownson, R. C., C. M. Hoehner, K. Day, A. Forsyth, and J. F. Sallis. 2009. “Measuring the Built Environment for Physical Activity: State of the Science.” American Journal of Preventive Medicine 36 (4): S99–S123. https://doi.org/10.1016/j.amepre.2009.01.005.
- Brown, B. B., C. M. Werner, J. W. Amburgey, and C. Szalay. 2007. “Walkable Route Perceptions and Physical Features: Converging Evidence for En Route Walking Experiences.” Environment and Behavior 39 (1): 34–61. https://doi.org/10.1177/0013916506295569.
- Cachón-Zagalaz, J., A. J. Lara-Sánchez, J. Luis Ubago-Jiménez, C. Gonzalez-Gonzalez de Mesa, F. José López-Gallego, and M. Luisa Zagalaz-Sánchez. 2019. “Walk More Towards Active Leisure, Tourism, Culture, and Education.” Sustainability 11 (11): 3174. https://doi.org/10.3390/su11113174.
- Cho, G., D. A. Rodríguez, and A. J. Khattak. 2009. “The Role of the Built Environment in Explaining Relationships between Perceived and Actual Pedestrian and Bicyclist Safety.” Accident Analysis & Prevention 41 (4): 692–702. https://doi.org/10.1016/j.aap.2009.03.008.
- Dalton, R. C. 2003. “The Secret is to Follow Your Nose: Route Path Selection and Angularity.” Environment & Behavior 35 (1): 107–131.
- Dawson, J., M. Hillsdon, I. Boller, and C. Foster. 2007. “Perceived Barriers to Walking in the Neighborhood Environment: A Survey of Middle-Aged and Older Adults.” Journal of Aging and Physical Activity 15 (3): 318–335. https://doi.org/10.1123/japa.15.3.318.
- Duany, A., E. Plater-Zyberck, and A. Krieger. 1991. Towns and Town-Making Principles. New York: Rizzoli International Publications.
- Forsyth, A. 2015. “What Is a Walkable Place? The Walkability Debate in Urban Design.” Urban Design International 20 (4): 274–292. https://doi.org/10.1057/udi.2015.22.
- Foster, C., M. Hillsdon, and M. Thorogood. 2004. “Environmental Perceptions and Walking in English Adults.” Journal of Epidemiology & Community Health 58 (11): 924–928. https://doi.org/10.1136/jech.2003.014068.
- Gao, J., C. B. M. Kamphuis, M. Helbich, and D. Ettema. 2020. “What Is ‘Neighborhood Walkability’? How the Built Environment Differently Correlates with Walking for Different Purposes and with Walking on Weekdays and Weekends.” Journal of Transport Geography 88:102860. https://doi.org/10.1016/j.jtrangeo.2020.102860.
- Gibson, J. J. 1979/2014. “The Theory of Affordances.” In The People, Place, and Space Reader, edited by J. J. Gieseking and W. Mangold, 56–60. Abingdon: Routledge.
- Gim, T.-H. T., and J. Ko. 2017. “Maximum Likelihood and Firth Logistic Regression of the Pedestrian Route Choice.” International Regional Science Review 40 (6): 616–637. https://doi.org/10.1177/0160017615626214.
- Golledge, R. G., ed. 1999. Wayfinding Behavior: Cognitive Mapping and Other Spatial Processes. Baltimore & London: Johns Hopkins University Press.
- Guo, Z. 2009. “Does the Pedestrian Environment Affect the Utility of Walking? A Case of Path Choice in Downtown Boston.” Transportation Research Part D: Transport and Environment 14 (5): 343–352. https://doi.org/10.1016/j.trd.2009.03.007.
- Guo, Z., and J. Ferreira Jr. 2008. “Pedestrian Environments, Transit Path Choice, and Transfer Penalties: Understanding Land-Use Impacts on Transit Travel.” Environment and Planning B: Planning and Design 35 (3): 461–479. https://doi.org/10.1068/b33074.
- Guo, Z., and B. P. Y. Loo. 2013. “Pedestrian Environment and Route Choice: Evidence from New York City and Hong Kong.” Journal of Transport Geography 28:124–136. https://doi.org/10.1016/j.jtrangeo.2012.11.013.
- Hall, C. M., and Y. Ram. 2019. “Measuring the Relationship between Tourism and Walkability? Walk Score and English Tourist Attractions.” Journal of Sustainable Tourism 27 (2): 223–240. https://doi.org/10.1080/09669582.2017.1404607.
- Hill, M. R. 1984. “Stalking the Urban Pedestrian: A Comparison of Questionnaire and Tracking Methodologies for Behavioral Mapping in Large-Scale Environments.” Environment and Behavior 16 (5): 539–550. https://doi.org/10.1177/0013916584165001.
- Hillier, B., J. Hanson, and J. Peponis. 1984. “What Do We Mean by Building Function?“ In Designing for Building Utilization, edited by J. Powell, I. Cooper, and S. Lera, 61–71. New York: E & F. N. Spon.
- Hillier, B., and S. Iida. 2005.“Network and Psychological Effects in Urban Movement.” In International conference on spatial information theory, 475–490. Berlin, Heidelberg: Springer Berlin Heidelberg.
- Hillier, B., A. Leaman, P. Stansall, and M. Bedford. 1976. “Space Syntax.” Environment and Planning B: Planning and Design 3 (2): 147–185. https://doi.org/10.1068/b030147.
- Hillier, B., A. Penn, J. Hanson, T. Grajewski, and J. Xu. 1993. “Natural Movement: Or, Configuration and Attraction in Urban Pedestrian Movement.” Environment and Planning B: Planning and Design 20 (1): 29–66. https://doi.org/10.1068/b200029.
- Jiang, Y., T. Xiong, S. C. Wong, C.-W. Shu, M. Zhang, P. Zhang, and W. H. K. Lam. 2009. “A Reactive Dynamic Continuum User Equilibrium Model for Bi-Directional Pedestrian Flows.” Acta Mathematica Scientia 29 (6): 1541–1555. https://doi.org/10.1016/S0252-9602(10)60002-1.
- Kachkaev, A., and J. Wood. 2014. “Automated Planning of Leisure Walks Based on Crowd-Sourced Photographic Content.”
- Kelly, P., C. Williamson, A. G. Niven, R. Hunter, N. Mutrie, and J. Richards. 2018. “Walking on Sunshine: Scoping Review of the Evidence for Walking and Mental Health.” British Journal of Sports Medicine 52 (12): 800–806. https://doi.org/10.1136/bjsports-2017-098827.
- Lee, S., and E. Talen. 2014. “Measuring Walkability: A Note on Auditing Methods.” Journal of Urban Design 19 (3): 368–388. https://doi.org/10.1080/13574809.2014.890040.
- Lerman, Y., Y. Rofè, and I. Omer. 2014. “Using Space Syntax to Model Pedestrian Movement in Urban Transportation Planning.” Geographical Analysis 46 (4): 392–410. https://doi.org/10.1111/gean.12063.
- Mavros, P., M. Z. Austwick, and A. H. Smith. 2016. “Geo-EEG: Towards the Use of EEG in the Study of Urban Behaviour.” Applied Spatial Analysis and Policy 9: 191–212.
- Meyer, M. D. 2016. Transportation Planning Handbook. Hoboken, NJ: John Wiley & Sons.
- Michael, Y., T. Beard, D. Choi, S. Farquhar, and N. Carlson. 2006. “Measuring the Influence of Built Neighborhood Environments on Walking in Older Adults.” Journal of Aging and Physical Activity 14 (3): 302–312. https://doi.org/10.1123/japa.14.3.302.
- Millonig, A., and G. Gartner. 2007. “Monitoring Pedestrian Spatio-Temporal Behaviour.” In Workshop on Behaviour Monitoring and Interpretation BMI 07, edited by B. Gottfried, 29–42. http://hdl.handle.net/20.500.12708/42150.
- Miranda, A. S., Z. Fan, F. Duarte, and C. Ratti. 2021. “Desirable Streets: Using Deviations in Pedestrian Trajectories to Measure the Value of the Built Environment.” Computers, Environment and Urban Systems 86:101563. https://doi.org/10.1016/j.compenvurbsys.2020.101563.
- Mueller, N., D. Rojas-Rueda, H. Khreis, M. Cirach, D. Andrés, J. Ballester, X. Bartoll, et al. 2020. “Changing the Urban Design of Cities for Health: The Superblock Model”. Environment International 134:105132. https://doi.org/10.1016/j.envint.2019.105132.
- Muraleetharan, T., and T. Hagiwara. 2007. “Overall Level of Service of Urban Walking Environment and Its Influence on Pedestrian Route Choice Behavior: Analysis of Pedestrian Travel in Sapporo, Japan.” Transportation Research Record 2002 (1): 7–17. https://doi.org/10.3141/2002-02.
- Neale, C., M. Boukhechba, and S. Cinderby. 2023. “Understanding Psychophysiological Responses to Walking in Urban Settings in Asia and Africa.” Journal of Environmental Psychology 86:101973. https://doi.org/10.1016/j.jenvp.2023.101973.
- Penn, A., B. Hillier, D. Banister, and J. Xu. 1998. “Configurational Modelling of Urban Movement Networks.” Environment and Planning B: Planning and Design 25 (1): 59–84. https://doi.org/10.1068/b250059.
- Plaut, P., D. Shach-Pinsly, N. Schreuer, and R. Kizony. 2021. “The Reflection of the Fear of Falls and Risk of Falling in Walking Activity Spaces of Older Adults in Various Urban Environments.” Journal of Transport Geography 95:103152. https://doi.org/10.1016/j.jtrangeo.2021.103152.
- Pozoukidou, G., and Z. Chatziyiannaki. 2021. “15-Minute City: Decomposing the New Urban Planning Eutopia.” Sustainability 13 (2): 928. https://doi.org/10.3390/su13020928.
- Saelens, B. E., J. F. Sallis, J. B. Black, and D. Chen. 2003. “Neighborhood-Based Differences in Physical Activity: An Environment Scale Evaluation.” American Journal of Public Health 93 (9): 1552–1558. https://doi.org/10.2105/AJPH.93.9.1552.
- Scudellari, J., L. Staricco, and E. Vitale Brovarone. 2020. “Implementing the Supermanzana Approach in Barcelona. Critical Issues at Local and Urban Level.” Journal of Urban Design 25 (6): 675–696. https://doi.org/10.1080/13574809.2019.1625706.
- Seneviratne, P. N., and J. F. Morrall. 1985. “Analysis of Factors Affecting the Choice of Route of Pedestrians.” Transportation Planning and Technology 10 (2): 147–159. https://doi.org/10.1080/03081068508717309.
- Southworth, M. 2005. “Designing the Walkable City.” Journal of Urban Planning and Development 131 (4): 246–257. https://doi.org/10.1061/(ASCE)0733-9488(2005)131:4(246).
- Su, S., H. Zhou, M. Xu, H. Ru, W. Wang, and M. Weng. 2019. “Auditing Street Walkability and Associated Social Inequalities for Planning Implications.” Journal of Transport Geography 74:62–76. https://doi.org/10.1016/j.jtrangeo.2018.11.003.
- Weinstein Agrawal, A., M. Schlossberg, and K. Irvin. 2008. “How Far, by Which Route and Why? A Spatial Analysis of Pedestrian Preference.” Journal of Urban Design 13 (1): 81–98. https://doi.org/10.1080/13574800701804074.
- Weiss, R. L., J. A. Maantay, and M. Fahs. 2010. “Promoting Active Urban Aging: A Measurement Approach to Neighborhood Walkability for Older Adults.” Cities and the Environment 3 (1): 12. https://doi.org/10.15365/cate.31122010.
- Yameqani, A. S., and A. A. Alesheikh. 2019. “Predicting Subjective Measures of Walkability Index from Objective Measures Using Artificial Neural Networks.” Sustainable Cities and Society 48:101560. https://doi.org/10.1016/j.scs.2019.101560.
- Yang, L., Y. Ao, J. Ke, Y. Lu, and Y. Liang. 2021. “To Walk or Not to Walk? Examining Non-Linear Effects of Streetscape Greenery on Walking Propensity of Older Adults.” Journal of Transport Geography 94:103099. https://doi.org/10.1016/j.jtrangeo.2021.103099.