
ABSTRACT
Whereas a rightward bump is more likely than a leftward bump when walking through a doorway, investigations into potential similar asymmetries for drivers are limited. The research presented here aims to determine the influence of innate lateral spatial biases when driving. Data from the Strategic Highway Research Program Naturalistic Driving Study (SHRP 2 NDS) and a driving simulation were used to address our research questions. Data points from SHRP 2 were aggregated within relevant variables (e.g., left/right obstacles). In the simulation, participants drove in ways that were consistent with their everyday driving in urban and rural environments. Collision frequency, collision severity and average lateral lane position were analyzed with rightward biases throughout both analyzes. SHRP 2 data indicated greater likelihoods of collisions when vehicles crossed the right line/edge of the road and when making a right turn. There were more collisions with obstacles on the right side, which were also more severe, and greater rightward lane deviations in the driving simulation, contrasted with more severe collisions on the left side in SHRP 2 data, possibly because of the presence of traffic. These findings suggest that previously observed rightward biases in distant space when walking are also present when driving.
Introduction
Investigating the external factors that impact driver attention are no doubt critical to improving safety on roadways as well as working towards a more comprehensive understanding of collisions. To that end, several meta-analyzes highlight the adverse influences of extraneous distractions on driving, including using mobile phones and the vehicle systems that integrate with mobile phones (Caird et al., Citation2008, Citation2014; Simmons et al., Citation2016, Citation2017) as well as the effects of drugs and alcohol (Asbridge et al., Citation2012; Chihuri & Li, Citation2017; Elvik, Citation2013; Irwin et al., Citation2017; Li et al., Citation2013; Rogeberg & Elvik, Citation2016; Sevigny, Citation2018). However, less is known about how the innate biases of spatial attention of drivers may impact driving and collisions. The studies presented here address this gap and investigate baseline lateral errors when driving in a driving simulation experiment as well as in naturalistic driving using data from the Strategic Highway Research Program Naturalistic Driving Study (SHRP 2 NDS).
Unequal involvement of the two hemispheres of the brain leads to the lateralization of human behaviours, such as language and handedness (Elias & Bryden, Citation1998). Visuospatial perception is biased to overestimate leftward space because of the dominance of the right hemisphere for spatial processing (Corbetta & Shulman, Citation2011). This phenomenon, known as pseudoneglect, is proposed to underlie many perceptual errors, such as consistent left-of-centre bisections on the line bisection task (Bowers & Heilman, Citation1980). Spatial lateral biases appear to flip, however, from left (in near space) to right (in distant space) as Turnbull and McGeorge (Citation1998) report right bumping when walking, referred to as unilateral bumping. Whereas there is interest in the potential role that unilateral bumping may have in driving safety (Nicholls et al., Citation2010; Robertson et al., Citation2015), most of what is known about the effects of innate biases of spatial attention on navigation comes from measuring lateral errors when walking or guiding electric wheelchairs through door posts.
Turnbull and McGeorge’s (Citation1998) seminal finding that participants recalled bumping slightly more to the right than to the left was later experimentally demonstrated by Nicholls et al. (Citation2007). Turnbull and McGeorge measured responses on the line bisection task, in addition to asking participants to recall recent bumps, and found that bisections made by right bumpers were further to the left than those of left bumpers. Nicholls et al. (Citation2008) experimentally confirmed the association between unilateral bumping and line bisection, providing support to the theory that right bumping is associated with pseudoneglect. Whereas there is considerable breadth of evidence to suggest that the rightward bias when navigating is stable [walking (Nicholls et al., Citation2007, Citation2008); by wheelchair (Nicholls et al., Citation2010); by remotely navigating a wheelchair (Nicholls et al., Citation2010; Robertson et al., Citation2015), or small vehicle (Nicholls et al., Citation2016)] it should be noted that the association is not without question (Hatin et al., Citation2012; Nicholls et al., Citation2007).
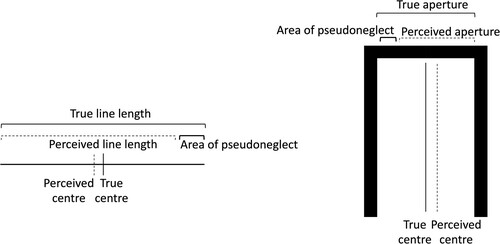
Although no one account has arisen to comprehensively explain the attenuation of the leftward bias in distant space, functional differences in near and far spaces are likely best explained by the theory that the processing of near and distant spaces occurs in distinct areas of the brain (e.g., Halligan & Marshall, Citation1991). Berti et al. (Citation2002) found that participants mentally mark the centre of the doorway to the right and then move towards that point without updating the centre mark, leading to rightward bisections. Using a remote wheelchair navigation task with eye-tracking, Robertson et al. (Citation2015) concluded that participants treat the space between two door posts as a faraway line to bisect, aiming for the perceived centre but consistently bisecting rightward. Relatedly, Robertshaw and Wilkie (Citation2008) used a driving simulator and eye-tracking to determine that the gaze of the driver determined the path of the vehicle, or that drivers steer where they are looking. Lastly, to provide a more direct comparison to pen and paper line bisections in near space, Longo and Lourenco (Citation2006) and Nicholls et al. (Citation2010) used a laser pointer to bisect lines in distant space, with both studies reporting rightward biases on the distant space task. See for a comparison of pseudoneglect in near and far space.
Figure 1. Comparison of pseudoneglect in near and far space. Solid lines indicate true dimensions, broken lines indicate perceived dimensions, and the bolded bracket highlights the underestimated area of visual space resulting in pseudoneglect. On the left, a typical leftward bias on the line bisection task is shown for near space. On the right, a rightward bias in far space is shown in a bumping task.
Of the small number of studies investigating lateral biases and driving, most have used driving simulators to approximate real-world driving, with few attempting to measure lateral biases or errors of drivers. Benedetto et al. (Citation2013) and Zheng et al. (Citation2020) monitored the eye-movements of drivers in simulated driving environments. While neither study measured driver behaviour, both found that the visual attention of drivers was biased leftward, with Zheng et al. noting a rightward shift in more experienced drivers.
Jang et al. (Citation2009) and Learmonth et al. (Citation2018) measured lateral driving behaviours in driving simulations as well as lateral spatial biases with traditional neuropsychological instruments (outside of the simulator) and report findings consistent with unilateral bumping studies (e.g., Nicholls et al., Citation2010). With Korean participants (right-side driving), Jang et al. found a stable pattern of rightward veering when driving, regardless of road markings, the number of lanes, or instructions to drive on the correct or reverse side of the road. Learmonth et al. report rightward biased lane-keeping behaviour among left-side driving participants residing in the United Kingdom. Both studies observed leftward biased line bisections, with Learmonth et al. also reporting a leftward bias on the landmark task. In the only examination of lateral biases in naturalistic driving (using data from right-side drivers in the SHRP 2 NDS), Friedrich et al. (Citation2017) found more collisions, as well as more near collisions, occurring to the left of drivers.
The research presented here investigates how innate spatial biases influence driving, through a novel approach of collecting empirical data from a simulated driving experiment and analyzing naturalistic driving data from the SHRP 2 NDS. Based on findings from past research exploring spatial lateral biases in distant space, both inside and outside of the vehicle, our overarching prediction for both studies was that driving behaviour would be right biased. All predictions for simulated and naturalistic driving were made in the context of right-side driving, which is the normal traffic pattern in North America where all data presented here were collected. Drivers in the simulation were predicted to show overall greater rightward lane deviations and a higher frequency of collisions, with greater severity, on the right side. In naturalistic driving, overall, collisions with obstacles on the right will occur more frequently and with greater severity.
Specifically in the simulation, greater lane deviations will occur in an urban setting, because of lane markings. Lane deviations will mirror the directions of turns (e.g., leftward on a left turn) and rightward on straightaways. Likewise, we predicted higher collision frequency on the same side as a turn and on the right on straightaways. More collisions, and collisions of greater severity, are predicted with moving obstacles (vs. stationary). In the naturalistic driving data, crossing the right edge of the road and making a right turn were predicted to result in higher collision frequency and greater collision severity. Further, when driving straight we predicted that more collisions, with greater severity, would occur with obstacles on the right side. Lastly, rightward evasive manoeuvres (vs. leftward) were predicted to be more effective at avoiding collisions.
Method
Simulated driving
Participants
All participants were students at the University of Saskatchewan in Canada where right-side driving is practiced. Participants were remunerated either $10 or 1 course credit, depending on the method by which they were recruited. Complete data sets were analyzed from fifty-three participants. Participants were almost two thirds female (21 male) with an average age of 23.7 years (SD = 6.6) and primarily right-handed (five left-handed). All participants spoke English, but native languages varied, including Arabic, Bengali, Farsi, Korean, Punjabi, Tagalog and Urdu.
Procedure
Experimental procedures were approved by the Behavioural Research Ethics Board at the University of Saskatchewan. Participants were seated at the driving simulator (described in detail below) after providing informed consent, completing a pen and paper demographic questionnaire (Elias et al., Citation1998), and a video game experience questionnaire. The experimenter gave verbal instructions to drive in a way that was consistent with everyday driving following the general rules of the road; to continue only in one direction; to attempt to keep the car on the road and take whatever measures necessary to avoid a crash when encountering obstacles; and to vary speed as required while maintaining control of the car. There was an opportunity to ask questions following the instructions and after questions the lights were dimmed, and the door was closed for participants to complete the task alone.
Participants completed the experiment in two blocks: a rural and an urban setting. Scenery of fields, trees and mountains in the rural setting were replaced by apartment blocks and buildings and roads with lane markings in the urban setting. Five circuits were completed in each block, although there were no indicators for the beginning or end of laps, giving the impression that the route was continuous. There were ten left turns and ten right turns, with eleven straightaways of varying lengths making up the remainder of the course. There were between twenty-three and twenty-seven obstacles encountered on any given circuit, with equal placements on the left and the right sides of the road, for a total of 124 obstacles in each block. Obstacles were further counterbalanced as either stationary or moving, with 62 of each per block. The order that blocks 1 and 2 were completed was counterbalanced between participants and all participants received a break after the first completed block.
Equipment
The virtual environments were displayed on a 27 in. monitor with 1920 × 1080 resolution and 16:9 aspect ratio, positioned approximately 60 cm from the participant at their midline. Navigation of the virtual environments was through the Logitech G27 driving kit, consisting of brake and accelerator pedals and a 270 mm leather wrapped steering wheel. The steering wheel (using a USB interface) and display (connected by HDMI) were connected to a Windows 10 PC (8GB ram, 3.3 GHz Intel Core i5 processor) with an NVIDIA GeForce GTX 750 Ti graphics card.
Scoring
Two main dependent variables were examined: average lateral lane position and collisions. Average lateral lane position was determined using the vehicle's X, Y and Z coordinates. These coordinates were virtual-world units specific to the virtual environment and were sampled in the order of milliseconds, resulting in hundreds of entries per second in the output log. Lateral deviations from centre were calculated by averaging these entries at any given section of the track (e.g., right turns). Collisions were analyzed by frequency and severity. Collision frequency was calculated by coding collisions with left obstacles as negative one (−1) and collisions with right obstacles with a positive one (1). A collision score was created by taking the mean of all the incidents, which resulted in an overall negative score for more leftward collisions. Gap scores were used to measure the directness of a collision as an approximation of severity. A gap score was based on the absolute horizontal spatial locations of the vehicle and the obstacle at the time of impact. As is illustrated in , a higher gap score indicated a less severe collision as there was less contact between the obstacle and the vehicle, and vice-versa for lower gap scores.
Naturalistic driving
Participants
SHRP 2 data were analyzed by aggregating events, rather than by participant. While participant demographics were not examined in each analysis an overview of participant handedness shows that the sample displayed a pattern of handedness consistent with the general population. No data were available for 80 participants, and of the remaining participants: 1476 were right-handed, 138 were left-handed and 64 reported co-dominance.
Procedure
The SHRP 2 NDS was sponsored by the Transportation Research Board (TRB) of the National Academy of Sciences. All subjects gave written informed consent. The Behavioural Research Ethics Board of the University of Saskatchewan approved the requested variables from the SHRP 2 NDS. The SHRP 2 NDS collected driving data from 3545 participants (16–98 years) across 6 states (all right-side driving; Florida, Indiana, North Carolina, New York, Pennsylvania and Washington). Participants’ vehicles were outfitted with a sophisticated data acquisition system that continuously captured daily driving data for 1–2 years (see Antin et al. (Citation2011) for a detailed description of study recruitment, participants and methodology).
The variables analyzed, and additional aggregations made in the current study are outlined below. Variable definitions and descriptions are from the SHRP 2 Researcher Dictionary for Video Reduction Data (Version 3.4; Virginia Tech Transportation Institute, Citation2015).
Precipitating Event is defined as the state of environment or action that began the sequence under analysis. This is the critical event which made the crash or near-crash possible and is not a driver behaviour, rather, this is a vehicle kinematic measure based on what the vehicle does. Some examples of coded events include: subject vehicle lane change, other vehicle: backing, and subject vehicle lost control: excessive speed. We isolated and focused the analysis on subject vehicle over the right line or edge of the road and subject vehicle over the left line or edge of the road as the most collisions occurred in these precipitating events.
Pre-incident Manoeuvre occurs just before the precipitating event and is the last type of action or driving manoeuvre just prior to or at the time of the precipitating event (and cannot be determined until the precipitating event is defined). This is also a vehicle kinematic measure based on what the vehicle does and not the driver behaviour. Examples of these manoeuvres include: merging, decelerating in traffic lane, and manoeuvring to avoid an object. The pre-incident manoeuvre analysis focused on turning right, going straight at a constant speed, and turning left, as these lead to the most collisions.
Evasive Manoeuvre is the reaction or avoidance manoeuvre (if any) in response to event nature, event severity, incident type, and crash severity by the subject driver. This is independent of manoeuvres associated with or caused by the resulting crash or near crash. Examples of these manoeuvres include: braked (lock up), accelerated and steered left, and steered right. We created the dichotomous variables of left evasive manoeuvres and right evasive manoeuvres by consolidating events coded as braked and steered left, accelerated and steered left, and steered left, and doing the same with respective manoeuvres occurring on the right.
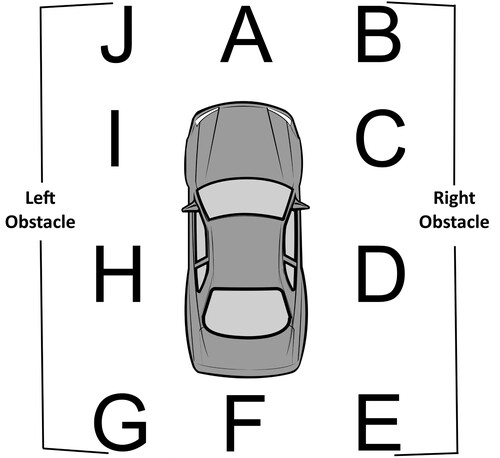
Motorist 2 Location is the position of other vehicles, animals, or objects involved in the event or restricting the subject vehicle's ability to manoeuvre at the time of the start of the precipitating event. The dichotomous variables left obstacle and right obstacle were created by consolidating the four lateral impact locations shown in . Whereas there were many types of objects coded into this variable including various types of automobiles (e.g., pick-up truck, mini-van), pedestrians, cyclists, and animals, they are simply referred to as obstacles throughout.
Crash severity is a ranking of crash severity based on the magnitude of vehicle dynamics, the presumed amount of property damage, knowledge of human injuries (often unknown in this dataset) and the level of risk posed to the drivers and other road users. This variable is coded only for events that include a crash and encompassed most severe crash, police-reportable crash, minor crash and low-risk tyre strike. Most severe crash and police-reportable crash were combined to a new group labelled severe crashes, and minor crash and low-risk tyre strike were combined as minor crashes ().
Figure 2. Gap score calculation. The distance between the lateral midline of the vehicle and the lateral midline of the obstacle are illustrated. The vehicle on the left shows a less direct leftward collision, resulting in a less severe collision compared to the vehicle on the right involved in a more severe rightward collision resulting from a more direct collision. Image adapted from: SHRP2 Researcher Dictionary for Video Reduction Data Version 3.4.
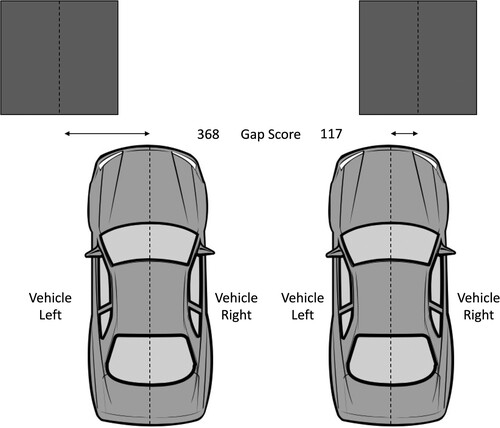
Figure 3. All possible impact locations on the subject vehicle. Location of obstacle, Motorist 2, is coded A–J in relation to the subject vehicle. Impact locations B, C, D, & E were coded as right obstacle and locations G, H, I, & J were coded as left obstacle. Image adapted from: SHRP2 Researcher Dictionary for Video Reduction Data Version 3.4.
Relative risk analysis
Relative risk (RR) is calculated by comparing the probability of one event occurring to the probability of another event occurring, with a resulting value being greater than or equal to zero. A value greater or less than one, opposed to an exact value of 1, indicates that one of the outcomes is more or less likely to occur. This likelihood is statistically significant if it falls within a 95% confidence interval (CI), and that the confidence interval does not include the exact value of 1. Additionally, the increase or reduction in risk is presented in each case, calculated by using the formula: Relative Risk = |1 − RR| * 100.
Results
Simulated driving
Urban and rural lateral lane positions
Collapsing across track sections, we used a 2 (location: urban, rural) × 2 (deviation: left, right) repeated-measures analysis of variance (ANOVA) to determine average lateral lane position in both locations. The interaction between location and lateral deviation was significant, F(1, 52) = 18.2, p < 0.001, η2P = 0.259, as well as main effects of location, F(1, 52) = 203.5, p < 0.001, η2P = 0.796, and lateral deviation, F(1, 52) = 69.7, p < 0.001, η2P = 0.573. Means analyzes revealed greater lateral deviations in the urban condition and greater lateral deviations to the right. Post-hoc paired samples t-tests corrected to p = 0.001 revealed rightward deviations (vs. leftward) were significantly greater in urban, t(52) = 7.4, p < 0.001, and rural, t(52) = 5.1, p < 0.001 locations. Further, rightward deviations in the urban location were significantly greater than those in the rural condition, t(52) = 11.8, p < 0.001.
Track section lateral lane positions
Collapsing across locations, we used a 3 (track section: left, right, straightaway) × 2 (deviation: left, right) repeated-measures ANOVA to determine average lateral lane position when turning or going straight. The interaction between track section and lateral deviation (F(2, 104) = 412.4, p < 0.001, η2P = 0.888) as well as main effects of track section (F(2, 104) = 190.9, p < 0.001, η2P = 0.786) and deviation (F(1, 52) = 69.7, p < 0.001, η2P = 0.573) were all significant. Post-hoc paired-samples t-tests corrected to p = 0.001 found greater leftward deviations during left turns, t(52) = 7.9, p < 0.001, greater rightward deviations during right turns, t(52) = 21.9 p < 0.001, and greater rightward deviations on straightaways, t(52) = 6.7, p < 0.001. All average lane positions and their associated standard deviations for locations and track sections can be found in .
Table 1. Average lateral lane positions in virtual-world units for track sections and locations.
Collisions overall
A breakdown of the means, standard deviations and t-test statistics of collision frequency and severity according to the site of the collision can be found in . Of the 812 collision incidents, 464 occurred with obstacles on the right and 348 occurred with obstacles on the left. The greater frequency of collisions with objects on the right across conditions and locations resulted in a significant rightward bias when the positive collision score was compared to a midpoint of zero using a one-sample t-test. Further, collisions with obstacles on the right were found to be significantly more severe than collisions with leftward obstacles through an independent-samples t-test comparing left and right gap scores.
Table 2. Means, standard deviations and t-test statistics for collision frequencies and severities.
Urban and rural collisions
Across all conditions and between locations there were more collisions with obstacles on the right, with those rightward collisions having smaller gap scores. Because collision scores and gap scores were all biased in the same direction between locations, further analyzes were carried out by collapsing across urban and rural locations.
Track section collisions
Collisions were examined by occurrences in the three sections of track: straightaway, left turns and right turns. The positive straightaway collision score was significantly different from zero using a one-sample t-test, indicating a greater occurrence of rightward collisions. However, no significant difference was detected in the severity of left or right collisions. In left turns, more collisions occurred with obstacles on the left and there were more severe collisions with obstacles on the right. In right turns, a one-sample t-test found the positive collision score to be significantly different from zero, indicating that more collisions occurred with obstacles on the right. Additionally, collisions in right turns with right obstacles were more severe than left obstacle collisions.
Moving and static obstacle collisions
Overall, there were more collisions with moving (N = 700) than with static (N = 112) obstacles. Collisions with both moving and static obstacles occurred more frequently on the right; however, only moving obstacle collisions reached significance. Collisions with static obstacles were found to be more severe when gap scores of static obstacle collisions ( = 190.1, SD = 97.3) and moving obstacle collisions ( = 311.3, SD = 206) were compared with an independent-samples t-test, t(302.5) = 10.1, p < 0.001.
Naturalistic driving
Precipitating event: crossing road line or edge
Comparing the frequencies of collisions occurring from the subject vehicle crossing the left line or edge of the road with right line or edge crossings revealed that crossing right resulted in 1.17 times the risk of a collision occurring compared to crossing left (CI: 1.098–1.247, p < 0.001), or a 17% increase in collision risk over and above crossing left. Although, collisions resulting from crossing left had 2.17 times the risk of a severe collision, the difference was not significant with crossing right (CI: 0.403–11.811, p = 0.365).
Pre-incident manoeuvres: turning
Making a right turn had 1.51 times the risk of a collision occurring compared with turning left (CI: 1.349–1.691, p < 0.001), or a 51% increase in collision risk over and above turning left. Making a left turn had 3.40 times the risk of a severe collision (CI: 1.394–8.619, p = 0.008), or a 240% increase in severe collision risk over and above turning right. When going straight at a constant speed, the frequency and severity of collisions with left and right obstacles were compared. Both the overall risk of a collision and the risk of a severe collision were greater for obstacles on the left (1.04 and 1.9 times, respectively), however, only the risk of a severe collision with an obstacle on the left was significant (CI: 1.068–3.368, p = 0.029) with a 90% increase in severe collision risk over and above a severe collision on the right.
Most collisions occurred at either the front or rear of the subject vehicle when making a left turn (94%) or right turn (97%). However, examining the frequency of collisions with left and right obstacles during left and right turns revealed a greater likelihood of a collision with an obstacle on the same side as the turn (a 167% increase in risk to have a leftward collision when turning left or 1.17 times the risk of a collision to the left during a left turn than during a right turn (CI: 1.268–5.528, p = 0.010), and a 466% increase in risk in having a rightward collision while turning right or 5.65 times the risk of a rightward collision during a right turn compared with making a left turn [CI: 1.469–21.862, p = 0.012]).
Evasive manoeuvres avoiding collisions
Making an evasive manoeuvre to the right to avoid a collision had 0.49 times the collision risk compared with a left evasive manoeuvre (CI: 0.413–0.594, p < 0.001), or a 51% reduction in collision risk with a right evasive manoeuvre.
Lateral obstacle location: Avoided
The likelihood of steering right when encountering an obstacle on the left was 3.9 times that of steering right when encountering an obstacle on the right (CI: 3.363–5.070, p < 0.001), or a 295% increase to steer right for left obstacles over and above steering right for right obstacles. Conversely, the likelihood of steering left for an obstacle on the right was 6.34 times that of steering left when encountering an obstacle on the left (CI: 4.579–8.029, p < 0.001), or a 534% increase to steer left when encountering a right obstacle over and above steering left for a left obstacle.
Lateral obstacle location: Collisions
Despite obstacles on the right having 0.9 times the risk of a collision compared to left obstacles (CI: 0.7013–1.150 p = 0.393), or a 10% decrease in collision risk for right obstacles, no significant difference was found between frequencies of collisions with obstacles on the left and right. However, collisions with left obstacles had 1.4 times the risk of being a severe collision compared with obstacles on the right (CI: 1.048–1.869, p = 0.023), or a 40% increase in severe collision risk with an obstacle on the left over and above an obstacle on the right. shows the data used to calculate RR for collisions and severe collisions.
Table 3. Relative risk for collisions and severe collisions.
Discussion
Two complementary approaches were taken to investigate spatial lateral biases when driving, analysis of naturalistic driving from the SHRP 2 data set and a driving simulation experiment. Both paradigms examined driving behaviours across several variables and report consistency with past findings from driving simulator research (Jang et al., Citation2009; Learmonth et al., Citation2018) and naturalistic data analysis (Friedrich et al., Citation2017). These results can be understood outside of driving and in the broader context of lateral spatial biases in distant space, given our precise focus on lateral obstacles and events. And indeed, we present evidence of a rightward bias when driving (in the simulator) that suggests those prior investigations reporting a rightward bias when navigating distant space by operating scooters (Robertson et al., Citation2015) and remote-controlled cars (Nicholls et al., Citation2016) are likely accurate reflections of the asymmetrical distribution of attention when driving.
Several lateral aspects of operating a vehicle require careful consideration and are further complicated when considering different driving rules across the world. While there is uncertainty surrounding an explanation for divergences in lateral biases between naturalistic and simulated driving, particularly relating to collisions, we explore several possibilities below and suggest that future research continue the investigation of spatial lateral biases through manipulating the lateral position of the driver in the vehicle's cabin and manipulating the side of oncoming traffic. The driving data analyzed in the research presented here originated in North America. Whereas the typical practice here is for the driver to be situated on the left-side of the vehicle and the right-side of the road, the opposite lateral arrangement is common elsewhere (e.g., Australia) where the driver is situated on the right-side of the vehicle and the left-side of the road. When using a desktop computer-based simulator the vehicle operator's position is more centralized, which may be an additional consideration when comparing spatial biases in naturalistic data and data from a simulation.
The simulated driving experiment was developed to emulate a naturalistic driving experience and maximize external validity. Doing so required participants to encounter several scenarios, which makes the direct comparison of simulated driving to unilateral bumping paradigms somewhat more complicated. However, the method used here isolated events that occurred on straight sections of road, facilitating relatively straightforward comparisons to basic unilateral bumping. We report that when driving straight both collisions and deviations are biased rightward, a finding that is remarkably consistent with results from previous unilateral bumping paradigms (Nicholls et al., Citation2007, Citation2008, Citation2010, Citation2016; Robertson et al., Citation2015; Turnbull & McGeorge, Citation1998).
Examining lane positioning, collision frequency and collision severity in the driving simulation revealed a general trend for drivers to deviate rightward and show increased collisions with obstacles on the right side. These rightward collisions were of greater severity than leftward collisions across all manipulations (urban and rural, moving and static obstacles, turns and straightaways). The pattern of rightward collisions persisted in the rural condition, where rightward deviations were less than those observed in the urban condition. More right-sided collisions occurred when making right turns, going straight, as well as with both moving and static objects (although those with static objects were not significant). The making a left turn condition was the only instance where significantly more left-sided collisions occurred and in no condition were collisions more severe on the left side than the right side.
The variables subject vehicle over the right/left line/edge of the road were examined to investigate basic lateral deviations without obstacles or collisions when driving in a naturalistic setting, however this data also provided information about the critical events which made a crash or near-crash possible. Similar to rightward veering results in unilateral bumping laboratory studies by Nicholls et al. (Citation2016) and Robertson et al. (Citation2015), rightward lane position results from previous driving simulation studies by Jang et al. (Citation2009) and Learmonth et al. (Citation2018), and the rightward deviations on straightaways previously described in our own driving simulation, we report that drivers crossing over the right line or edge of the road are at a greater risk of a collision than drivers who cross left. The consistency of this lateral bias across various methodologies suggests that the rightward bias in distant space is robust and that compelling arguments to further support this may be produced by future research examining driving and lateral biases.
No lateral differences were found when examining collisions when turning as there was a general trend for collisions to occur on the side of the vehicle congruent with the direction of the turn. There was, however, an increase in severe collision risk when making a left turn (over and above turning right). Similarly, there was no significant difference in the frequency of collisions with obstacles on the right or left, however, severe collision risk again increased with obstacles on the left (over and above obstacles on the right). Our analysis of evasive manoeuvres shows a clear pattern: steering to the left is likely to occur when an obstacle is on the right and steering to the right is likely to occur when an obstacle is on the left. Whereas this interpretation is straightforward and intuitive, there is a marked difference in the likelihood of a collision occurring following left and right manoeuvres, with collision risk reduced by 50% when making a rightward evasive manoeuvre.
Findings presented here of increased severity for leftward collisions and reduced collision risk from rightward evasive manoeuvres suggests that oncoming left-side traffic (captured in the naturalistic driving data) influences spatial attention when driving. Further research targeting the role of oncoming traffic with right-side and left-side drivers will be required to determine if rightward biases observed in simulated driving are indeed attenuated by the presence of oncoming traffic. Our data suggests that it is reasonable to conclude that right-side drivers are more effective at avoiding collisions by steering rightward as a function of the increased risk of severe collisions with oncoming left-side traffic.
Lateral navigation errors in distant space may be influenced by visual attention biases (Benedetto et al., Citation2013; Zheng et al., Citation2020) and motor biases (Oldfield, Citation1971), and there is evidence to suggest that driving rules (i.e., right-side driving) may also play a role outside of driving contexts. In a task requiring participants to balance a tray of as they walked through a doorway, Thomas et al. (Citation2017) found that right-side driving Swiss participants had greater rightward deviations than left-side driving Australian participants. Whereas findings of unilateral rightward bumping from previous studies have included left-side driving Australian participants (e.g., Nicholls et al., Citation2008), the side of the road an individual is accustomed to driving on may be an important factor determining lateral spatial biases in navigation, including both driving and non-driving modalities.
Future directions examining spatial lateral biases in driving may also include determining if individual differences like age, sex, handedness (Jewell & McCourt, Citation2000) and native reading direction (e.g., right-to-left readers; Chokron & Imbert, Citation1993) that have been found to influence lateral spatial attention also effect driving. Further, investigation into the lateral allocation of overt visual attention relating to driving performance has yet to occur, even though several studies have measured eye movements when driving (e.g., Benedetto et al., Citation2013; Robertshaw & Wilkie, Citation2008; Zheng et al., Citation2020). Expanding the use of eye-tracking when driving, whether through implementing screen based eye-tracking during driving simulations or using eye-tracking glasses in a naturalistic setting, will provide valuable insights into laterally biased behaviours.
The findings presented here may have practical applications for driving, as well. Modification of driver education programmes to give drivers-in-training knowledge about their biases may be used by educators to have a positive effect on road safety. Additionally, traffic engineers designing roadways may use these findings to tailor infrastructure to drivers’ biases whereas engineers working on adaptive features in modern vehicles could potentially fine tune the programming of vehicle computers and inform machine learning and artificial intelligence with this information about driver behaviour.
In conclusion, the findings presented here add breadth to the growing number of studies examining distant spatial biases, and novel information concerning lateral biases when driving. The unequal distribution of attention between left and right visual space, known as pseudoneglect, is theorized to be responsible for the rightward bias previously observed when navigating outside the vehicle (e.g., walking) as well as the rightward biases observed when navigating a vehicle.
Disclosure statement
No potential conflict of interest was reported by the author(s).
Data availability statement
The data that support the findings of this study are available from Virginia Tech Transportation Institute. Restrictions apply to the availability of these data, which were used license for this study. Data are available from L.J. Elias with the permission of Virginia Tech Transportation Institute.
Additional information
Funding
References
- Antin, J. F., Lee, S., Hankey, J., & Dingus, T. (2011). Design of the in-vehicle driving behaviour and crash rish study: In support of the SHRP 2 naturalistic driving study. Virginia Tech Transportation Institute.
- Asbridge, M., Hayden, J. A., & Cartwright, J. L. (2012). Acute cannabis consumption and motor vehicle collision risk: Systematic review of observational studies and meta-analysis. BMJ, 344(feb09 2), e536. https://doi.org/10.1136/bmj.e536
- Benedetto, S., Pedrotti, M., Bremond, R., & Baccino, T. (2013). Leftward attentional bias in a simulated driving task. Transportation Research Part F, 20, 147–153. https://doi.org/10.1016/j.trf.2013.07.006
- Berti, A., Smania, N., Rabuffetti, M., Ferrarin, M., Spinazzola, L., D’Amico, A., Ongaro, E., & Allport, A. (2002). Coding of far and near space during walking in neglect patients. Neuropsychology, 16(3), 390–399. https://doi.org/10.1037/0894-4105.16.3.390
- Bowers, D., & Heilman, K. M. (1980). Pseudoneglect: Effects of hemispace on a tactile line bisection task. Neuropsychologia, 18(4-5), 491–498. https://doi.org/10.1016/0028-3932(80)90151-7
- Caird, J. K., Johnston, K. A., Willness, C. R., Asbridge, M., & Steel, P. (2014). A meta-analysis of the effects of texting on driving. Accident Analysis and Prevention, 71, 311–318. https://doi.org/10.1016/j.aap.2014.06.005
- Caird, J. K., Willness, C. R., Steel, P., & Scialfa, C. (2008). A meta-analysis of the effects of cell phones on driver performance. Accident Analysis and Prevention, 40(4), 1282–1293. https://doi.org/10.1016/j.aap.2008.01.009
- Chihuri, S., & Li, G. (2017). Use of prescription opioids and motor vehicle crashes: A meta-analysis. Accident Analysis and Prevention, 109, 123–131. https://doi.org/10.1016/j.aap.2017.10.004
- Chokron, S., & Imbert, M. (1993). Influence of reading habits on line bisection. Cognitive Brain Research, 1(4), 219–222. https://doi.org/10.1016/0926-6410(93)90005-P
- Corbetta, M., & Shulman, G. L. (2011). Spatial neglect and attention networks. Annual Review of Neuroscience, 34(1), 569–599. https://doi.org/10.1146/annurev-neuro-061010-113731
- Elias, L. J., & Bryden, M. P. (1998). Footedness is a better predictor of language lateralization than handedness. Laterality, 3(1), 41–52. https://doi.org/10.1080/713754287
- Elias, L. J., Bryden, M. P., & Bulman-Fleming, M. B. (1998). Footedness is a better predictor than is handedness of emotional lateralization. Neuropsychologia, 36(1), 37–43. https://doi.org/10.1016/S0028-3932(97)00107-3
- Elvik, R. (2013). Risk of road accident associated with the use of drugs: A systematic review and meta-analysis of evidence from epidemiological studies. Accident Analysis and Prevention, 60, 254–267. https://doi.org/10.1016/j.aap.2012.06.017
- Friedrich, T. E., Elias, L. J., & Hunter, P. V. (2017). Crashing left vs. right: Examining navigation asymmetries using the SHRP2 naturalistic driving study data. Frontiers in Psychology, 8, 1–11. https://doi.org/10.3389/fpsyg.2017.02153
- Halligan, P. W., & Marshall, J. C. (1991). Left neglect for near but not far space in man. Nature, 350(6318), 498–500. https://doi.org/10.1038/350498a0
- Hatin, B., Sykes Tottenham, L., & Oriet, C. (2012). The relationship between collisions and pseudoneglect: Is it right? Cortex, 48(8), 997–1008. https://doi.org/10.1016/j.cortex.2011.05.015
- Irwin, C., Iudakhina, E., Desbrow, B., & McCartney, D. (2017). Effects of acute alcohol consumption on measures of simulated driving: A systematic review and meta-analysis. Accident Analysis and Prevention, 102, 248–266. https://doi.org/10.1016/j.aap.2017.03.001
- Jang, S.-L., Ku, B.-D., Na, D.-L., & Lee, J.-H. (2009). Effects of pseudoneglect on visual attention: Evidence for car laterality using driving simulator. CyberPsychology & Behaviour, 12(1), 81–112. Abstract retrieved from CyberTherapy 13. https://doi.org/10.1089/cpb.2008.9999.abs
- Jewell, G., & McCourt, M. E. (2000). Pseudoneglect: A review and meta-analysis of performance factors in line bisection tasks. Neuropsychologia, 38(1), 93–110. https://doi.org/10.1016/S0028-3932(99)00045-7
- Learmonth, G., Märker, G., McBride, N., Pellinen, P., & Harvey, M. (2018). Right-lateralised lane keeping in young and older British drivers. PLoS One, 13, 9. https://doi.org/10.1371/journal.pone.0203549
- Li, G., Brady, J. E., & Chen, Q. (2013). Drug use and fatal motor vehicle crashes: A case-control study. Accident Analysis and Prevention, 60, 205–210. https://doi.org/10.1016/j.aap.2013.09.001
- Longo, M. R., & Lourenco, S. F. (2006). On the nature of near space: Effects of tool use and the transition to far space. Neuropsychologia, 44(6), 977–981. https://doi.org/10.1016/j.neuropsychologia.2005.09.003
- Nicholls, M. E. R., Hadgraft, N. T., Chapman, H. L., Loftus, A. M., Robertson, J., & Bradshaw, J. L. (2010). A hit-and-miss investigation of asymmetries in wheelchair navigation. Attention, Perception, & Psychophysics, 72(6), 1576–1590. https://doi.org/10.3758/APP.72.6.1576
- Nicholls, M. E. R., Jones, C. A., & Robertson, J. S. (2016). Heading to the right: The effect of aperture width on navigation asymmetries for miniature remote-controlled vehicles. Journal of Experimental Psychology: Applied, 22(2), 225–237. https://doi.org/10.1037/xap0000078
- Nicholls, M. E. R., Loftus, A., Mayer, K., & Mattingley, J. B. (2007). Things that go bump in the right: The effect of unimanual activity on rightward collisions. Neuropsychologia, 45(5), 1122–1126. https://doi.org/10.1016/j.neuropsychologia.2006.07.015
- Nicholls, M. E. R., Loftus, A. M., Orr, C. A., & Barre, N. (2008). Rightward collisions and their association with pseudoneglect. Brain and Cognition, 68(2), 166–170. https://doi.org/10.1016/j.bandc.2008.04.003
- Oldfield, R. C. (1971). The assessment of handedness: The Edinburgh inventory. Neuropsychologia, 9(1), 97–133. https://doi.org/10.1016/0028-3932(71)90067-4
- Robertshaw, K. D., & Wilkie, R. M. (2008). Does gaze influence steering around a bend? Journal of Vision, 8(4), 1–13. https://doi.org/10.1167/8.4.18
- Robertson, J. S., Forte, J. D., & Nicholls, M. E. R. (2015). Deviating to the right: Using eyetracking to study the role of attention in navigation asymmetries. Attention, Perception & Psychophysics, 77(3), 830–843. https://doi.org/10.3758/s13414-014-0813-1
- Rogeberg, O., & Elvik, R. (2016). The effects of cannabis intoxication on motor vehicle collision revisited and revised. Addiction, 111(8), 1348–1359. https://doi.org/10.1111/add.13347
- Sevigny, E. L. (2018). The effects of medical marijuana laws on cannabis-involved driving. Accident Analysis and Prevention, 118, 57–65. https://doi.org/10.1016/j.aap.2018.05.023
- Simmons, S. M., Caird, J. K., & Steel, P. (2017). A meta-analysis of in-vehicle and nomadic voice-recognition system interaction and driving performance. Accident Analysis and Prevention, 106, 31–43. https://doi.org/10.1016/j.aap.2017.05.013
- Simmons, S. M., Hicks, A., & Caird, J. K. (2016). Safety-critical event risk associated with cell phone tasks as measured in naturalistic driving studies: A systematic review and meta-analysis. Accident Analysis and Prevention, 87, 161–169. https://doi.org/10.1016/j.aap.2015.11.015
- Thomas, N. A., Churches, O., White, I., Mohr, C., Schrag, Y., Obucina, S., & Nicholls, M. E. R. (2017). An investigation of left/right rules on deviations while walking. PLoS One, 12(10), e0186171. https://doi.org/10.1371/journal.pone.0186171
- Turnbull, O. H., & McGeorge, P. (1998). M-8 lateral bumping: A normal-subject analog to the behaviour of patients with hemispatial neglect? Brain and Cognition, 37, 31–33.
- Virginia Tech Transportation Institute. (2015). SHRP2 Researcher Dictionary for Video Reduction Data Version 3.4. Blacksburg, VA.
- Zheng, X., Yang, Y., Easa, S., Lin, W., & Cherchi, E. (2020). The effect of leftward bias on visual attention for driving tasks. Transportation Research Part F, 70, 199–207. https://doi.org/10.1016/j.trf.2020.02.016