
ABSTRACT
Boundaries define space, impacting spatial memory and neural representations. Unlike rodents, impact in humans is often tested using desktop virtual-reality (VR). This lacks self-motion cues, diminishing path-integration input. We replicated a desktop-VR study testing boundary impact on spatial memory for object locations using a physical, desktop-VR, and head-mounted-display-VR environment. Performance was measured by comparing participant responses to seven spatial distribution models using geometric or walking-path metrics. A weighted-linear combination of geometric models and a “place-cell-firing” model performed best, with identical fits across environments. Spatial representation appears differentially influenced by different boundary changes, but similarly across virtual and physical environments.
KEYWORDS:
1. Introduction
Returning to a room to replace a recently collected object one might plausibly retrace one’s steps, using knowledge of the self-motion on the path to the place where the object should be replaced. Alternatively, one could walk to the location in the room that matches the visual memory from the wall boundaries or a specific feature in the room to locate where the object should be replaced. It is also plausible that all these strategies could be combined. Numerous studies have indicated that humans and animals use such strategies to recall spatial locations and navigate (Ekstrom et al., Citation2018; Gallistel, Citation1990; Hartley et al., Citation2004; Nyberg et al., Citation2022; O’Keefe & Nadel, Citation1978; Spiers et al., Citation2015). Returning to a location using processing of self-motion is referred to as path integration, whereas using visual information about the distance between walls or objects is referred to as a geometric strategy (Gallistel, Citation1990).
Much of our understanding of how geometry and path integration are used in spatial memory has come from studying “place cells” in the rodent hippocampus, which express localized activity in the environment, providing a neural foundation for a cognitive map (O’Keefe & Nadel, Citation1978). Seminal studies in the 1990s revealed evidence for both path integration and visual geometry driving place cell firing (Gothard et al., Citation1996; O’Keefe & Burgess, Citation1996). O’Keefe and Burgess (O’Keefe & Burgess, Citation1996) found that expansion and contraction of wall boundaries of an environment rats were foraging in had predictable stretching and compression of the location-specific activity of place cells, indicating that they were driven by the distance and allocentric direction to local wall boundaries. This led to the development of models seeking to explain the activity patterns as a set of boundary vector inputs (Burgess & O’Keefe, Citation1996; Grieves et al., Citation2018; Hartley et al., Citation2000). Such boundary vector codes have since been observed in place cells in more complex multi-compartmented environments (Duvelle et al., Citation2021; Spiers & Barry, Citation2015) and in the activity of the subiculum in rodents (Lever et al., Citation2009) and human medial temporal lobe recordings (Lee et al., Citation2018; Stangl et al., Citation2021). These are functionally relevant – rats with a lesion to hippocampus were impaired in finding goals based on environment shape cues but not visual features (McGregor et al., Citation2004). Further evidence for how boundaries impact on the neural representations of space has come from the study of “grid cells” in the medial entorhinal cortex, which show periodic repeating patterns of activity forming a tessellating array across the space of the environment. Compression and expansion of wall boundaries have been found to cause grid cell patterns to compress or expand in relation to the amount of change (Barry et al., Citation2007) and distort in a predictable manner when environments are transformed from rectangular to trapezoidal shapes (Krupic et al., Citation2015). Grid field locations and orientation are also highly dependent on environment symmetry (Stensola et al., Citation2015). Thus, rodent experiments manipulating the size and shape of environments have provided useful insights into how the brain represents space.
Given that place and grid cells are thought to underlie our long-term spatial memory and their activity patterns change in a predictable manner following expansions and contractions of the environments, a logical corollary is that human spatial memory should follow similar patterns of updating after an expansion or contraction of that environment. This assumption was tested by Hartley et al. (Hartley et al., Citation2004) who had humans learn the location of a stool and subsequently replace it in varying sized rectangular or square environments rendered in a desktop virtual reality (VR) environment. The resulting distributions of the replaced stool mimicked the characteristic stretched and compressed pattern of place cell firing and were best predicted by a model based on place cell activity relating the change in the distance to local walls in the environments. This “boundary proximity” model predicted stool replacements to maintain fixed distances to nearby walls for the stool found near boundaries or during room expansions, and fixed ratios of distances between opposing walls for more central placement of the stool or during room contractions. This was true even for disorientated responses, when participants appeared to apply geometric spatial metrics to the wrong axes of the environment, suggesting an independence of location and orientation estimation processes (Hartley et al., Citation2004). Indeed, other studies using immersive head-mounted-display (HMD) VR have also highlighted the influence of boundary geometry for spatial orientation (Kelly et al., Citation2009). Spatial memory tasks in HMD-VR enable use of body-based self-motion cues. Participants either walk across the room or can walk on a static foot-tracking frame that allows walking patterns to simulate movement (Diersch et al., Citation2019). These experiments have also provided evidence that changes in spatial memory after non-orthogonal (e.g. trapezoidal) changes to the wall boundary layouts can additionally be explained by models using the expansion and contraction observed in grid cell activity (Bellmund et al., Citation2020).
While VR has significantly advanced our understanding of human spatial memory, it remains unclear how the influence of boundaries replicates across virtual and physical environments (Montello et al., Citation2004; Richardson et al., Citation1999). Manipulating boundaries in physical spaces presents a host of practical problems that are solved by VR, such as instantaneous environmental manipulation without wear and tear of materials that can introduce additional spatial cues that are hard to control for. Desktop-VR is specifically compatible with functional magnetic resonance imaging (fMRI), within which virtual movement is controlled by a joystick or arrow keys and self-motion information is derived from optic flow only (Ekstrom et al., Citation2018; Epstein et al., Citation2017; Spiers & Barry, Citation2015). Conversely, HMD-VR purportedly offers a higher degree of environmental presence and allows for body-based self-motion cues such as vestibular and proprioception feedback (Klatzky et al., Citation1998; Sousa Santos et al., Citation2009), but see (Feng et al., Citation2022). Both have been critical in elucidating the brain–behavior relationships of navigation (Keinath et al., Citation2021; Shine et al., Citation2016). However, the specific advantages of different VR environments to explore boundary manipulation are only relevant if they faithfully recapture the spatial memory processes used by humans in physical environments. A large body of work has already addressed this knowledge gap, comparing different aspects of spatial memory such as the influence of environmental deformations, visual cue conflict and wayfinding strategy across either one VR type and physical environments, or between desktop and immersive-VR environments (Feng et al., Citation2022; Keinath et al., Citation2021; Kimura et al., Citation2017). However, few studies have compared the impact of boundaries on human spatial memory across all three.
Given the dependence of neural firing and spatial behavior on boundaries, we sought here to compare how expansion and compression of square and rectangular wall boundaries might impact human spatial memory of a stool’s location in physical space, desktop-VR and HMD-VR. We were able to leverage the use of the engineering facility PAMELA (Pedestrian Accessibility Movement Environment Laboratory) to build a uniform, four-walled room with manually moveable walls, which we could then replicate virtually using high-precision laser scanning. Following the original Hartley et al. (Citation2004) experimental paradigm, we considered a range of geometric models that might predict human memory for the stool’s location, using either simple distance and angular spatial metrics or place cell firing activity. Based on evidence from Hartley et al. (Citation2004), we predicted that response distributions would be best accounted for by models using a fixed distance or fixed ratio to the walls depending on the stool location and if the room was expanded or contracted (i.e., the boundary proximity model formulated in Hartley et al. (Citation2004)). We then aimed to explore the contribution of body-based self-motion cues by examining whether HMD-VR response distributions and predictive model fits would be more similar to the physical space or desktop-VR, and whether additional path-integration based models could effectively capture response distributions across the environments. Our experiment also serves to highlight the challenges of conducting real-world experiments where time is required to manipulate real-world structures which lower the number of behavioral observations that can be made.
2. Methods
To test how different distortions of environment layout affect human memory and how this might differ between a physical and a virtual environment, we investigated memory of stool location and the impact of spatial geometric distortion thereupon in a) a physical “real-world” environment (Physical), b) an immersive virtual reality environment (HMD-VR), and c) a non-immersive virtual reality environment (Desktop-VR). Due to challenges caused by multiple testing sites spread across London (UK) we tested three different participant groups in each environment (). In all environments, we consistently changed the environmental boundaries twice in two separate trials; first, the learning environment was changed from an initial “small” setup (2.4 m × 2.4 m) to the testing environment’s “large” setup (4.8 m × 4.8 m). The learning stage stool was placed at 1.95 m × 0.3 m relative to the 0,0 position of the Southwest corner. Second, the learning environment was changed from a “large” setup (4.8 m × 4.8 m) to a “tall” testing environment (2.4 m × 4.8 m) and the learning stool placed at 2.9 m × 2.9 m relative to the 0,0 position. All stool positions and transformations were identical across participants who participated one at a time. For each trial, all learning phases were completed by participants before placement phases began. There was a consistent gap of 30–45 minutes between phases across all environments tested.
Table 1. Overview of study protocol across environments.
In all environments, we used stool position tracking before and after spatial changes had been made to calculate which models were used and then compared these both across participants and across trials. All participants gave informed, signed consent to participate and were compensated £10 for the experiment. Ethics approval was given by the UCL ethics committee (Project Number: CPB/2013/015).
2.1. Environment one – physical environment
2.1.1. Methods
2.1.1.1. Materials
A four-walled testing environment was erected on a hydraulic platform at the UCL PAMELA research facility. The walls of the enclosure were made of four plywood panels, each wall 4.8 m wide × 2.4 m tall (see ). The panels were painted white and had furniture gliders attached to their base in order to be able to move walls easily on an anthracite carpet we installed on the platform. Given the difficulty of manually moving the four walls in the physical PAMELA environment, only two transformation types could be implemented. Furthermore, given the time required to physically move the walls and group testing of participants, trials were always completed by participants in the same order and were not randomized. This differs from Hartley et al. (Citation2004), where 16 transformations were used in different orders. However, from our pilot experiment, we found two trial types were sufficient to dissociate model fits from predictions of the different models. The three configurations used here were selected from the configurations tested in the pilot study and the transformation types designed to optimally test predictions from the Boundary Proximity Model. The “large” room configuration was 4.8 m × 4.8 m; the “tall” room was 2.4 m (wide) × 4.8 m (tall); and the “small” room was 2.4 m × 2.4 m. During the physical pilot, we also performed control trials where participants were replaced into the room without manipulation of the boundaries to confirm that they could represent an unmarked location and return to it. This was conducted in the large 4.8 m × 4.8 m room configuration. Participants could replace the stool with a high degree of accuracy: around half of participants placed the stool less than ~50 cm away from the correct location, and only one participant placed the stool outside a radius of 1 m away. In order to better differentiate path integration from the other models, different corners of the room were used during the encoding and test phases.
Table 2. Definitions of predictive spatial models.
Figure 1. Apparatus, procedure and model predictions.
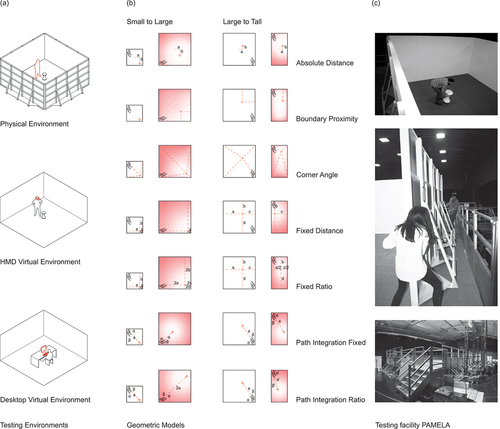
It was necessary to provide a way for participants to orient themselves globally, as they entered the environment from a different corner in each phase while blindfolded (comparable to the procedure of teleporting in desktop VR followed in Hartley et al. (Citation2004)). Hartley et al.’s experimental design used a mountain range projected at infinity as a directional cue. In a physical setup, this mode of operation is not feasible. Projecting a panorama onto the wall would provide a landmark rather than distal cue, which would result in an environmental feature rather than a constant, allowing participants to orient within the environment. We used PAMELA’s programmable LED lighting to light one side of the room in amber as an orientation cue. The row of amber lights remained constant throughout the experiment and provided a non-geometric and non-landmark cue. A blackout curtain was suspended from above, obstructing views of the surrounding cues within the research facility.
The object used for both learning and recall was a stool (white Tam Tam plastic stools from Habitat). The stool is easy to hold even when blindfolded and provides no misleading (or otherwise) orientation cues to the participant. It was chosen due to its specific rotational symmetry along the vertical axis, eliminating the question of stool orientation. The stool had a diameter of 31 cm at the widest section and a height of 45 cm.
In future research, it would be useful to vary the directional cue. Here, it was a light source above the wall in one direction. In trial 2, this allowed visually for a clearer disambiguation between the two possible directions of compression in wall axes. Future studies might explore the presence of the cue and its strength to explore its impact on placements of the stool.
Twelve “Optitrack” cameras were used to track the final location of the stool. To enable this to work properly, there were three retro-reflective markers on the top of the stool arranged in a straight line. The cameras tracked the location of both the stool and the participant (wearing a hat with markers), both reflecting infrared light. The data was recorded using the software “Motive.” As a backup to the tracking system failing – as evidenced in the pilot study – a video camera was placed above the center of the room so that the final stool location could be estimated from video footage.
2.1.1.2. Participants
A total of 29 participants (18 female, 11 male; average age 40/44.8 years, SD = 15.5/15.7) were recruited from the student and staff population at University College London. One participant was older than the required age range (18–65) and was excluded from the results. Another participant was partially sighted and therefore was also excluded.
2.1.1.3. Procedure
In each session of the study, groups of participants (between 6 and 9) gathered in the waiting room for an induction. An experimenter explained the task and answered questions. Instructions were to memorize the position of the stool, which they would then have to replace at a later stage. Participants were encouraged to perform as quickly and accurately as possible and were not informed about potential manipulations to the room geometry or different starting locations per trial at any point.
To replicate the teleporting used by Hartley et al. (Citation2004) in the physical environment and to ensure that participants could not use spatial information from outside the testing enclosure to situate and orient within an environmental reference frame, participants were blindfolded before leaving the waiting area and led into and out of the testing area by an experimenter. They were also disoriented by guided turning on the spot before and after being in the testing room to ensure that they could not use self-motion cues to deduce reference information from outside the room.
Two transformations were used: small room configuration to large configuration (Trial 1) and large configuration to tall configuration (Trial 2), both involving a learning and placement stage (). In the learning stage, individual participants were led to the starting position in a corner of the room facing the center. They removed their blindfold when a beep noise sounded. They retrieved the stool, put the blindfold back on and notified the experimenter who then led them out of the room. In the waiting period, the testing room’s size and shape were changed; participants were prevented from interacting with each other to maintain independency of results. Participants reentered the room similarly blindfolded but at a different corner starting position and facing the walls while holding the stool. They replaced the stool where they remembered it to have been before, and again left the room guided by an experimenter. Starting positions were the same across all participants, unlike the main experiment of Hartley et al. (Citation2004). The experimental task lasted approximately 1.5 hours.
Future work could benefit from a mix of strategies including verbal reports, debriefing interviews, and measurements of participant behavior.
2.2. Environment two – head-mounted display immersive virtual environment
2.2.1. Methods
2.2.1.1. Materials
The virtual environment consisted of high-fidelity point clouds obtained from 3D laser scans of the physical environments, rendered with a bespoke GPU-based point cloud renderer. 3D scanning was performed with a Faro Focus X330 laser scanner. The scanned floor was substituted by a texturized plane to circumvent the otherwise missing points resulting during scanning from the scanner’s blind spot beneath it. The VEs were rendered in a HTC Vive Developer Edition at 1:1 scale in Unity at 90FPS with a vertical FOV of 60 degrees. The HTC Vive Developer Edition base stations were placed in opposite corners of the 4.8 m × 4.8 m surface area (corresponding to the largest room configuration).
Participants used one HTC Vive Developer Edition wireless controller throughout the study. In each trial, the application would always begin with an empty virtual space where only the virtual controller was visible. Participants could then begin the corresponding stage of the experiment by pressing the front red system button. During each stage, participants could grab the stool by pressing the rear trigger whenever the controller was within a 5 cm range of the stool. By releasing the trigger button, the stool would then fall to the floor level and rotate to a vertical position. The object used in the study was a virtual replica of the white Tam Tam plastic stool.
2.2.1.2. Participants
A total of 39 participants (14 female, 25 male; average age 30.8 years, SD = 10.9) were recruited from the student and staff population at UCL.
2.2.1.3. Procedure
The virtual room, trial configurations and instructions were again identical to the physical setup. The experimental protocol was adapted for the VR trials to match the physical environment as closely as possible. The study was conducted in two different rooms at University College London: a waiting room and a VR testing room.
Participants were informed that they would be able to see the SteamVR chaperone grid when using the VR system. A Steam VR chaperone grid is a virtual grid that is automatically displayed when a VR user approaches within 0.4 m of the boundaries of a play area. They were told that this meant they were approximately 0.4 m away from the physical limits of the room and asked to ignore it when completing the experimental task. They were also shown a physical version of the Tam Tam white stool from Habitat. Prior to the two experimental trials, participants completed a practice trial. This was to ensure that they had a chance to familiarize themselves with the HTC Vive controller, as well as grabbing and placing the virtual stool without environmental distractions. The practice VR consisted of an empty space with a floor and a sphere (radius = 0.25 m). Participants were asked to navigate to the sphere and grab and release it as many times as needed until they felt comfortable with the interaction.
As in the physical environment, two trials were used, each involving a learning stage and a placing stage.
The experimenter disoriented (again by turning on the spot) and guided the participant to the starting location for the corresponding stage (using the HMD as a blindfold). Participants were disoriented to stop them from finding correspondences between the physical testing room and the VE. Starting locations were marked with tape in the testing room to help the experimenters place participants at the correct starting location and facing direction for each stage.
2.3. Environment three – desktop non-immersive virtual environment
2.3.1. Methods
2.3.1.1. Materials
The immersive VR environment was reprogrammed into a desktop navigable environment. Participants used a mouse and keyboard to navigate the desktop environment; keyboard arrow keys allowed participants to move forward and backward, left and right, movement of the mouse provided means to alter their viewpoint on a 360° axis around themselves, so that movement and gazing in all directions was possible. Left clicking the mouse would pick up the stool when standing within 5 cm of it, and right clicking dropped it in front of them. The computer used for the task was situated on a desk within a small testing room (2 m × 4 m × 3 m). In order to replicate a feeling of isolation within the four-walled room, the room was darkened completely apart from the monitor screen. As the experiment was run in the evening, no light came through the windows and the blinds were drawn to remove external distractors.
2.3.1.2. Participants
A total of 44 participants (24 female, 20 male; average age 27 years, SD = 9.0) were recruited from the UCL online psychology participant pool.
2.3.1.3. Procedure
The virtual room, trial configurations and instructions were again identical to the physical setup, as well as the immersive VR setup. The experimental protocol was adapted for the desktop trials to match the physical and immersive VR trials as closely as possible.
Participants had an opportunity to practice using the controls on a laptop in the waiting room. Participants had to pick up the stool and repeatedly move it between two black circles in the virtual room until comfortable with the controls.
Testing in the Desktop-VR environment was conducted in two rooms at University College London, a waiting room and a testing room. Participants were led individually from the waiting room to the testing room and similarly disorientated by an experimenter to ensure continuity with the other two environments.
2.4. Models
The geometric models considered were Absolute Distance (AbsDist), Corner Angle (CorAng), Fixed Ratio (FixRat), Fixed Distance (FixDist), and Boundary Proximity (BoProx) as a weighted combination of the previous two from Hartley et al. (Citation2004). In addition, we considered Path Integration Fixed (PathIntFix) and Path Integration Ratio (PathIntRat), see and . Environments were discretized into unit bins spanning 160 × 160 bins for the large square down to 80 × 80 bins for the small square environment. In the boundary proximity model the constant c = 128 as in Hartley et al. (Citation2004). The similarity distributions for each model were converted into probability distribution using a softmax function with a temperature parameter set to 1.
Despite the original Hartley et al. (Citation2004) task design aim to minimize contributions of path integration to remembering the location of the stool (i.e., by disorientating participants between learning/placement stages, using different starting locations for learning/placement stages and using desktop-VR with keyboard/mouse controlled movement), we included these walking-based models given the availability of body-based self-motion cues to participants during the HMD-VR and Physical environments here.
In Trial 1, uniform changes are made both horizontally and vertically, resulting in a displacement of the Gaussian distribution. In Trial 2 non-uniform changes are only made horizontally, resulting in a displacement and a compression of the Gaussian distribution along its horizontal axis.
2.5. Statistical analyses
To assess which model best fit participants’ replacement distributions in a similar manner to Hartley et al. (Citation2004), we first converted each model distribution into a probability density function (pdf) by normalizing it so the sum of its pixels equals one. We defined the Fit Value (FV) as the value of the pdf at the position of each placement. The FV of placement (x,y) for model M is FV = Mpdf(x,y). We then computed an average FV for each model and each environment (see , column d). The higher the FV, the better fit the model. Akin to Hartley et al. (Citation2004) we adopted this approach to provide a more comprehensive and accurate analysis of the distribution of the placements in comparison to the model rather than simply the displacement distance to the single point predicted at the center of each model.
Figure 2a. Results trial 1, small to large. Top left row shows data folding operation.
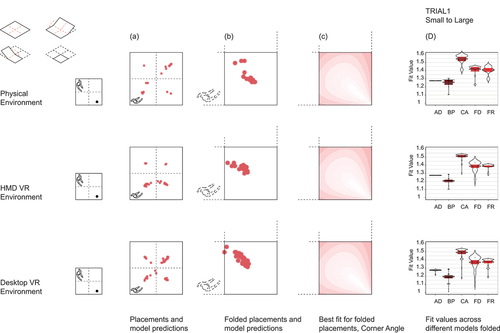
Figure 2b. Results trial 2, large to tall. Top row left shows data folding operation.
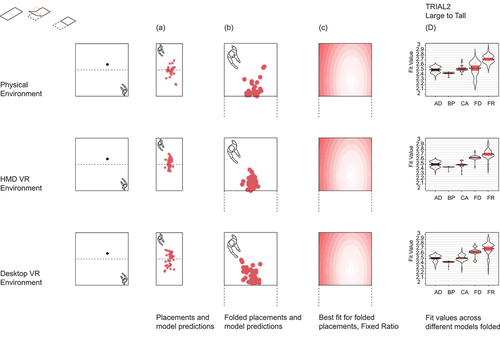
We ran two sets of analyses; in the first, we used raw participant replacement distributions. However, upon visual inspection of the raw data, we noted a high degree of disorientation in which some participants appeared to replace the stool relative to the wrong corner, i.e., applying geometric principles such as fixed distances or corner angles to opposite or adjacent walls of the room to where the stool was originally found (see Section 3.2). These raw placements were scattered across the four quadrants of the Trial 1 test room and across the two halves of the Trial 2 test room, resulting in FVs with large variances that rendered statistical analyses of the raw placement data less appropriate. Due to the symmetry of the environments and ability to reflect any coordinate about the center of the room, we decided to fold replacement distributions into the “matching” orientated stool quadrant or half to simulate orientated responses (see ). Hartley et al. (Citation2004) performed a similar standardization procedure to account for different cue locations across participants. However, because walking paths to learn the location crossed quadrants, path integration models (where placement was based on recalling the path walked in learning) were not valid for the folded data and so were only considered for the raw data. Given much better agreement of the folded replacement distributions with geometric model predictions, we ran a second set of analyses on these folded data for the main statistical results in Sections 3.1. For Section 3.2 and 3.3, we present analysis of the unfolded data using correlations between participant distributions and between participant distributions and predictive geometric/path integration model distributions. Instead of folding, we also tried to rotate the replacement positions into the matching orientated stool quadrant. Rotated and folded replacement distributions led to very similar results (see Supplementary Figure S1). In the following, we decided to only present results based on the folded distributions.
To perform correlations, we first smoothed the distributions of participants’ placements and the distribution of the models’ predictions using a Gaussian smoothing kernel with 20 cycles/image to reduce the binary nature of the pixels. We then computed 2-Dimensional Pearson’s correlation coefficients between the smoothed distributions.
In Section 3.1, for each trial using the folded data, we performed a 2-way ANOVA on FV of the placement distribution using environment (Physical, Desktop-VR and HMD-VR) as between subject factors and model as within subject factors. Bonferroni-corrected post-hoc pairwise comparisons using t-tests with pooled standard deviations were used to compare differences of between and within subject factors. Trials were also explored together using standardized FVs to account for different FV ranges (M = 0, SD = 1). We checked which model best accounted for participant distributions using a least square regression of the models’ pdf on the placements’ pdf, in each trial and environment, and included a weighted linear combination of all models.
3. Results
3.1. No one model explains human spatial representation
Participants were asked to memorize the location of a stool in a room and replace it after modification to the room geometry (Trial 1: small square to large square, Trial 2: large square to tall rectangle). We aimed to establish if previously defined models of human spatial memory (; Hartley et al., Citation2004) based on work in Desktop-VR could explain how participants replaced the stool, and if this replicated across physical and virtual environments. Based on Hartley et al. (Citation2004), we expected models based on fixed distances and fixed ratios of distances between the stool and the room walls best explain the replacement distributions.
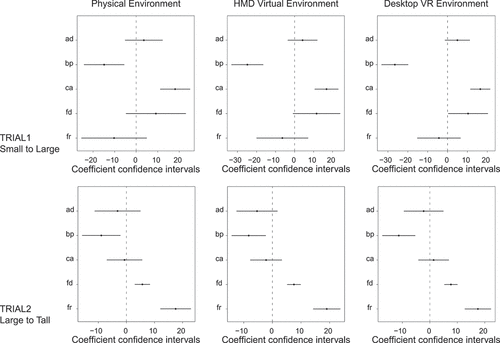
For Trial 1, 86.3% of the participants’ folded placements were best accounted for by the CorAng model. We performed a mixed 2-way ANOVA on the fit values (FV) of the 1st trial with environment as a between-subject factor and model as a within-subject factor. Both model (F(4,622) = 121.21, p < .001) and environment (F(2,622) = 17.34, p < .001) yielded a significant effect. Bonferroni-corrected pairwise comparisons showed that all models were significantly different from each other (all p < .001), except FixRat and FixDist (p = 1). As shown in , column D, on average CorAng was the best model and BoProx the worst. Model FVs for Physical environment significantly differed from Desktop-VR (p = .01) but not from HMD-VR (p = .24), though the overall pattern of model fits was identical across all environments (). HMD-VR and Desktop-VR model fits did not differ from each other (p = .66).
In Trial 2, 62.7% of the participants’ folded placements were best accounted for by the FixRatio model. Model yielded a significant effect (F(4,634) = 46.46, p < .001) but environment only a trend effect (F(2,634) = 2.84, p = .06). Pairwise comparisons showed that all models were significantly different from each other (all p < .001), except CorAng and AbsDist (p = 1). As shown in , column D, on average FixRat was the best model and BoProx the worst. The different environments did not significantly differ from each other in FVs (HMD-VR vs Desktop-VR: p = 1, HMD-VR vs Physical: p = .94, Physical vs Desktop-VR: p = .37).
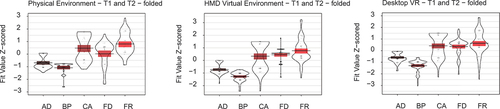
To examine which model best fit participants’ folded placements across both trial types together as a more general account of human spatial memory (in line with the original Boundary Proximity model), we collapsed Trial 1 and Trial 2 together with z-scored FVs. This revealed FixRat best fit both trials across all environments, with other models performing similarly except for CorAng which fit better in the Physical environment ().
Figure 3. Violin plots of Z-scored fit values for predictive models on trial 1 and trial 2 pdf collapsed together, shown for each environment separately.
Lastly, given these varied findings, we examined the explanatory value of combining models using linear regressions. The outcome variable is the smoothed folded placements’ pdf, while the predictors are the models’ distributions. Overall, for both Trial 1 and 2 across all environments, pooling all the models’ predictions together (lin_all_models) explained more of the variance in the placements’ pdf than the best performing model’s pdf alone (CorAng in Trial 1 and FixRat in Trial 2, see ). For Trial 1 in the Physical environment, lin_all_models accounted for 2.8% of the variance in participants’ placements while CorAng accounted for 1.8%; in Desktop-VR lin_all_models accounted for 4.9% of the variance while CorAng accounted for 2.3%; in HMD-VR lin_all_models accounted for 3.2% of the variance while CorAng accounted for 1.5%. For Trial 2 in the Physical environment, lin_all_models accounted for 12.7% of the variance in the placements’ pdf while FixRat accounted for 7.9%; in Desktop-VR lin_all_models accounted for 14.4% while FixRat accounted for 7.8%; in HMD-VR lin_all_models accounted for 13.3% while FixRat accounted for 6.9%.
Figure 4. Coefficients from least square regression of models’ pdf on smoothed and folded participant placements’ pdf for each trial and environment.
3.2. HMD-VR and desktop-VR spatial distributions of responses are more similar to each other than to physical
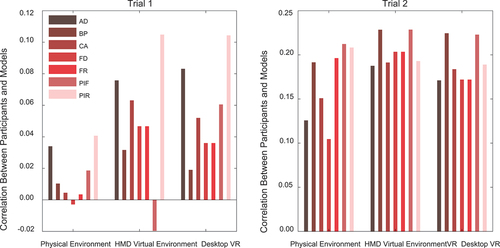
Notwithstanding the replication of Hartley et al. (Citation2004), this study further aimed to compare human spatial memory across different environments. Given Physical and HMD-VR environments have shared availability of walking, but HMD-VR and Desktop-VR have a shared virtual experience, we asked how their placement distributions would compare. While model fits for the folded data suggested largely similar strategies across environments when disorientation was accounted for, we further examined consistency between environments by correlating the raw, unfolded spatial distributions of participant responses (pdf values per pixel) per experiment.
All environment distributions were significantly correlated with each in both Trial One and Two (, p < .001). While correlation coefficients were generally higher for Trial 2 (which also showed better R2 model fits than Trial 1 above), the two VR environments showed higher coefficients across both trials (r = 0.90 and r = 0.79, respectively). Note that when we compare correlation coefficients we simply mean to reference the numerical difference, we did not run any statistical test to compare the strengths of the correlations.
Table 3. Correlation coefficients between raw, unfolded participants’ placement distributions in the three types of setup in (a) trial 1 and (b) trial 2.
To better understand the smaller correlation coefficients between Physical and both VR environments in Trial One, we examined if the precision of distance estimation contributed to differences between them, noting on visual inspection of both the raw and folded data that the Physical distributions appeared more proximal to the walls than in the VR. By measuring the distance between the pixel with the highest density of placements and the nearest two walls per environment in the folded data of both trials, we found indeed that Physical placements were on average closer to the walls than other environments in Trial 1 but not Trial 2 ().
Table 4. Distances (number of pixels) between the pixel with the highest density of replacements and the two nearest walls in (a) trial 1 and (b) trial 2 using folded data.
3.3. Path integration contributions in the unfolded data
Finally, we aimed to understand the impact of path integration across environments using the unfolded data. Despite very poor fit to the models in the raw data we aimed to assess the influence of walking in HMD-VR and Physical for completeness of comparing environments. Using 2-Dimensional Pearson’s correlation coefficients, we explored how path integration (PI) and geometric-based model distributions compared to the raw unfolded data. Across all environments, PathIntFix best correlated with the raw placement distributions for Trial 1. For Trial 2, both PI models correlated best for Physical and second best for the VR environments behind the BoProx model ().
Figure 5. Correlations between distributions of participant group responses and geometric/path integration models for raw unfolded data across environments.
The comparable correlation coefficients of PI-based models in the Desktop-VR and Physical environments suggests no strong influence of body-based self-motion cues to performance. However, Physical environment coefficients for all models were generally poorer than for both VR environments, especially for Trial 1. To examine this in greater detail, we assessed levels of disorientation and replacement variance across environments and trials. This was prompted by visual inspection of the raw data in Trial 1, which shows four clusters of responses in each room quadrant that suggest application of geometric principles to the wrong axes of the room and thus disorientation of some participants relative to the amber lighting cue. We quantified the proportion of responses in the “matching” quadrant per environment – namely, the quadrant of the room in which the stool was originally found () – which revealed greater disorientation for the Physical environment, where only 8.7% of responses were seemingly placed close to the correct walls (). Furthermore, we found that the Physical Trial 1 had the greatest variance of all environments and trials, with the lowest consistency between individuals in estimating the location of the stool ().
Table 5. Disorientation and consistency between results per trial across environments for raw data.
4. Discussion
We had participants learn the location of a stool in a room and subsequently replace it after we manipulated the boundary size or geometry. We repeated this in a Physical, Desktop-VR and head mounted display (HMD) immersive-VR room and compared participant response distributions to seven different models of spatial representation. Based on previous findings relating human spatial memory to a model of place cell firing (Hartley et al., Citation2004), we predicted participants would use a model of fixed distances between the stool and the two nearest walls to complete Trial 1, and a model of fixed ratios of distances between the stool and all four walls for Trial 2.
Firstly, results showed that indeed a Fixed Ratio model best fit response distributions for Trial 2, but response distributions for Trial 1 were better accounted for by a Corner Angle model using the angles subtended between the stool and the four room corners. Secondly, this pattern of model fits was identical across Physical, Desktop-VR and HMD-VR environments. Finally, closer examination of the response distributions themselves showed varying rates of axis disorientation and between subject consistency across the two transformation types. Thus, while different small-scale boundary manipulations differentially influence human spatial memory, this influence is similar across virtual and physical environments.
4.1. Replications of Hartley et al. (Citation2004)
Our findings partly replicate Hartley et al. (Citation2004) on several levels. Fixed Ratio and Corner Angle models performed second and third best respectively in their Desktop-VR only study. The similarly good models’ fit here across Desktop-VR, HMD-VR and Physical environments underscores the dependence of human spatial representation on distance and proportion information. These specific models better capture the shape of responses distributions by allowing for stretching or skewing of responses, unlike Absolute Distance or Fixed Distance which are symmetrical by nature (Hartley et al., Citation2004).
Fixed Ratio is a model inspired by the influence of boundaries on place cell firing. By replicating the Fixed Ratio model’s predictive power not just for Trial 2 but also for both Trials collapsed together across the three environments corroborates the idea that aspects of spatial behavior may relate to the neural dynamics in the hippocampal region. Indeed recently, an HMD-VR study also similar to Hartley et al. (Citation2004) showed distortions in participant stool replacements following boundary manipulations were dependent on which boundary was most recently visited, and this was identical to findings of grid cell distortions in parallel rodent studies (Keinath et al., Citation2018, Citation2021). Additionally, non-orthogonal boundary distortions resulted in corresponding non-orthogonal distortions to both rodent grid cell firing and human spatial memory representations (Bellmund et al., Citation2020; Krupic et al., Citation2015).
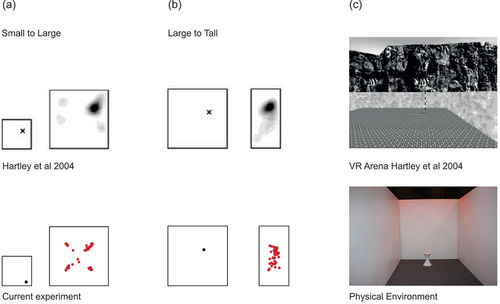
Another point of replication is the high level of participant disorientation seen here and in the second experiment of Hartley et al. (Citation2004). Their second experiment more closely resembled our protocol in which they also used the same learning stage stool position across participants. Comparing Hartley et al. (Citation2004) experiment two trials with similar transformations and stool positions to Trial 1 and 2 here reveals remarkably similar response distributions to our unfolded data; four clusters of disorientated replacements for Trial 1 and an elongation of replacements for Trial 2 (). This is notable considering their more salient mountain orientation cue. Boundary geometry and facing direction during encoding may therefore be as critical to orientation as specific directional cues (Cheng & Newcombe, Citation2005; He et al., Citation2018; Zhou & Mou, Citation2019), which originally was shown in children (Hermer & Spelke, Citation1994) and more recently explored in adults (Kelly et al., Citation2009). This may explain the variation in participant consistency and disorientation between Trial 1 and Trial 2, in which Trial 1 involves a symmetrical square test room but Trial 2 a more geometrically informative polarized rectangular environment.
Figure 6. Comparison of results between Hartley et al. (Citation2004) and our results.
Some differences to Hartley et al. (Citation2004) were found here. Principally, we found a poor fit of their overall Boundary Proximity model (of which Fixed Ratio is a component) and best overall fit of weighted linear combination of all models which was not examined in their study. One possibility for the poor fit of the Boundary Proximity model here could be limitations in our protocol. Here, we (A) used the same rather than varied learning stage stool location across participants, (B) were limited to two transformation types and (C) had high levels of participant disorientation necessitating that we fold the response distributions for analysis. These factors may disrupt the effectiveness of the Boundary Proximity model, which was able to predict behavioral responses based on the interaction of multiple stool placements and transformation types as used in Hartley et al. (Citation2004). Although we a priori chose transformation types that theoretically should maximize the ability of Boundary Proximity model to capture response distributions, we were unable to use more transformation types or stool placements owing to the study design with the Physical environment; the first iteration in the Physical environment in PAMELA involved manual moving of walls which was time and energy intensive, making it difficult to repeat multiple trial types per participant. Unfortunately, Hartley et al. (Citation2004) did not fit the Boundary Proximity model to their experiment two data, which also has the same stool placement across participants.
The best fit of the weighted linear combination of all spatial models potentially reflects the larger inter-individual variation in determinants and strategies in human spatial representation (Coutrot et al., Citation2018; Hegarty & Waller, Citation2005; Hegarty et al., Citation2022; Spiers et al., Citation2021). Indeed, one advantage of our study over Hartley et al. (Citation2004) is the much larger and more heterogeneous study population in terms of age and gender. Unfortunately, the sample sizes did not permit us to explore differences in model fits across these sub-populations.
4.2. Contribution of path integration
We aimed to expand on the Desktop-VR based findings of Hartley et al. (Citation2004) by exploring the impact of path integration to remembering the location of the stool. We included both a Physical and HMD-VR replication of the Desktop-VR task where participants had full access to natural walking rather than mouse and keyboard-controlled motion. Previous findings show path integration based distance estimates are influenced by boundary expansion and contraction (Chen et al., Citation2015). Our path integration models made predictions that the stool should be replaced across quadrants from the starting location, which are only interpretable in the unfolded raw data where placement was based on recalling the path walked in learning. Because the raw data patterns implied participants were disoriented with regard to direction, we largely examined the folded data which precluded the path integration models. While the path integration models showed a higher correlation than other models with the stool placement patterns in the raw data, these correlations were relatively low. This suggests a larger contribution of path integration strategy, but it is difficult to evaluate how valid this effect is in the context of high disorientation levels that likely contribute to artificially lower correlations of the geometric models. It is possible that with some disorientation in an ambiguous environment, participants defer to memory of previous paths to remember locations – as observed in a study that unexpectedly removed environmental landmarks during a homing task (Zhao & Warren, Citation2015), and another study that put visual cues in conflict with path integration (Sjolund et al., Citation2018). Future research with clear orientation cues and a larger environment to increase the discrepancy between path integration models and geometric cues would be helpful in exploring this, as well as using participant tracking information to analyze trajectories prior to stool replacement. Another useful avenue is to put cues into conflict using HMD-VR. This has recently been used to examine estimates of distance and direction for a stool in a VR room, revealing evidence for the integration of both visual and proprioceptive information to determine the location of an object (Scarfe & Glennerster, Citation2021).
4.3. Consistency across physical and virtual environments
We found a remarkable degree of concordance for model fits of response distributions across physical, desktop-VR and HMD-VR, suggesting similar use of distance and proportion information to perform the task despite differences in availability of body-based cue information. However, when comparing the response distributions themselves, we found subtle differences in distance estimation and disorientation. Physical responses were slightly closer to the walls than in our VR environments, replicating known under-estimation of distances due to differences in depth perception in virtual environments (Jones et al., Citation2008; Wann et al., Citation1995). HMD-VR responses were more consistent between participants than either Physical or Desktop-VR responses, which may have been due to the VR Steam software chaperone grid that appears as a safety mechanism when participants moved within 0.4 m of the play area boundaries to prevent wall collisions (although importantly, this did not lead to different distances between the predominant participant replacement location and the two nearest walls relative to the other two conditions without the chaperone grid). Despite these variations, all environment responses conserved the relative distances between the two walls, revealing unperturbed estimates of proportion.
The greater participant variation in the Physical environment, especially with the more ambiguous Trial 1 geometry, is likely due to greater participant axis disorientation, as reflected in very low proportions of replacements in the “matching” Physical room quadrant. One explanation for lower rates of VR disorientation is the novelty of interacting with VR environments (this study was run in 2015). This may have prompted participants to look up more to fully explore their environment and therefore become more aware of the lighting cue, but we cannot confirm this without heading angle tracking. However, these findings replicate a separate study showing that, when geometric and featural cues were in conflict, participants in HMD-VR were more likely to weight the featural cue over geometry than in the physical version (Kimura et al., Citation2017).
In sum, findings here support the general use of VR for small-scale spatial memory tasks. This is important, considering VR experiments are easier and less time-consuming to run than physical experiments, especially the Physical environment here. This reflects broader evidence which indicates that similar brain activation patterns occur during spatial memory retrieval of a large environment when either immersive-VR with body-based cues was used or not (Huffman & Ekstrom, Citation2019). Despite this convergence, it is still important to consider that neuropsychological or architectural research studies may opt for HMD-VR, due to the purported higher degree of environment presence due to access to physical motion with less sensory conflict (Weech et al., Citation2019). HMD-VR may also be particularly useful in examining head-scanning behavior in future studies.
However, findings from more complex and large-scale wayfinding tasks are conflicting, and often depend on the task goal and outcome metrics (Sousa Santos et al., Citation2009; Srivastava et al., Citation2019). Analogous to findings here, large scale (500 m routes or longer) environmental knowledge acquisition experiments show that in conditions of similar visual information but varying availability of body-based cues, systematic biases in participant learning errors were preserved across conditions (Waller et al., Citation2003, Citation2004). More complex environments are also associated with greater disorientation in virtual vs physical conditions (Richardson et al., Citation1999). Conversely, unlike findings here, the participants with unrestricted access to full-body cues and free visual exploration during environment learning had significantly higher orientation judgment of landmarks than the other groups learning under stationary conditions (Waller et al., Citation2004). Recently, a novel study compared HMD and Desktop-VR wayfinding on a battery of different tasks in a multi-story building with different rooms. Findings showed Desktop-VR users looked around less, traveled faster and with shorter distances (Feng et al., Citation2022). However, overall route choice was similar, and more critically, user experience in perceived presence, usability, cybersickness or realism was identical between the two groups. Such large-scale studies with multiple task components will be key to mapping consistent differences between physical, desktop and immersive virtual environments, such as depth perception, travel time/distance estimates (Brunec et al., Citation2017) and map drawing (Jafarpour & Spiers, Citation2017) which will enable informed future choices between environments for a given task.
4.4. Limitations and future directions
Our study had a number of limitations which are important to consider. Firstly, we had a small number of trials per participant. This was necessitated by practicalities of running the study at the PAMELA research site, where moving the walls required a small team and access to the site was variable. This small number of trials also meant that we tested the same stool positions relative to the geometry in trial 1 and 2. In future research, it would be useful to probe a range of positions and repeated positions across scales. Furthermore, because we conducted research in three different sites across three different timepoints, our average age and gender ratio differed between environments. This was caused by the opportunity sampling of participants at the sites. It is thus possible that some of the differences between the environments might be mediated by gender and/or age effects. However, we note that we are unaware of any study reporting strong effects of age or gender for this relatively small-scale replacement test. Finally, the scale of change in this study was limited by the size of the environment that could be constructed and manipulated. Future studies would benefit from larger space manipulations and geometric changes beyond simply scale and compression. These would help provide greater differentiation between the models.
In a future paradigm, it would be useful to train participants to criteria on being able to place the stool when no change in the environment occurs and then conduct the manipulations. We did not do this in the current study due to time constraints in the physical testing space.
5. Concluding remarks
This study aimed to investigate how manipulation of wall boundaries impacts human spatial memory of a stool’s location, and how this compares across physical and virtual environments. We found different boundary manipulations vary in how they affect human spatial memory in a small-scale room. Unlike previous findings upon which this study is based, the results here showed no single predictive geometric model of spatial representation could best predict responses. However, we do replicate findings that models derived from place cell firing can partially predict these responses and expand these to show this is consistent in Desktop-VR, HMD-VR and physical environments, despite differences in body-based cue availability. Overall, we show that Desktop and HMD-VR allow a good and interchangeable approximation for examining the varying impact of boundaries on human spatial memory in small-scale physical environments.
Author contributions
Fiona E. Zisch: investigation, writing – original draft & editing, project administration, visualization. Coco Newton: investigation, writing – original draft/review & editing, formal analysis, project administration. Antoine Coutrot: formal analysis, data curation. Maria Murcia: investigation, software. Anisa Motala: investigation. Jacob Greaves: investigation. William de Cothi: investigation, software. Anthony Steed: resources. Nick Tyler: resources. Stephen A. Gage: resources. Hugo J. Spiers: conceptualization, methodology, writing – review & editing, funding acquisition, supervision.
Acknowledgments
The authors wish to thank Nikos Papadosifos, Derrick Boampong, Tatsuto Suzuki, Biao Yang, Aaron Breuer-Weil, Christopher Crispin, Simon Julier, Sebastian Friston, Panos Mavros, Dominik Zisch, Charles Middleton, Rowan Haslam, Ludovico Saint Amour Di Chanaz and Thomas Reed. This work was supported by a UCL GRAND CHALLENGES GRANT and a James S. McDonnell Foundation Scholar grant awarded to Hugo Spiers. Declarations of interest: none.
Disclosure statement
No potential conflict of interest was reported by the author(s).
Additional information
Funding
References
- Barry, C., Hayman, R., Burgess, N., & Jeffery, K. J. (2007). Experience-dependent rescaling of entorhinal grids. Nature Neuroscience, 10(6), 682–684. https://doi.org/10.1038/nn1905
- Bellmund, J. L., De Cothi, W., Ruiter, T. A., Nau, M., Barry, C., & Doeller, C. F. (2020). Deforming the metric of cognitive maps distorts memory. Nature Human Behaviour, 4(2), 177–188. https://doi.org/10.1038/s41562-019-0767-3
- Brunec, I. K., Javadi, A. H., Zisch, F. E., & Spiers, H. J. (2017). Contracted time and expanded space: The impact of circumnavigation on judgements of space and time. Cognition, 166, 425–432. https://doi.org/10.1016/j.cognition.2017.06.004
- Burgess, N., & O’Keefe, J. (1996). Neuronal computations underlying the firing of place cells and their role in navigation. Hippocampus, 6(6), 749–762. https://doi.org/10.1002/(SICI)1098-1063(1996)6:6<749:AID-HIPO16>3.0.CO;2-0
- Cheng, K., & Newcombe, N. S. (2005). Is there a geometric module for spatial orientation? Squaring theory and evidence. Psychonomic Bulletin & Review, 12(1), 1–23. https://doi.org/10.3758/BF03196346
- Chen, X., He, Q., Kelly, J. W., Fiete, I. R., & McNamara, T. P. (2015). Bias in human path integration is predicted by properties of grid cells. Current Biology, 25(13), 1771–1776. https://doi.org/10.1016/j.cub.2015.05.031
- Coutrot, A., Silva, R., Manley, E., de Cothi, W., Sami, S., Bohbot, V. D., Wiener, J. M., Hölscher, C., Dalton, R. C., Hornberger, M., & Spiers, H. J. (2018). Global determinants of navigation ability. Current Biology, 28(17), 2861–2866.e4. https://doi.org/10.1016/j.cub.2018.06.009
- Diersch, N., Wolbers, T., el Jundi, B., Kelber, A., & Webb, B. (2019). The potential of virtual reality for spatial navigation research across the adult lifespan. Journal of Experimental Biology, 222(Suppl_1), jeb187252. https://doi.org/10.1242/jeb.187252
- Duvelle, É., Grieves, R. M., Liu, A., Jedidi-Ayoub, S., Holeniewska, J., Harris, A., Nyberg, N., Donnarumma, F., Lefort, J. M., Jeffery, K. J., Summerfield, C., Pezzulo, G., & Spiers, H. J. (2021). Hippocampal place cells encode global location but not connectivity in a complex space. Current Biology, 31(6), 1221–1233.e9. https://doi.org/10.1016/j.cub.2021.01.005
- Ekstrom, A. D., Spiers, H. J., Bohbot, V. D., & Rosenbaum, R. S. (2018). Human spatial navigation. Princeton University Press.
- Epstein, R. A., Patai, E. Z., Julian, J. B., & Spiers, H. J. (2017). The cognitive map in humans: Spatial navigation and beyond. Nature Neuroscience, 20(11), 1504–1513. https://doi.org/10.1038/nn.4656
- Feng, Y., Duives, D. C., & Hoogendoorn, S. P. (2022). Wayfinding behaviour in a multi-level building: A comparative study of HMD VR and desktop VR. Advanced Engineering Informatics, 51, 101475. https://doi.org/10.1016/j.aei.2021.101475
- Gallistel, C. R. (1990). The organization of learning. MIT Press.
- Gothard, K. M., Skaggs, W. E., & McNaughton, B. L. (1996). Dynamics of mismatch correction in the hippocampal ensemble code for space: Interaction between path integration and environmental cues. Journal of Neuroscience, 16(24), 8027–8040. https://doi.org/10.1523/JNEUROSCI.16-24-08027.1996
- Grieves, R. M., Duvelle, É., & Dudchenko, P. A. (2018). A boundary vector cell model of place field repetition. Spatial Cognition & Computation, 18(3), 217–256. https://doi.org/10.1080/13875868.2018.1437621
- Hartley, T., Burgess, N., Lever, C., Cacucci, F., & O’Keefe, J. (2000). Modeling place fields in terms of the cortical inputs to the hippocampus. Hippocampus, 10(4), 369–379. https://doi.org/10.1002/1098-1063(2000)10:4<369:AID-HIPO3>3.0.CO;2-0
- Hartley, T., Trinkler, I., & Burgess, N. (2004). Geometric determinants of human spatial memory. Cognition, 94(1), 39–75. https://doi.org/10.1016/j.cognition.2003.12.001
- Hegarty, M., He, C., Boone, A. P., Yu, S., Jacobs, E. G., & Chrastil, E. R. (2022). Understanding Differences in Wayfinding Strategies. Topics in Cognitive Science, 15(1), 102–119. https://doi.org/10.1111/tops.12592
- Hegarty, M., & Waller, D. A. (2005). Individual differences in spatial abilities. In P. Shah & A. Miyake (Eds.), The Cambridge handbook of visuospatial thinking (pp (pp. 121–169). Cambridge University Press.
- He, Q., McNamara, T. P., & Kelly, J. W. (2018). Reference frames in spatial updating when body-based cues are absent. Memory & Cognition, 46(1), 32–42. https://doi.org/10.3758/s13421-017-0743-y
- Hermer, L., & Spelke, E. S. (1994). A geometric process for spatial reorientation in young children. Nature, 370(6484), 57–59. https://doi.org/10.1038/370057a0
- Huffman, D. J., & Ekstrom, A. D. (2019). A modality-independent network underlies the retrieval of large-scale spatial environments in the human brain. Neuron, 104(3), 611–622.e7. https://doi.org/10.1016/j.neuron.2019.08.012
- Jafarpour, A., & Spiers, H. (2017). Familiarity expands space and contracts time. Hippocampus, 27(1), 12–16. https://doi.org/10.1002/hipo.22672
- Jones, J. A., Swan, J. E., Singh, G., Kolstad, E., & Ellis, S. R. (2008, August). The effects of virtual reality, augmented reality, and motion parallax on egocentric depth perception. In Proceedings of the 5th symposium on Applied perception in graphics and visualization, Los Angeles, California, USA. (pp. 9–14).
- Keinath, A. T., Epstein, R. A., & Balasubramanian, V. (2018). Environmental deformations dynamically shift the grid cell spatial metric. Elife, 7, e38169. https://doi.org/10.7554/eLife.38169
- Keinath, A. T., Rechnitz, O., Balasubramanian, V., & Epstein, R. A. (2021). Environmental deformations dynamically shift human spatial memory. Hippocampus, 31(1), 89–101. https://doi.org/10.1002/hipo.23265
- Kelly, J. W., McNamara, T. P., Bodenheimer, B., Carr, T. H., & Rieser, J. J. (2009). Individual differences in using geometric and featural cues to maintain spatial orientation: Cue quantity and cue ambiguity are more important than cue type. Psychonomic Bulletin & Review, 16(1), 176–181. https://doi.org/10.3758/PBR.16.1.176
- Kimura, K., Reichert, J. F., Olson, A., Pouya, O. R., Wang, X., Moussavi, Z., & Kelly, D. M. (2017). Orientation in virtual reality does not fully measure up to the real-world. Scientific Reports, 7(1), 1–8. https://doi.org/10.1038/s41598-017-18289-8
- Klatzky, R. L., Loomis, J. M., Beall, A. C., Chance, S. S., & Golledge, R. G. (1998). Spatial updating of self-position and orientation during real, imagined, and virtual locomotion. Psychological Science, 9(4), 293–298. https://doi.org/10.1111/1467-9280.00058
- Krupic, J., Bauza, M., Burton, S., Barry, C., & O’Keefe, J. (2015). Grid cell symmetry is shaped by environmental geometry. Nature, 518(7538), 232–235. https://doi.org/10.1038/nature14153
- Lee, S. A., Miller, J. F., Watrous, A. J., Sperling, M. R., Sharan, A., Worrell, G. A., Berry, B. M., Aronson, J. P., Davis, K. A., Gross, R. E., Lega, B., Sheth, S., Das, S. R., Stein, J. M., Gorniak, R., Rizzuto, D. S., & Jacobs, J. (2018). Electrophysiological signatures of spatial boundaries in the human subiculum. Journal of Neuroscience, 38(13), 3265–3272. https://doi.org/10.1523/JNEUROSCI.3216-17.2018
- Lever, C., Burton, S., Jeewajee, A., O’Keefe, J., & Burgess, N. (2009). Boundary vector cells in the subiculum of the hippocampal formation. Journal of Neuroscience, 29(31), 9771–9777. https://doi.org/10.1523/JNEUROSCI.1319-09.2009
- McGregor, A., Hayward, A. J., Pearce, J. M., & Good, M. A. (2004). Hippocampal lesions disrupt navigation based on the shape of the environment. Behavioral Neuroscience, 118(5), 1011. https://doi.org/10.1037/0735-7044.118.5.1011
- Montello, D. R., Waller, D., Hegarty, M., & Richardson, A. E. (2004). Spatial memory of real environments, virtual environments, and maps. In G. L., Allen (Eds.), Human spatial memory (pp. 271–306). Psychology Press.
- Nyberg, N., Duvelle, É., Barry, C., & Spiers, H. J. (2022). Spatial goal coding in the hippocampal formation. Neuron, 110(3), 394–422. https://doi.org/10.1016/j.neuron.2021.12.012
- O’Keefe, J., & Burgess, N. (1996). Geometric determinants of the place fields of hippocampal neurons. Nature, 381(6581), 425–428. https://doi.org/10.1038/381425a0
- O’Keefe, J., & Nadel, L. (1978). The hippocampus as a cognitive map. Oxford university press.
- Richardson, A. E., Montello, D. R., & Hegarty, M. (1999). Spatial knowledge acquisition from maps and from navigation in real and virtual environments. Memory & Cognition, 27(4), 741–750. https://doi.org/10.3758/BF03211566
- Scarfe, P., & Glennerster, A. (2021). Combining cues to judge distance and direction in an immersive virtual reality environment. Journal of Vision, 21(4), 10–10. https://doi.org/10.1167/jov.21.4.10
- Shine, J. P., Valdés-Herrera, J. P., Hegarty, M., & Wolbers, T. (2016). The human retrosplenial cortex and thalamus code head direction in a global reference frame. Journal of Neuroscience, 36(24), 6371–6381. https://doi.org/10.1523/JNEUROSCI.1268-15.2016
- Sjolund, L. A., Kelly, J. W., & McNamara, T. P. (2018). Optimal combination of environmental cues and path integration during navigation. Memory & Cognition, 46(1), 89–99. https://doi.org/10.3758/s13421-017-0747-7
- Sousa Santos, B., Dias, P., Pimentel, A., Baggerman, J. W., Ferreira, C., Silva, S., & Madeira, J. (2009). Head-mounted display versus desktop for 3D navigation in virtual reality: A user study. Multimedia Tools and Applications, 41(1), 161–181. https://doi.org/10.1007/s11042-008-0223-2
- Spiers, H. J., & Barry, C. (2015). Neural systems supporting navigation. Current Opinion in Behavioral Sciences, 1, 47–55. https://doi.org/10.1016/j.cobeha.2014.08.005
- Spiers, H. J., Coutrot, A., & Hornberger, M. (2021). Explaining World‐Wide variation in navigation ability from millions of people: Citizen science project sea hero quest. Topics in Cognitive Science, 15(1), 120–138. https://doi.org/10.1111/tops.12590
- Spiers, H. J., Hayman, R. M., Jovalekic, A., Marozzi, E., & Jeffery, K. J. (2015). Place field repetition and purely local remapping in a multicompartment environment. Cerebral Cortex, 25(1), 10–25. https://doi.org/10.1093/cercor/bht198
- Srivastava, P., Rimzhim, A., Vijay, P., Singh, S., & Chandra, S. (2019). Desktop VR is better than non-ambulatory HMD VR for spatial learning. Frontiers in Robotics and AI, 6(50), 10–3389. https://doi.org/10.3389/frobt.2019.00050
- Stangl, M., Topalovic, U., Inman, C. S., Hiller, S., Villaroman, D., Aghajan, Z. M., Christov-Moore, L., Hasulak, N. R., Rao, V. R., Halpern, C. H., Eliashiv, D., Fried, I., & Suthana, N. (2021). Boundary-anchored neural mechanisms of location-encoding for self and others. Nature, 589(7842), 420–425. https://doi.org/10.1038/s41586-020-03073-y
- Stensola, T., Stensola, H., Moser, M. B., & Moser, E. I. (2015). Shearing-induced asymmetry in entorhinal grid cells. Nature, 518(7538), 207–212. https://doi.org/10.1038/nature14151
- Waller, D., Loomis, J. M., & Haun, D. B. M. (2004). Body-based senses enhance knowledge of directions in large-scale environments. Psychonomic Bulletin & Review, 11(1), 157–163. https://doi.org/10.3758/BF03206476
- Waller, D., Loomis, J. M., & Steck, S. D. (2003). Inertial cues do not enhance knowledge of environmental layout. Psychonomic Bulletin & Review, 10(4), 987–993. https://doi.org/10.3758/BF03196563
- Wann, J. P., Rushton, S., & Mon-Williams, M. (1995). Natural problems for stereoscopic depth perception in virtual environments. Vision Research, 35(19), 2731–2736. https://doi.org/10.1016/0042-6989(95)00018-U
- Weech, S., Kenny, S., & Barnett-Cowan, M. (2019). Presence and cybersickness in virtual reality are negatively related: A review. Frontiers in Psychology, 10, 158. https://doi.org/10.3389/fpsyg.2019.00158
- Zhao, M., & Warren, W. H. (2015). Environmental stability modulates the role of path integration in human navigation. Cognition, 142, 96–109. https://doi.org/10.1016/j.cognition.2015.05.008
- Zhou, R., & Mou, W. (2019). Boundary shapes guide selection of reference points in goal localization. Attention, Perception, & Psychophysics, 81(7), 2482–2498. https://doi.org/10.3758/s13414-019-01776-7