
 ?Mathematical formulae have been encoded as MathML and are displayed in this HTML version using MathJax in order to improve their display. Uncheck the box to turn MathJax off. This feature requires Javascript. Click on a formula to zoom.
ABSTRACT
Closed landfills represent a large portion of land that cannot be developed but can potentially be ecologically rehabilitated using capping technologies such as phytocapping. This study aims to identify and quantify the value of landfills for ecological rehabilitation in Queensland, Australia, using GIS (Geographic Information Systems) and multi-criteria analysis. Multiple environmental features were used for this study and were selected to represent ecosystem services and connectivity. These features were used to create two novel scores (environmental and habitat score), representing the total area and number of environmental features. The evaluation shows there is high value for ecological rehabilitation of landfills in South East Queensland and the Wet Tropics, signifying the importance of ecological rehabilitation in these biogeographic regions. Landfill rehabilitation can create high-value habitats for endangered species and enhance connectivity. It is recommended that landfill after-use is considered by regulators and stakeholders as a potential vehicle for achieving environmental sustainability and ecological conservation. The developed methodology in this study can be used to inform the decision-making process for landfill after-use and the strategic prioritisation of landfills within local governmental areas for achieving ecological rehabilitation.
Introduction
Ecological rehabilitation is the primary method to recover the degradation and loss of ecosystems, serving as the most effective approach to restore biodiversity threatened by human encroachment (Barral et al. Citation2015; Milton and Dean Citation2021). Restoring and maintaining biodiversity across increasingly fragmented ecosystems is a major challenge. Rehabilitation projects are carried out for distinct reasons, reflecting the diversity of outcomes achievable from them. The principal objective of ecological rehabilitation projects is to protect biodiversity, provide ecosystem services, ensure connectivity, and reduce sediment loading in the waterways (Halme et al. Citation2013; Jackson and Hobbs Citation2009; Krievins, Plummer, and Baird Citation2018; Pressey and Tully Citation1994).
Landfills represent a large area that cannot be developed commercially. This is due to their unstable nature and other risks presented to dwellings by landfill gas and other pollutants (Barlaz et al. Citation2002). Historically, landfill rehabilitation in Australia has consisted of landfill capping with compacted clay and/or impenetrable geosynthetics, providing restricted and shallow rooting depth for ecosystem restoration. It is therefore common for landfill sites to be used as recreational parks, sports fields, or even as agricultural land requiring only a thin topsoil layer (De Sousa Citation2002; Rigillo et al. Citation2007; Simmons Citation1999). Tree growth, which requires greater rooting depth, tends to be actively discouraged (Dobson and Moffat Citation1995). The emphasis on hard infrastructure capping techniques has resulted in a lack of attention to the ecological rehabilitation of landfills or the benefits that could be achieved through alternative methods.
Landfill phytocapping (also known as evapotranspiration landfill capping) has opened a new opportunity for landfill ecological rehabilitation as it consists of a loosely compacted, deeper, soil profile capable of supporting varying structures of plants with the capacity to enable ecosystem development (Forster et al. Citation2022; Kim et al. Citation2022; Michael Citation2010; Michael et al. Citation2019). Previous studies have highlighted the importance of indigenous plant selection (Chell et al. Citation2022; Kim et al. Citation2022; Michael Citation2010; Michael et al. Citation2007), but few studies have emphasised habitat creation and fauna recolonisation (Summer and Reichelt-Brushett Citation2018). Studies have established the importance of opportunities for increasing ecological diversity in both rural and semi-urban locations (Simmons Citation1999).
The limited studies that have been conducted on the ecological rehabilitation of landfills have shown that landfills can be used for habitat creation (Camerini and Groppali Citation2014; Chen et al. Citation2016; Chen et al. Citation2017; Handel et al. Citation1997; Onuferko et al. Citation2018; Pang et al. Citation2020; Tarrant et al. Citation2013; Vaverková et al. Citation2018). These studies were conducted on landfills with mostly grass-only coverage, or small clusters of trees and shrubs on the landfill cover due to the inherent rooting depth limitation of traditional barrier capping technologies (Camerini and Groppali Citation2014; Tarrant et al. Citation2013).
Research on ecological restoration and rehabilitation of landfills in Australia has focused on aesthetics, garden ecosystems, and evaluation of existing landfill ecological restoration (Hardwick et al. Citation2011; So and Chu Citation2010; Young, Chase, and Huddleston Citation2001; Yuen et al. Citation2010). The research by So and Chu (Citation2010) showed the importance of the distance of the landfill from natural habitats and natural woodlands to the success of ecological rehabilitation. However, no research has been conducted to identify and quantify the potential opportunities and benefits of ecological rehabilitation of landfills.
This study aims to identify and quantify the value of landfills for ecological rehabilitation to assist decision-makers with making informed choices about landfill after-use in Queensland. Three objectives assist in achieving this aim: (1) To identify if selected ecological features are present in defined landfill areas; (2) To identify landfill sites in Queensland and their biogeographical significance; and (3) To quantify the values of ecological features present in each identified landfill site by creating scores that represent the value. The results show that landfill rehabilitation can create high-value habitats for endangered species and enhancement of bio-corridor connectivity. The tools developed in this study can be used to inform the decision-making process for landfill after-use and the strategic prioritisation of landfills for achieving ecological rehabilitation in Queensland, elsewhere in Australia, and internationally.
Materials and methods
Study area
The study was conducted in the state of Queensland, with an area of 1,730,648 square kilometres, comprising 22 per cent of the Australian continental area. The state has a wide variety of climatic conditions, ranging from tropical to arid. It is the most biodiverse state in Australia, with 13 biogeographical regions (divided into 132 biogeographic sub-regions) supporting more than 1000 ecosystem types, including rainforests, savannas, rangelands, dry tropics, and wetlands (DES Citation2022a). There has been a major decline in biodiversity in Queensland (Pooley Citation2021). The third most populated state in Australia, Queensland had 5.378 million residents in 2022, distributed into 74 spatial units called Local Governmental Areas (LGA). Of these, the South East Queensland LGA’s of Brisbane, Gold Coast and Moreton Bay have the highest population (DES Citation2022a).
Environmental analysis
ArcGIS Pro 2.9.3 (ESRI Citation2022) was used for identifying and quantifying the environmental value of landfills. Environmental value is defined in this study as: ‘the worth of an environment and what it provides to a community or society that depends on that environment in one or more ways’ (Blowers Citation2003).
Identifying ecological benefits
Data sources
Various spatial data layers, primarily sourced from the Queensland Spatial Catalogue (DoR Citation2022), were used to identify environmental features that represent the potential for ecological rehabilitation of landfills in the state. Spatial data sources were attained from databases including Matters of State Environmental Significance (MSES), WildNet Database, National Waste Management Database, Australian Land Use and Management Classification (ALUMC) and Remnant Vegetation Cover (detailed in ).
Table 1. Ecological data, ranking criteria and features used.
Queensland land use (DES Citation2019) and Landfills in Queensland data layers were used to identify the landfills in Queensland, including closed, active, and repurposed landfills. All three types of GIS vector data (points, lines, and polygons) were used in this study. Polygonal data is optimal for overlay analysis to determine the environmental value of landfills. For an overlay analysis, a buffer around point landfill data had to be developed to create a polygonal data layer (Unwin Citation1996).
Spatial inventory of environmental features
The selected environmental features were ranked according to their significance on the local ecology and ecosystem services that they can provide. Biodiversity is a major driver for ecosystem services and is fundamental to the provision of ecosystem services (Close et al. Citation2009). In this research, biodiversity is given precedence and environmental features with biodiversity significance are weighted higher. As this study used multiple environmental features and calculated environmental values in the same analysis, the data had to be weighted (Kukkala and Moilanen Citation2017). The method used for weightings for features is an adaptation of the method suggested by Lehtomäki et al. (Citation2016). Each data layer was given a weight according to the value given to the service, value for conservation, and reliability of connectivity response (Lehtomäki et al. Citation2009; Lehtomäki and Moilanen Citation2013).
Feature layers with higher biodiversity significance, like MSES threatened wildlife habitat, koala core habitat, MSES fish habitat type A, Queensland state-wide corridor, very high-value wetland protected area and protected area under IUCN codes Ia, II, III, IV, V, Ib, were given higher value compared to other feature layers used for analysis. Primary importance was given to fauna habitats listed under the Environmental Protection and Biodiversity Conservation Act 1999 list of Threatened Fauna habitats. The data layers used were from Queensland government layers which form part of Matters of State Environmental Significance. Vegetation layers selected included remnant vegetation cover, as they are under specific government policies and legislation (State Policy for Vegetation Management, Vegetation Management Act 1999), which means these data layers are rigorous and validated. It is important to consider that Queensland is a very large state, and the availability and scale of data may vary.
A total of 12 data layers were used to create a database of the environmental value of landfills which is referred to as ‘environmental data’ for this study. The ecological priority principles by Jia and Zhessakov (Citation2021) were considered: the effects (actual and potential) of adjacent and other ecosystems; and, ecosystem structure, functioning and connectivity to maintain ecosystem services. The data selected for representing environmental services and connectivity (shown in ) were biodiversity (habitat data, protected areas), ecosystem services (wetland systems, remnant bushlands), and connectivity (state corridors, corridor buffers). Some data layers in this study represent multiple species of high significance in the state and ecosystems that are directly affected by urbanisation and climate change (Adams-Hosking et al. Citation2011; Gonzalez-Astudillo et al. Citation2017; Lynch Citation2011; Meynecke et al. Citation2006; Meynecke, Lee, and Duke Citation2008; Wilson et al. Citation2011).
The ecosystem services considered were support and regulatory services including biodiversity, habitat, soil formation, pollination, cool temperature, flood control, water, and air. The weight of the data layers was determined using their varying degree of ‘value’, denoting the importance of the ecological services provided by the feature. For example, state-level significance corridors hold more value than regional significance due to the large connectivity potential. The data layers and weights used for this study are shown in . Expert knowledge was provided by the research team and used for assigning weight to the data. The authors of this research have expertise in ecology, land rehabilitation, environmental planning, and environmental health. This expertise was utilised to allocate appropriate weightings to each data layer incorporated in the study’s analytical framework.
Spatial inventory of landfills
Maps were created to visualise the distribution of landfills in Queensland and their environmental significance at a state level by comparing landfill distribution with species density and biodiversity status (shown in and ). The data were screened to remove repetitive records and some records without detailed geolocation information. All landfills were given equal priority in this study. These data layers were then combined to create a spatial inventory for landfills in Queensland and these were then used to create the inventory for ecological layers.
Figure 1. Spatial distribution of landfills in different biogeographic regions in Queensland and percentage of the total number of remnant Regional Ecosystems (REs) in each biogeographic regions.
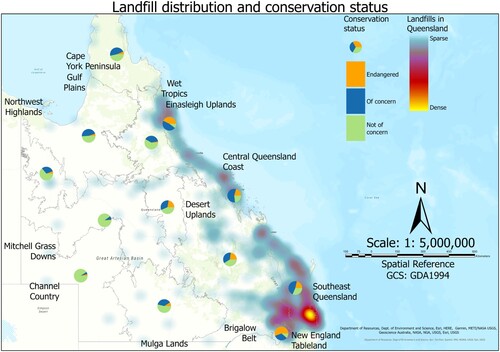
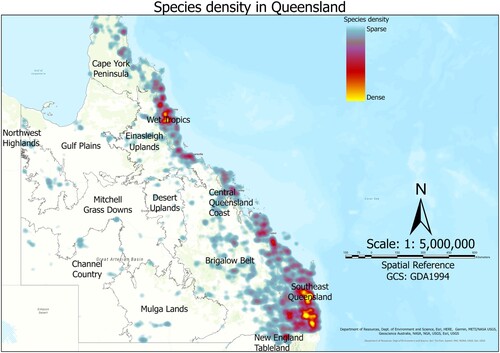
Figure 2. Species density of flora and fauna in different biogeographic regions in Queensland.
Buffer layer
The landfill data used for the study primarily consisted of point data. A 500 m geodesic buffer was created around each landfill, inclusive of the landfill area. In this study, Geographic Information System (GIS) techniques such as geoprocessing and overlay analysis were employed to analyse and assess the area of influence surrounding the landfill site. This specific area of influence was visualised using a buffer layer, referred to as the ‘landfill buffer’, which was defined and allocated for this research. Through the application of GIS, overlay analysis and clip function were conducted within this defined landfill buffer to investigate and evaluate the impacts, characteristics, and interactions associated with the landfill site and its surrounding environment. The 500 m distance of the buffer was chosen as most landfills in Queensland are mandated to have a 100 m buffer from a surface water source and a 500 m buffer from noise, dust, or odour-sensitive areas (DES Citation2021a). The landfill buffer therefore represents an area of influence around the landfill inclusive of the landfill site used for spatial analysis to determine the ecological value of landfill rehabilitation. The buffer is needed to represent connectivity and the potential to re-establish ecological integrity and recolonisation by species on the land compared with pre-clearance conditions (Haase Citation1995; Menon and Bawa Citation1997; Moilanen and Nieminen Citation2002). Furthermore, the buffer is well-aligned with the movement patterns of a significant local fauna species: the male Phascolarctos cinereus (Koala) which travels between locations up to 542 m (males) and 343 m apart (females) (Whisson et al. Citation2020).
Quantifying the ecological value
In ArcGIS, an overlay analysis was performed using both landfill and environmental data. Clip and merge operations were used to extract data layers present inside the landfill buffer polygons. A spatial join was used to match clipped feature values to the landfill values based on their relative spatial locations. The environmental score (e) for a single ecological feature in each landfill was calculated as:
where the habitat score (h) of a single polygonal ecological feature was calculated using the weight assigned for the data layer, and A is the area covered by one ecological feature in hectares.
Score creation and prioritisation
The data obtained from ArcGIS was converted into MS Excel and pivot tables were subsequently used to display and filter the data. The sum of all environmental scores present in a landfill was used to calculate the total Environmental score (E) and the sum of all habitat scores calculated was used to calculate the total Habitat score (H) for a landfill. The value of each landfill for ecological rehabilitation was calculated using the E and H scores.
Additionally, average scores were calculated for different biogeographic regions to identify the biogeographic region with the highest potential for ecological rehabilitation. Finally, WildNet wildlife records data that include public spotting reports (DES Citation2022b), were correlated with the environmental and habitat scores using linear regression analysis to find the R2 value.
Results
Distribution of landfills in Queensland
In total, 505 landfill sites were considered for this study including 252 landfills, 196 transfer stations, 14 reprocessing stations and 43 multipurpose landfills (combining various landfill purposes). The landfill areas created inclusive of the buffer, accounted for a total of 1824.6 km2, 0.1 per cent of the total land area of Queensland.
Close to half (47 per cent), of the open, closed and repurposed landfills (46.93 per cent) were distributed along the coastal areas of Queensland (South East Queensland, Central Queensland Coast and the Wet Tropics) (). The majority of landfill sites (88.71 per cent) were operational or repurposed as transfer stations, mostly not rehabilitated. The highest numbers of open landfills can be found in South East Queensland, especially in the densely populated Brisbane, Ipswich, Logan and Gold Coast areas.
Looking at the Local Governmental Areas (LGA), Toowoomba Region, Western Downs Region, and City of Brisbane have the highest number of landfills and transfer stations. A total of 478 (94.7 per cent) waste facilities in Queensland are owned and operated by different councils in Queensland. Twenty-seven (5.3 per cent) of the total 505 landfills considered for this study are owned or operated by private companies.
The South East Queensland region has 34.5 per cent of the state’s landfills, with a total area of 24,081 km2 (1.4 per cent of the total Queensland land area). The Brigalow Belt region has 32.2 per cent of landfills and the Wet Tropics region has 7.1 per cent of landfills representing 365,281.1 km2 and 19,929 km2 respectively (21.1 per cent and 1.2 per cent of the total Queensland land area). A heatmap was created to visualise and identify landfill distribution and clustering in Queensland (Gehlenborg and Wong Citation2012). The heat maps also help to identify the value of landfills for ecological rehabilitation on a broader scale. The highest concentration of landfills in South East Queensland and Wet Tropics is due to a higher number of landfills relative to their land area ().
Biogeographic regions and ecological significance
The highest species density in Queensland was found in South East Queensland, with a total of 10730 species (). The Brigalow Belt and the Wet Tropics have the next highest species density with 9739 and 7850 species, respectively (DES Citation2022a). These three biogeographic regions (South East Queensland, the Wet Tropics and the Brigalow Belt) host highly significant ecosystems and World Heritage Areas such as the Great Barrier Reef (GBR), Gondwana rainforests, Fraser Islands, Wet Tropics of Queensland, and the K'gari region (DES Citation2022a). The Cape York Peninsula, Brigalow Belt, Mulga, and GBR regions have the most significant broad land clearance in Queensland (Reside et al. Citation2017). City of Brisbane, Toowoomba Region, Western Downs Region, Logan City, and Cairns Region have the highest species density in Queensland.
The biogeographic regions with the highest ratio of rare or threatened species are New England Tablelands, the Wet Tropics, South East Queensland and the Brigalow Belt (). The total number of endangered species is highest in South East Queensland (482), followed by the Brigalow Belt (419) and the Wet Tropics (417). The regions with the highest cluster of landfills, South East Queensland and the Wet Tropics are also the regions with the highest number of endangered flora and fauna species and species of concern in Queensland ().
Ecological features and spatial distribution
The 13 ecological features used in this study () are present in 94 per cent of the landfill buffers (). At least one of the selected ecological features was present in these 475 landfill buffers. The ecological features with the highest coverage in landfill buffers include corridor buffer, remnant vegetation cover and wildlife habitat for endangered and vulnerable species.
Table 2. Ecological features and percentage coverage of total landfill buffer area.
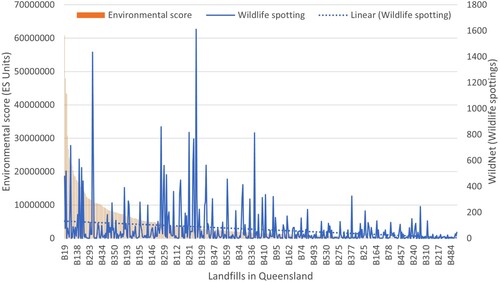
WildNet wildlife data (DES Citation2022b) was used to determine the efficiency of the scores created in predicting the environmental value of a landfill. shows the general trend of higher-value landfills showing animals spotted in each location. Whereas there is a weak positive correlation between numbers of animals spotted and environmental scores of landfills, with an R2 value of 0.042, this cannot be considered a clear trend and has not been further used in the analysis.
Figure 3. Environmental scores of landfills and WildNet data in landfill buffers.
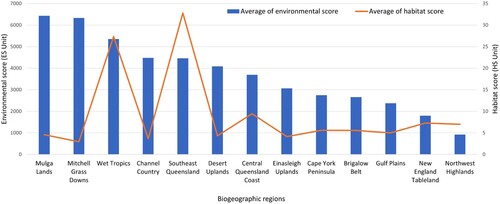
The average habitat scores and ecological scores present in different biogeographical regions of Queensland are shown in . The biogeographical regions with the highest mean habitat and ecological scores are the Wet Tropics and South East Queensland respectively. The Mulga Lands and the Mitchell Grass Downs have high ecological and low habitat scores. The average habitat and environmental scores in the Brigalow Belt are medium.
Figure 4. Total environmental scores and habitat scores for landfills in different biogeographic regions in Queensland.
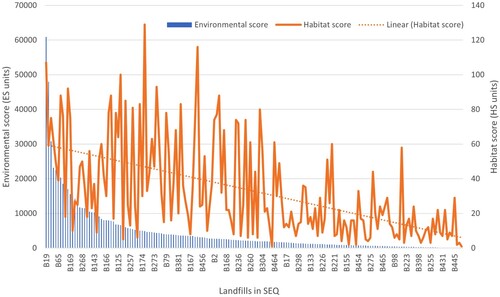
The habitat and environmental scores for landfills in the South East Queensland biogeographic region are shown in . South East Queensland has the highest score when combining both environmental and habitat score averages. There is a weak positive correlation between habitat scores and environmental scores, with an R2 value of 0.18. The landfill with the highest combined habitat and environmental score is B19, the Reedy Creek commercial landfill located on the Gold Coast, South East Queensland. This score is due to the large area represented by the state riparian corridor, corridor buffer, koala habitat restoration area, remnant vegetation cover and habitat for special least concern species.
Figure 5. Environmental score and habitat score for all landfills in South East Queensland.
Discussion
The management of waste, especially landfills in Queensland is dominated by engineering professionals with limited ecological backgrounds. Similarly, guidance documents supporting landfill rehabilitation actions are focused predominantly on pollution abatement rather than ecological rehabilitation. Therefore, the ecological context of land used for landfilling is potentially not looked at or misinterpreted due to a lack of ecological knowledge within the industry and associated regulatory frameworks. This, in turn, creates missed opportunities for ecological rehabilitation and, thereby, habitat creation, connectivity, biodiversity, and ecosystem services. GIS is an important tool well used and understood by engineers (Ramesh Citation2021; Williamson Citation1997). MCA provides flexibility in terms of incorporating new data, adjusting criteria, and accommodating changing circumstances (Kurka and Blackwood Citation2013). Landfill sites may vary in terms of size, location, ecological conditions, and after-life requirements. MCA allows for the customisation of criteria and indicators based on site-specific characteristics, ensuring the assessment methodology is adaptable and applicable to different contexts. This research aimed to determine the presence of selected environmental features near landfills and develop an evaluation framework for assessing their presence. The results demonstrate the value of landfills in contributing to the broader environmental objectives of Queensland. Of the total 505 landfills identified in this research, 94 per cent showed opportunities in Queensland for potential ecological rehabilitation. The correlation between landfill locations and regions with high species density, high numbers of endangered and species of concern establishes the importance of considering landfills as areas that should be considered for ecological rehabilitation.
Identifying biogeographical regions with the highest potential is significant as these regions show an area of animal and plant distribution having similar or shared characteristics. Biogeographic regions assist in the process of identifying opportunities for ecological rehabilitation as the ecosystem health within these regions is established. The biogeographic regions with the highest opportunities for ecological rehabilitation (South East Queensland, the Wet Tropics, the Brigalow Belt) present are also regions most affected by land clearance and development encroachment. These regions have shown a rapid decline in the health of ecosystems driving a large number of species to extinction and being represented on the IUCN Red List of Threatened Species. The study by Mcalpine et al. (Citation2007) demonstrated the importance of private lands in conservation effects in South East Queensland and the risk posed by private and public industry to biodiversity. The large number of landfills in South East Queensland still in need of rehabilitation represents a substantial opportunity to contribute to local ecology and biodiversity if ecological rehabilitation becomes a priority for the after-use of landfills in these regions. Even though landfills only represent 0.1 per cent of the total Queensland land mass, most landfills are located in densely populated regions of the state where habitat patches are being reduced drastically. Allocating small areas of land in high-density population regions for ecological rehabilitation justifies biodiversity conservation, restoration of ecosystem services, education and awareness, creation of green spaces, climate change mitigation and adaptation, and community engagement. It enhances urban livability, promotes sustainable practices, and fosters social cohesion.
The higher average environmental and habitat scores in South East Queensland and the Wet Tropics signify that the waste management industry should give greater preference to ecological rehabilitation of landfills in built-up areas. This result agrees with previous studies showing the importance of ecological restoration and rehabilitation in urban areas (Klaus and Kiehl Citation2021). Other biogeographical regions have large variations of scores between the highest and lowest valued landfills, contributing towards low average scores. Further subdivision has to be done, with small regions such as LGAs, to estimate the areas of higher significance.
This research has identified that most landfills in Queensland have prominent levels of ecological features within their buffer areas, such as state riparian corridor buffer, remnant vegetation and endangered habitat (total area of 137,028 hectares). This in turn provides greater connectivity and ecosystem services (habitat, biodiversity). This project demonstrates the need to look at landfills spatially to inform the decision-making process for the after-use of landfills. Findings suggest that ranking criteria can be used effectively to prioritise and assist the decision-making process for landfill ecological rehabilitation. If a landfill is found to have significant ecological value, this should be prioritised and land with the highest value be given the highest priority (Dai, Duan, and Ai Citation2020; Runzhe, Peihong, and Qian Citation2018).
Ecological rehabilitation potential
The methodology used for this research combines a multi-criteria approach, GIS techniques and expert knowledge to identify and quantify the features representing the environmental values in Queensland landfills. MCA allows for the consideration and evaluation of multiple criteria simultaneously. Landfill rehabilitation involves various ecological aspects such as vegetation restoration, habitat creation, biodiversity enhancement, and soil remediation. MCA enables the integration of diverse criteria and indicators, providing a comprehensive assessment of the ecological potential of landfills. The study by Wilson et al. (Citation2019) established that the protection of threatened species and improved habitats for native plants and animals as preferred benefits achieved from ecological rehabilitation. A large area of endangered species habitat, remnant bushland and corridor buffers in landfill buffers signify the importance and opportunity for ecosystem services and how the neighbouring ecosystems and communities benefit from the ecological rehabilitation of landfills (Chulliparambil et al. Citation2023).
Environmental challenges and opportunities
Landfills are primarily considered liabilities, but many have the potential to be valuable assets if managed and appropriately rehabilitated. Ecological restoration and rehabilitation are vital in countering the anthropogenic degradation of biodiversity and reducing disaster risk (Cortina-Segarra et al. Citation2021). The biodiversity status shows the degradation of the ecosystem and biodiversity in Queensland. Landfills provide excellent opportunities for ecological rehabilitation as they represent a large area of land that cannot be built commercially. The landfill will also have funding for rehabilitation after the closure of the landfill, and suitable after-use is planned for the land.
Studies in mine rehabilitation have shown that the successful recolonisation of rehabilitated land is highly dependent on climate zone, distance from undisturbed areas, species abundance in the surroundings, the shape of land and connectivity between population sources (Cristescu, Frère, and Banks Citation2012; Jones and Davidson Citation2016; Lei, Pan, and Lin Citation2016). The landfill distribution and species density correlate in the same regions of Queensland. South East Queensland and the Wet Tropics both show a high density of landfills and the largest number of endangered species and species of concern. This implies, on a broad scale, that landfill ecological rehabilitation will help maintain or improve ecological security and biodiversity conservation by providing connectivity and habitat for species under pressure from development and land clearance. South East Queensland also has a high K factor value for soil erodibility, and ecological rehabilitation by phytocapping of landfills would reduce the runoff and help reduce the sediment load of the waterways (ASRIS Citation2016; Lamb et al. Citation2014; Venkatraman and Ashwath Citation2007; Venkatraman, Ashwath, and Su Citation2011; Yuen et al. Citation2010; Yuen et al. Citation2011; Michael et al. Citation2023).
A method for prioritising landfills
This study developed two mathematical scores (environmental and habitat) representing the total area and number of environmental features present in a landfill buffer. If an area is found to have significant ecological value, it is prioritised, and land with the highest value is given the highest priority (Dai, Duan, and Ai Citation2020; Runzhe, Peihong, and Qian Citation2018). A landfill owner can utilise these scores to prioritise which landfill should be ecologically rehabilitated using phytocapping, ensuring optimal use of financial, intellectual, and natural resources. A low positive correlation between both scores shows the significance of using both scores for informing decision-making. A ranking system using both scores can ensure the best outcomes from an ecological rehabilitation of landfill. The landfill with the highest environmental and habitat scores should be prioritised for ecological rehabilitation. Other conditions such as climate and landfill landscape can be considered when making decisions but are not part of this study. There is a positive correlation between environmental scores and habitat scores, but both scores should be considered separately while prioritising as they represent distinct and complementary indicators of a healthy ecosystem.
The environmental data used here representing connectivity and ecosystem services were selected based on the expertise of the research group. All ecological features considered for this study were weighted equally. However, landfill owners can give a higher weight to features critical to their location and objectives for ecological rehabilitation if required. For example, if an LGA prioritises koala habitat connectivity and creation as part of its environmental strategy, this could be given more weight, thereby prioritising landfills with the potential for achieving these outcomes. This research has identified that half of the landfills have a high ecological and habitat score value, indicating the potential to benefit from landfill ecological rehabilitation.
This study does not consider the value of ecological rehabilitation of landfills for increasing green space in built-up areas. Furthermore, lower ecological value does not imply that the landfill is not suited for ecological rehabilitation; instead, it means fewer possible ecological benefits from landfill rehabilitation compared with other landfills with higher value. The landfills without any features present are considered to have low ecological value.
Accuracy and data limitations
Differing jurisdictions, reporting practices, lack of public access to data landfills and the sheer scale of landfills in Queensland were key factors limiting access to data for this research. Several new landfills are opened each year due to the significant dependence of the state on landfilling and a large amount of waste accepted from different states in Australia. The exact number of non-rehabilitated landfills and legacy landfills in the state and the relative accuracy of the database remain difficult to validate independently due to few alternative data sources and limitations for field-based assessment of hundreds of landfills in Queensland. The lack of updated databases for landfill boundaries and locations adds an element of temporal uncertainty.
Due to the lack of representation of boundary for the landfills in the available data set, a buffer of 500 m was used, which led to the overestimation of landfill boundaries. To reduce this effect, data for landfills with boundaries was used instead of point data. The ecological data selected for creating this tool does not represent all the potential for calculating environmental value present in an area due to the large number of variables related to the ecology of a region. Importance was given to selected representative species, fragile ecosystems, and essential ecosystem services to create the database.
The scores created for this study are derived from defined habitats, habitat modelling and prediction data rather than actual animal spotting data. The animal spotting data is used to determine the accuracy of the representation of scores. The WildNet wildlife spotting dataset is consistent with the WildNet database, and positional accuracy varies depending on the source of individual records. Due to the dependence of data accuracy on individual records and bias towards regions with higher populations, this data set was not used to create both environmental and habitat scores. A weak correlation between WildNet data and environmental scores signifies that the WildNet wildlife data cannot be used for the calculation of the scores.
The koala habitat data sets used for this study are limited to South East Queensland, and high-quality data for other regions are unavailable. This created a positive bias towards landfills in South East Queensland while developing the scores. The value of coverage of Koala habitat layers, therefore, is underestimated outside South East Queensland.
In this study, catchment area and boundary effects are not considered. Landfills represent relatively small areas compared to large catchment areas present in Queensland. Hence the impacts of catchment boundaries are negligible. An extended study including the information on local topography and inclusion of slope is recommended for future research endeavours.
Using scores to determine the environmental values of landfills has limitations. The scores depend on the data layers used for the creation of spatial inventory. Landfill owners could overcome this limitation by using the method and including data layers representing the ecosystem services of greatest importance to a particular community. This method also does not consider other priorities of landfill owners like open space strategy, transfer stations, or alternative energy production. However, ecological rehabilitation has had little attention and this method helps to redress the lack of emphasis in this area. Further raster-based analysis is recommended for specific regions to achieve greater detailed information.
Conclusion
This study contributes to the debate about using landfills for ecological rehabilitation as part of landfill closure. Our results provide evidence to establish that landfills have a high potential for providing connectivity and ecosystem services to maintain ecological security and biodiversity in Queensland. It is also evident that landfills can be used for habitat creation and connectivity for endangered and threatened species like Phascolarctos cinereus and Lasiorhinus krefftii, improving prospects for their survival. Further, as ecological rehabilitation of landfills is beneficial, environmental education and stakeholder engagement should be conducted to ensure the inclusion of ecological rehabilitation as an after-use option for landfills. These measures can accommodate the broader interests and concerns of community members and positively influence public perceptions and support for restoration. Further, policies should accommodate changes necessary to incentivise phytocapping, which is a landfill capping option that provides for ecological rehabilitation inherently as part of the design process. A greater emphasis on phytocapping could promote further implementation of landfill rehabilitation, with richer benefits for the environment, biodiversity and local communities.
Supplemental Files_Appendix_26Sept_2022.docx
Download MS Word (28.1 KB)Supplementary materials.docx
Download MS Word (75.4 KB)Disclosure statement
No potential conflict of interest was reported by the authors.
References
- Adams-Hosking, C., H. S. Grantham, J. R. Rhodes, C. Mcalpine, and P. T. Moss. 2011. “Modelling Climate-Change-Induced Shifts in the Distribution of the Koala.” Wildlife Research 38 (2): 122–130. https://doi.org/10.1071/WR10156.
- Asris. 2016. Soils - Universal Soil Loss Equation - K Factor, edited by DES. Dutton Park: Queensland Spatial Catalogue.
- Barlaz, M. A., A. P. Rooker, P. Kjeldsen, M. A. Gabr, and R. C. Borden. 2002. “Critical Evaluation of Factors Required to Terminate the Postclosure Monitoring Period at Solid Waste Landfills.” Environmental Science & Technology 36 (16): 3457–3644. https://doi.org/10.1021/es011245u.
- Barral, M. P., J. M. R. Benayas, P. Meli, and N. O. Maceira. 2015. “Quantifying the Impacts of Ecological Restoration on Biodiversity and Ecosystem Services in Agroecosystems: A Global Meta-Analysis.” Agriculture, Ecosystems & Environment 202: 223–231. https://doi.org/10.1016/j.agee.2015.01.009.
- Blowers, A. 2003. “Introduction.” In Environmental Policy in an International Context, edited by A. Blowers, and P. Glasbergen, 1–6. United Kingdom: Butterworth-Heinemann.
- Camerini, G., and R. Groppali. 2014. “Landfill Restoration and Biodiversity: A Case of Study in Northern Italy.” Waste Management & Research 32: 782–790. https://doi.org/10.1177/0734242X14545372.
- Chell, S., N. Tomson, T. D. H. Kim, and R. N. Michael. 2022. “Performance of Native Succulents, Forbs, and Grasses on an Extensive Green Roof Over Four Years in Subtropical Australia.” Urban Forestry & Urban Greening 74. https://doi.org/10.1016/j.ufug.2022.127631.
- Chen, X.-W., J. T.-F. Wong, A. O.-W. Leung, C. W.-W. Ng, and M.-H. Wong. 2017. “Comparison of Plant and Bacterial Communities Between a Subtropical Landfill Topsoil 15 Years After Restoration and a Natural Area.” Waste Management 63: 49–57. https://doi.org/10.1016/j.wasman.2016.08.015.
- Chen, X.-W., J. T.-F. Wong, W.-Y. Mo, Y.-B. Man, C. Ng, W. W, and M.-H. Wong. 2016. “Ecological Performance of the Restored South East New Territories (SENT) Landfill in Hong Kong (2000-2012).” Land Degradation & Development 27: 1664–1676. https://doi.org/10.1002/ldr.2366.
- Chulliparambil, V. R., H. Shearer, T. Matthews, J. Cortes-Ramirez, and R. N. Michael. 2023. “GIS to Identify the Value of Ecological Rehabilitation of Landfills.” 19th International Symposium on Waste Management and Sustainable Landfilling. Sardinia, Italy. 9 -13th October.
- Close, A., C. Zammit, J. Boshier, K. Gainer, and A. Mednis. 2009. Ecosystem Services: Key Concepts and Applications. Department of the Environment, Water, Heritage and the Arts, Canberra, Australia.
- Cortina-Segarra, J., I. García-Sánchez, M. Grace, P. Andrés, S. Baker, C. Bullock, K. Decleer, L. V. Dicks, J. L. Fisher, and J. Frouz. 2021. “Barriers to Ecological Restoration in Europe: Expert Perspectives.” Restoration Ecology 29: e13346. https://doi.org/10.1111/rec.13346.
- Cristescu, R. H., C. Frère, and P. B. Banks. 2012. “A Review of Fauna in Mine Rehabilitation in Australia: Current State and Future Directions.” Biological Conservation 149: 60–72. https://doi.org/10.1016/j.biocon.2012.02.003.
- Dai, Y., Z. Duan, and D. Ai. 2020. “Construction and Application of Field Investigation Support Platform for Land Spatial Planning Based on GeoServer.” Journal of Physics: Conference Series 1621: 0012059. https://doi.org/10.1088/1742-6596/1621/1/012059.
- DES. 2019. Queensland Land Use, edited by Queensland Government. Brisbane: Queensland Spatial Catalogue.
- DES. 2020. Wetland Protection Area - GBR High Ecological Significance Wetland. Brisbane: Queensland Spatial Catalogue.
- DES. 2021a. Guideline: Landfill Siting, Design, Operation and Rehabilitation, edited by DES. Queensland: Department of Environment and Science 5.00 ed.
- DES. 2021b. Remnant Vegetation Cover. Brisbane: Queensland Spatial Catalogue.
- DES. 2021c. South East Queensland Koala Conservation Strategy 2019-2024. Brisbane: Queensland Spatial Catalogue.
- DES. 2022a. Facts & Maps. Brisbane: Wetlandinfo.
- DES. 2022b. WildNet Wildlife Records. Brisbane: Queensland Spatial Catalogue.
- De Sousa, C. A. 2002. “Brownfield Redevelopment in Toronto: An Examination of Past Trends and Future Prospects.” Land Use Policy 19: 297–309. https://doi.org/10.1016/S0264-8377(02)00024-8.
- Dobson, M., and A. Moffat. 1995. “A Re-Evaluation of Objections to Tree Planting on Containment Landfills.” Waste Management & Research 13 (5): 579–600. https://doi.org/10.1016/S0734-242X(05)80036-9.
- DOR. 2022. Queensland Spatial Catalogue - QSpatial. The State of Queensland.
- ESRI. 2022. ArcGIS PRO. 2.9.1 ed. Redlands, CA: Environmental Systems Research Institute.
- Forster, M. A., T. D. H. Kim, S. Kunz, M. Abuseif, V. R. Chulliparambil, J. Srichandra, and R. N. Michael. 2022. “Phenology and Canopy Conductance Limit the Accuracy of 20 Evapotranspiration Models in Predicting Transpiration.” Agricultural and Forest Meteorology 315: 108824. https://doi.org/10.1016/j.agrformet.2022.108824.
- Gehlenborg, N., and B. Wong. 2012. “Heat Maps.” Nature Methods 9: 213. https://doi.org/10.1038/nmeth.1902.
- Gonzalez-Astudillo, V., R. Allavena, A. Mckinnon, R. Larkin, and J. Henning. 2017. “Decline Causes of Koalas in South East Queensland, Australia: A 17-Year Retrospective Study of Mortality and Morbidity.” Scientific Reports 7: 1–11. https://doi.org/10.1038/srep42587.
- Haase, P. 1995. “Spatial Pattern Analysis in Ecology Based on Ripley's K-Function: Introduction and Methods of Edge Correction.” Journal of Vegetation Science 6: 575–582. https://doi.org/10.2307/3236356.
- Halme, P., K. A. Allen, A. Auniņš, R. H. Bradshaw, G. Brūmelis, V. Čada, J. L. Clear, A.-M. Eriksson, G. Hannon, and E. Hyvärinen. 2013. “Challenges of Ecological Restoration: Lessons from Forests in Northern Europe.” Biological Conservation 167: 248–256. https://doi.org/10.1016/j.biocon.2013.08.029.
- Handel, S. N., G. R. Robinson, W. F. Parsons, and J. H. Mattei. 1997. “Restoration of Woody Plants to Capped Landfills: Root Dynamics in an Engineered Soil.” Restoration Ecology 5: 178–186. https://doi.org/10.1046/j.1526-100X.1997.09721.x.
- Hardwick, K. A., P. Fiedler, L. C. Lee, B. Pavlik, R. J. Hobbs, J. Aronson, M. Bidartondo, E. Black, D. Coates, and M. I. Daws. 2011. “The Role of Botanic Gardens in the Science and Practice of Ecological Restoration.” Conservation Biology 25: 265–275.
- Jackson, S. T., and R. J. Hobbs. 2009. “Ecological Restoration in the Light of Ecological History.” Science 325: 567–569. https://doi.org/10.1126/science.1172977.
- Jia, Q., and A. Zhessakov. 2021. “Study on Ecological Evaluation of Urban Land Based on GIS and RS Technology.” Arabian Journal of Geosciences 14: 261. https://doi.org/10.1007/s12517-021-06586-6.
- Jones, M. E., and N. Davidson. 2016. “Applying an Animal-Centric Approach to Improve Ecological Restoration.” Restoration Ecology 24: 836–842. https://doi.org/10.1111/rec.12447.
- Kim, T. D. H., B. Yu, J. Srichandra, S. Low-Choy, and R. N. Michael. 2022. “Water Flux and Biomass Production of Native Plants at Different Substrate Compactions for Landfill Phytocaps in Southeast Queensland, Australia.” Ecological Engineering 183: 106745. https://doi.org/10.1016/j.ecoleng.2022.106745.
- Klaus, V. H., and K. Kiehl. 2021. “A Conceptual Framework for Urban Ecological Restoration and Rehabilitation.” Basic and Applied Ecology 52: 82–94. https://doi.org/10.1016/j.baae.2021.02.010.
- Krievins, K., R. Plummer, and J. Baird. 2018. “Building Resilience in Ecological Restoration Processes: A Social-Ecological Perspective.” Ecological Restoration 36: 195–207. https://doi.org/10.3368/er.36.3.195.
- Kukkala, A. S., and A. Moilanen. 2017. “Ecosystem Services and Connectivity in Spatial Conservation Prioritization.” Landscape Ecology 32: 5–14. https://doi.org/10.1007/s10980-016-0446-y.
- Kurka, T., and D. Blackwood. 2013. “Selection of MCA Methods to Support Decision Making for Renewable Energy Developments.” Renewable and Sustainable Energy Reviews 27: 225–233. https://doi.org/10.1016/j.rser.2013.07.001.
- Lamb, D. T., K. Venkatraman, N. Bolan, N. Ashwath, G. Choppala, and R. Naidu. 2014. “Phytocapping: An Alternative Technology for the Sustainable Management of Landfill Sites.” Critical Reviews in Environmental Science and Technology 44: 561–637. https://doi.org/10.1080/10643389.2012.728823.
- Lehtomäki, J., and A. Moilanen. 2013. “Methods and Workflow for Spatial Conservation Prioritization Using Zonation.” Environmental Modelling & Software 47: 128–137. https://doi.org/10.1016/j.envsoft.2013.05.001.
- Lehtomäki, J. A., A. J. Moilanen, T. K. Toivonen, and J. Leathwick. 2016. Running a Zonation Planning Project. University of Helsinki.
- Lehtomäki, J., E. Tomppo, P. Kuokkanen, I. Hanski, and A. Moilanen. 2009. “Applying Spatial Conservation Prioritization Software and High-Resolution GIS Data to a National-Scale Study in Forest Conservation.” Forest Ecology and Management 258: 2439–2449. https://doi.org/10.1016/j.foreco.2009.08.026.
- Lei, K., H. Pan, and C. Lin. 2016. “A Landscape Approach Towards Ecological Restoration and Sustainable Development of Mining Areas.” Ecological Engineering 90: 320–325. https://doi.org/10.1016/j.ecoleng.2016.01.080.
- Lynch, A. 2011. “The Usefulness of a Threat and Disturbance Categorization Developed for Queensland Wetlands to Environmental Management, Monitoring, and Evaluation.” Environmental Management 47: 40–55. https://doi.org/10.1007/s00267-010-9562-7.
- Mcalpine, C. A., T. A. Spies, P. Norman, and A. Peterson. 2007. “Conserving Forest Biodiversity Across Multiple Land Ownerships: Lessons from the Northwest Forest Plan and the Southeast Queensland Regional Forests Agreement (Australia).” Biological Conservation 134: 580–592. https://doi.org/10.1016/j.biocon.2006.09.009.
- Menon, S., and K. S. Bawa. 1997. “Applications of Geographic Information Systems, Remote-Sensing, and a Landscape Ecology Approach to Biodiversity Conservation in the Western Ghats.” Current Science 73 (2): 134–145.
- Meynecke, J.-O., S. Lee, and N. Duke. 2008. “Linking Spatial Metrics and Fish Catch Reveals the Importance of Coastal Wetland Connectivity to Inshore Fisheries in Queensland, Australia.” Biological Conservation 141: 981–996. https://doi.org/10.1016/j.biocon.2008.01.018.
- Meynecke, J.-O., S. Y. Lee, N. C. Duke, and J. Warnken. 2006. “Effect of Rainfall as a Component of Climate Change on Estuarine Fish Production in Queensland, Australia.” Estuarine, Coastal and Shelf Science 69: 491–504. https://doi.org/10.1016/j.ecss.2006.05.011.
- Michael, R. N. 2010. Landfill Phytocap Development and Performance Evaluation Using Australian Native Plants.
- Michael, R.N., T. Kim, and R. Fernando. 2023. “Plant Selection for Landfill Phytocaps: Australian Case Studies.” 19th International Symposium on Waste Management and Sustainable Landfilling.Sardinia, Italy. 9-13th October.
- Michael, R. N., B. Yu, S. T. S. Yuen, B. A. Wintle, and I. A. Doronila. 2019. “The Effect of Substrate Compaction on Plant Water use and the Implications for Phytocap Design Specifications.” Ecological Engineering 127: 195–203. https://doi.org/10.1016/j.ecoleng.2018.11.023.
- Michael, R., S. Yuen, A. Baker, S. Laidlaw, and S. Bateman. 2007. “A Sustainable Approach for Hydraulic Control of Landfills Using Quarry Scalpings and Native Plants.” Australian Journal of Multi-Disciplinary Engineering 5: 39–47. https://doi.org/10.1080/14488388.2007.11464755.
- Milton, S. J., and W. R. J. Dean. 2021. “Anthropogenic Impacts and Implications for Ecological Restoration in the Karoo, South Africa.” Anthropocene 36: 100307. https://doi.org/10.1016/j.ancene.2021.100307.
- Moilanen, A., and M. Nieminen. 2002. “Simple Connectivity Measures in Spatial Ecology.” Ecology 83: 1131–1145. https://doi.org/10.1890/0012-9658(2002)083[1131:SCMISE]2.0.CO;2.
- MSES. 2020a. Matters of State Environmental Significance - Fish Habitat Area - A and B Areas - Queensland. Brisbane: Queensland Spatial Catalogue.
- MSES. 2020b. Matters of State Environmental Significance - Wildlife Habitat - Endangered or Vulnerable Wildlife. Brisbane: Queensland Spatial Catalogue.
- MSES. 2020c. Matters of State Environmental Significance - Wildlife Habitat - Special Least Concern Animal. Brisbane: Queensland Spatial Catalogue.
- MSES. 2021. Matters of State Environmental Significance - Protected Area - Nature Refuges - Queensland. Brisbane: Queensland Spatial Catalogue.
- Onuferko, T. M., D. A. Skandalis, R. León Cordero, M. H. Richards, R. Didham, and S. Brady. 2018. “Rapid Initial Recovery and Long-Term Persistence of a bee Community in a Former Landfill.” Insect Conservation and Diversity 11: 88–99. https://doi.org/10.1111/icad.12261.
- Pang, C.-C., W.-F. Lo, R. W.-M. Yan, and B. C.-H. Hau. 2020. “Plant Community Composition on Landfill Sites After Multiple Years of Ecological Restoration.” Landscape Research 45: 458–469. https://doi.org/10.1080/01426397.2019.1674266.
- Pooley, S. 2021. “Biodiversity Hotspot and Ramsar Site Under Threat.” Oryx 55: 811–812. https://doi.org/10.1017/S0030605321001174.
- Pressey, R., and S. Tully. 1994. “The Cost of ad hoc Reservation: A Case Study in Western New South Wales.” Australian Journal of Ecology 19: 375–384. https://doi.org/10.1111/j.1442-9993.1994.tb00503.x.
- QPWS. 2022. Protected Areas of Queensland. Brisbane: Queensland Spatial Catalogue.
- Ramesh, G. 2021. “Importance and Applications of GIS in Engineering.” Indian Journal of Structure Engineering (IJSE) 1 (1): 4–8.
- Reside, A. E., J. Beher, A. J. Cosgrove, M. C. Evans, L. Seabrook, J. L. Silcock, A. S. Wenger, and M. Maron. 2017. “Ecological Consequences of Land Clearing and Policy Reform in Queensland.” Pacific Conservation Biology 23: 219–230. https://doi.org/10.1071/PC17001.
- Rigillo, M., M. Iacoviello, F. Canonic, and G. Milite. 2007. “Model Strategy For Redevelopment Of Closed Landfill." xi International Waste Management and Landfill symposium.Sardinia, Italy.1-5 October.
- Runzhe, G., Y. Peihong, and M. Qian. 2018. “Simulation Research for Ecological Security Pattern Construction Based on Improvement of Water and air Quality in Gui'an New Area.” China Environmental Science 38: 1990–2000.
- Simmons, E. 1999. “Restoration of Landfill Sites for Ecological Diversity.” Waste Management & Research: The Journal for a Sustainable Circular Economy 17: 511–519. https://doi.org/10.1177/0734242X9901700617.
- So, W., and L. Chu. 2010. “Ant Assemblages on Rehabilitated Tropical Landfills.” Biodiversity and Conservation 19: 3685–3697. https://doi.org/10.1007/s10531-010-9922-x.
- Summer, K., and A. Reichelt-Brushett. 2018. “Trace Element Contaminant Uptake in Phytocap Vegetation and Implications for Koala Habitat, Lismore, Australia.” Environmental Science and Pollution Research 25: 24281–24292. https://doi.org/10.1007/s11356-018-2441-0.
- Tarrant, S., J. Ollerton, M. L. Rahman, J. Tarrant, and D. Mccollin. 2013. “Grassland Restoration on Landfill Sites in the East Midlands, United Kingdom: An Evaluation of Floral Resources and Pollinating Insects.” Restoration Ecology 21: 560–568. https://doi.org/10.1111/j.1526-100X.2012.00942.x.
- Unwin, D.. 1996. CHAPTER NINE Integration Through Overlay Analysis : Spatial Analytical. Vol. 4, 140–152. United Kingdom: Taylor & Francis Ltd.
- Vaverková, M. D., M. Radziemska, S. Bartoň, A. Cerdà, and E. Koda. 2018. “The use of Vegetation as a Natural Strategy for Landfill Restoration.” Land Degradation & Development 29: 3674–3680. https://doi.org/10.1002/ldr.3119.
- Venkatraman, K., and N. Ashwath. 2007. “Phytocapping: An Alternative Technique to Reduce Leachate and Methane Generation from Municipal Landfills.” The Environmentalist 27: 155–164. https://doi.org/10.1007/s10669-007-9014-y.
- Venkatraman, K., N. Ashwath, and N. Su. 2011. “Predicting the Site Water Balance of a Phytocapped Landfill Using HYDRUS 1D.” International Journal of Environmental Technology and Management 14: 269–281. https://doi.org/10.1504/IJETM.2011.039274.
- Whisson, D. A., S. Zylinski, A. Ferrari, K. Yokochi, and K. R. Ashman. 2020. “Patchy Resources and Multiple Threats: How do Koalas Navigate an Urban Landscape?” Landscape and Urban Planning 201: 103854. https://doi.org/10.1016/j.landurbplan.2020.103854.
- Williamson, I. P. 1997. “The Future of the Surveying Profession-An Australian Perspective.” Geomatica 51: 387–399.
- Wilson, K. A., K. J. Davis, V. Matzek, and M. E. Kragt. 2019. “Concern About Threatened Species and Ecosystem Disservices Underpin Public Willingness to pay for Ecological Restoration.” Restoration Ecology 27: 513–519. https://doi.org/10.1111/rec.12895.
- Wilson, H. B., L. N. Joseph, A. L. Moore, and H. P. Possingham. 2011. “When Should we Save the Most Endangered Species?” Ecology Letters 14: 886–890. https://doi.org/10.1111/j.1461-0248.2011.01652.x.
- Young, T. P., J. M. Chase, and R. T. Huddleston. 2001. “Community Succession and Assembly.” Ecological Restoration 19 (1): 5–18. https://doi.org/10.3368/er.19.1.5.
- Yuen, S. T. S., R. N. Michael, S. Melissa, J. Mark, and J. Sun. 2010. “Phytocapping as a Cost-Effective and Sustainable Cover Option for Waste Disposal Sites in Developing Countries." International Conference on Sustainable Built Environment. ICSBE-2010, Kandy, Sri Lanka.
- Yuen, S., M. Salt, J. Sun, P. Benaud, G. Zhu, M. Jaksa, H. Ghadiri, M. Greenway, N. Ashwath, and A. Fourie. 2011. “Phytocapping as a Sustainable Cover for Waste Containment Systems: Experience of the A-ACAP Study.” 13th International Waste Management and Landfill Symposium, Sardinia, Italy, 3-7 October.