
 ?Mathematical formulae have been encoded as MathML and are displayed in this HTML version using MathJax in order to improve their display. Uncheck the box to turn MathJax off. This feature requires Javascript. Click on a formula to zoom.
ABSTRACT
To design relevant policy measures and incentives to accelerate the uptake of electric vehicles in Australia, it is important to understand who the early adopters of electric vehicles are, their reasons for choosing an electric vehicle and their levels of satisfaction in driving, charging locations, home charging and other experiences. This article presents the results of a survey of early adopters in Queensland, Australia. The data have been analysed to understand the socio-demographic profiles of early adopters and to explore variations between two groups of adopters: Tesla owners, having the highest uptake of battery electric vehicles in Australia, and non-Tesla owners of battery electric vehicles and plug-in hybrid electric vehicles. The analysis suggests that both groups of early adopters are predominantly male, university educated and have substantially higher incomes than the state average. Peer and media influences, and having a test drive, play a significant role in owning a Tesla.
Introduction
The transport sector, which is expected to grow at a rate faster than any other sector, contributes to more than a quarter of global carbon emissions. Of these global transport emissions, 70 per cent is attributed to road transport that is dominated by conventional internal combustion engine vehicles (ICEVs) fuelled with petrol or diesel (Wang and Ge Citation2019). To decarbonise road transport and mitigate greenhouse gas emissions, many countries are transitioning to electric vehicles (EVs), including plug-in hybrid electric vehicles (PHEVs) and battery electric vehicles, because they are one of the most effective alternatives to ICEVs to reduce carbon dioxide (CO2) emissions (Muneer et al. Citation2015).
In Australia, transport is the fastest growing and the third largest source of national emissions behind the electricity and stationary energy sectors (Australian Government Citation2022). In 2020, the transport sector accounted for 19 per cent of total emissions, of which 85 per cent came from road transport (Australian Government Citation2022). Australia’s road fleet is one of the most energy-intensive fleets in the world. In 2019, the national average for CO2 emission intensity for new light vehicles, consisting of passenger motor vehicles, sports utility vehicles and light commercial vehicles, was 180.5 grams/kilometre, which was only 0.2 per cent lower than the 2018 estimates. This was the smallest improvement in average emission intensity since reporting began in 2002 (National Transport Commission Citation2020). Reducing road transport emissions requires the country’s fleet to transition from ICEVs to EVs. However, Australia is known for its slow progress in transitioning to EVs, given that in 2020 EVs represented only 0.78 per cent of new vehicle sales, which is well behind Norway (74 per cent), the UK (10.7 per cent), China (6.2 per cent) and the United States (2.3 per cent) (Electric Vehicle Council Citation2021).
The current worldwide supply and demand for EVs are supported by a combination of policy measures, from regulatory CO2 emission standards (known as supply-side measures) to financial incentives (known as demand-side measures). It has been suggested that such incentives should be applied at the time of buying an EV (Münzel et al. Citation2019; Hardman et al. Citation2017). In the European Union, supply-side measures, such as stringent regulatory emission standards, have been imposed on car manufacturers and distributors to reduce CO2 emissions at the source, while demand-side measures have supported car manufacturers and distributors to reduce CO2 emissions to meet regulatory targets (at the source) through taxation measures, financial incentives, exemptions and subsidies (Gibson et al. Citation2015).
At the time of our survey in 2020, Australia had no national supply-side measures and limited demand-side measures to encourage the uptake of EVs. Each state and territory government may independently offer incentives. EVs are an unlikely choice of vehicle for consumers because they cost at least twice as much as their equivalent ICEVs and there are limited financial incentives and rebates to reduce the wide cost gap. Despite this clear lack of support, a group of early adopters of EVs in Australia have paid a premium to acquire an EV. It is important to understand their profile and adoption behaviour to devise appropriate policy interventions to promote EV sales in Australia (Vassileva and Campillo Citation2017).
The article adds to the very limited number of studies of early adopters in Australia. The term ‘early adopters’ often refers to the group of consumers who accept or adopt an innovation at the early stages of its introduction (Rogers, Citation1995). While similar studies exist in countries such as Germany (Plötz et al. Citation2014), Sweden (Vassileva and Campillo Citation2017) and Spain (Higueras-Castillo et al. Citation2020), to the best of our knowledge, this study represents one of the first of its kind in Australia. Furthermore, the findings from earlier studies (Broadbent, Metternicht, and Drozdzewski Citation2019; Gong, Ardeshiri, and Rashidi Citation2020) were based on the general population of Australian motorists, examining their likelihood of buying an EV. Since this survey of EV owners in Queensland is of actual adopters and not the general population, the results of the study may not reflect the preference of non-adopters and limits its scope to generalise the entire population.
Previous international studies have indicated that early adopters may not be a homogenous group of consumers and may have been influenced by different factors (Hardman, Shiu, and Steinberger-Wilckens Citation2016). Therefore, the aim of the study is to gain an understanding of early adopters by examining their socio-demographic profiles and motives for EV adoption to identify key differences amongst actual adopters (Lee, Hardman, and Tal Citation2019). To understand the potential variation in motives and experience of early adopters this study compares two groups of early adopters characterised by Tesla ownership.
Globally, only a few studies have compared different groups of early adopters. Earlier studies have shown that Tesla owners display socio-economic characteristics that are different from non-Tesla owners of EVs (Lee, Hardman, and Tal Citation2019). Such studies of Tesla and non-Tesla owners are relevant in Australia because Tesla owners accounted for 66 per cent of EVs acquired in 2019 and 2020, representing 51 per cent of total EV sales (National Transport Commission Citation2020).
Queensland was selected as the study site as the state is representative of EV owners in the more populated states of Australia. As of 30 April 2020, there were 2,220 registered EVs in Queensland, which is about 0.05 per cent of the total car fleet in Queensland (Transport and Public Works Committee Citation2020). In 2022, the uptake of EVs increased in Queensland by 132 per cent in the 12 months to 28 February 2022, from 3,737 to 8,676 vehicles, representing 0.18 per cent of all registered Queensland passenger vehicles (Queensland Government Citation2022).
However, there is no information about the profiles of the early adopters, which makes this study relevant to policy and industry as this is the first comprehensive survey of early adopters of EVs in Queensland. The specific aims of this study are to (1) understand the differences in early adopters’ socio-demographic profiles and motivation to buy EVs and (2) identify the factors affecting Tesla ownership as opposed to non-Tesla EV ownership.
Literature review
General attitudes towards EVs
Existing studies in Australia have mainly focussed on surveying the general population to understand their reasons for actual or intended purchase of an EV. These surveys have focussed on key factors that are relevant at the time of purchasing an EV (e.g. purchase cost, driving range and range anxiety), operational considerations (e.g. lower running and maintenance costs and reduced environmental footprint) and the availability of public charging infrastructure. A survey by Broadbent, Metternicht, and Drozdzewski (Citation2019) identified the barriers and incentives to the uptake of EVs in Australia for private motor vehicle customers. Their online survey of 330 respondents in 2015, of whom only 2.1 per cent were EV owners, found that fuel efficiency and vehicle price were the most decisive issues when buying any car. High purchase price (44 per cent of respondents) and recharging issues (29 per cent of respondents) were perceived as the major barriers to purchasing an EV. When respondents were asked to rank the importance of the following factors in the order that would encourage them to purchase an EV four factors were prioritised: affordability (56 per cent of respondents), an increase in vehicle range (26 per cent of respondents), an adequate recharge network (28 per cent of respondents) and greater consideration of environmental impacts (13 per cent of respondents). In another study, Gong, Ardeshiri, and Rashidi (Citation2020) surveyed 1,076 New South Wales residents in 2018 to examine their preferences and attitudes towards EV acquisition. The study found respondents were very sensitive to the purchase price of EVs and preferred rebates, if available, on the upfront price of EVs.
The Electric Vehicle Council’s annual survey of 2,902 Australians in 2020 (Electric Vehicle Council Citation2020) found that 56 per cent were ready to consider purchasing an EV as their next vehicle (an increase of eight percentage points from 2018). However, 68 per cent of the respondents called for government subsidies to reduce the cost of EVs as the price was still considered a major barrier. The driving range of a single battery charge discouraged EV purchases even though almost 80 per cent of consumers had underestimated the ranges of the EVs currently available in Australia. Further, respondents placed importance on the availability of charging infrastructure. In terms of the source of electricity for the EVs, 31 per cent of the respondents would use solar panels or battery storage, 21 per cent would purchase from the grid through standard contracts, and 14 per cent would use green-power contracts or carbon offsets. The remainder either did not know or were not concerned about the electricity source (Electric Vehicle Council Citation2020).
The Royal Automobile Club of Victoria conducted its fifth annual survey of Victorian consumers’ attitudes to EVs in partnership with the Electric Vehicle Council of Australia (Nicholson Citation2020). More than 1,000 Victorians were surveyed in May 2020, with 60 per cent of the respondents saying that they would consider buying an EV, which was an increase of 13 percentage points from 2019. Thirty-one percent of the respondents were willing to buy an EV if the vehicle’s price was the same as equivalent petrol or diesel vehicles, while 19 per cent had no interest in buying an EV, irrespective of the price. Range anxiety and the limited choice of models were identified as key deterrents to purchase. In terms of the source of electricity for the EVs, the responses were mixed: about 30 per cent were keen to use solar and battery, another 30 per cent did not care where the energy came from, 25 per cent were happy to buy it from the grid, and the remainder (15 per cent) preferred to buy from the grid via a green-power contract (Nicholson Citation2020).
In summary, current surveys indicate that ‘mainstream consumers’ are interested in buying an EV if its price is competitive with ICEVs but they require financial incentives. Most consumers in Australia, other than those who are early adopters of EVs, are unwilling to pay a premium for EVs.
Characteristics of early adopters
It is important to understand the characteristics of early adopters as they may be different to the general population (Bjerkan, Nørbech, and Nordtømme Citation2016; Lee, Hardman, and Tal Citation2019). Previous studies conducted in Austria (Wolf and Seebauer Citation2014), Canada (Axsen, Goldberg, and Bailey Citation2016), Germany (Plötz et al. Citation2014), the United States (Hardman, Shiu, and Steinberger-Wilckens Citation2016) and Sweden (Vassileva and Campillo Citation2017) showed that early adopters were likely to be from the middle to high-income group, middle-aged, typically males, with graduate or postgraduate degrees and technologically and environmentally inclined.
Many studies have found that the characteristics of early adopters of EVs often have different socio-economic profiles and motivations to purchase an EV than non-adopters and late-adopters (Berliner, Hardman, and Tal Citation2019). The report of early adopters of EVs in Norway showed EV drivers usually had a higher income and higher education than the general population. They were highly motivated by economic savings and/or environmental issues (Amsterdam Roundtables Foundation Citation2014). In Germany, Plötz et al. (Citation2014) found that most potential and current EV owners were middle-aged, full-time employed, males, living in multi-person households and outside the cities. They mostly commuted daily to work, driving a significant number of kilometres, which made EVs more attractive and profitable for them from an economic and environmental point of view.
Differences between Tesla and non-Tesla adopters of EV
Only a few studies have systematically examined the differences between various groups of early EV adopters (Axsen et al. Citation2018; Hardman, Shiu, and Steinberger-Wilckens Citation2016; Lee, Hardman, and Tal Citation2019). Lee, Hardman, and Tal (Citation2019) found the relative lack of these studies could be due to the difficulties in gathering data sets of EV buyers.
Hardman, Shiu, and Steinberger-Wilckens (Citation2016) hypothesised that a new market segment of high-end EVs was created with the introduction of Tesla Model S in 2012, which at the time cost between USD70,000 and 105,000 and had a range of 270 miles (434 kilometres). Prior to this, all EVs on the market were low-end EVs, having a price range of USD$30,000-40,000. They surveyed the owners of 340 EVs and explored whether there were differences between the two groups of early adopters, which they identified as ‘high-end’ (predominantly Tesla owners) or ‘low-end’ (predominantly non-Tesla owners) EV adopters, and whether they viewed their vehicles differently. They found that both groups had a low number of females; Tesla (high-end) adopters had achieved higher education and were older than low-end adopters; and while both sets of adopters had high incomes, the high-end adopters’ income was significantly higher than that of the low-end adopters. In terms of satisfaction, high-end adopters believed their vehicles were better than ICEVs, whereas low-end adopters believed their vehicles had disadvantages, such as range, time to refuel and purchase price, compared to ICEVs.
Lee, Hardman, and Tal (Citation2019) conducted a latent class analysis of 11,037 EV adopters in California. They found four distinct classes of early adopters, mostly separable in terms of their income and family composition: high-income families (49 per cent), mid/high-income older families (26 per cent), mid/high-income young families (20 per cent) and middle-income renters (5 per cent). On the basis of their findings they suggested that marketing strategies should target middle-income families to utilise their untapped potential. Finally, Axsen et al. (Citation2018) found a strong relationship between peoples’ lifestyle choices and motivation to own an EV, and suggested that policy makers should consider a variety of motivations for owning an EV. However, as mentioned above, we are not aware of any study that has examined such heterogeneity among early adopters of EVs in Australia. Our study contributes to this knowledge gap.
Methods
In this section, the theoretical framework used in the article is presented. Then the survey design and the data analysis are explained.
A theoretical framework for electric vehicle adoption
While the technology adoption literature has proliferated with many models and theories that explain the dissemination and adoption of emerging technologies, the framework adopted in this article builds on Rogers (Citation1995) theory of diffusion of innovation. The theory outlines four key elements: the innovation itself, communication, time and the social system. Innovations refer to new ideas, methods, processes or products that introduce significant improvements or changes to existing practices or create entirely new opportunities. For an individual or organisation to embrace an innovation, it must be perceived as new. This process involves assessing the characteristics of the innovation, including relative advantage, compatibility, complexity, trialability and observability. The communication aspect emphasises the importance of information sharing among individuals adopting the innovation. The third component, time, unfolds as the adopter goes through several distinct stagesFootnote1: knowledge, persuasion, decision, implementation and confirmation. The final component of the theory is social system which describes the role of the individuals and organisations (such as opinion leaders, change agents, and champions) in influencing diffusion (Lundblad Citation2003). In this article, the key elements of the theory of diffusion of innovation are combined with economic theory of expected utility. This integrated approach holds significance in the literature on innovation adoption, considering that both adopter characteristics and the perceived attributes of the innovation have been identified as crucial factors in the adoption process (Plötz et al. Citation2014).
First, we examine the question from the perspective of the adopter. Rogers (Citation1995) proposed five groups based on stages of adoption: innovators, early adopters, early majority, late majority, and laggards. Innovators are characterised by their tendency to actively seek innovations. Early adopters, while open to change, are more closely connected to the existing social system and exhibit a more cautious approach than innovators. The early majority take a more deliberate approach but tend to adopt innovations before the average member of a social system. The late majority adopt innovation at a slower pace. Finally, the laggards are the last group to adopt an innovation. While Rogers (Citation1995) identifies early adopters as the second group, characterised typically by younger people with higher social and financial status and education compared to the other groups, some recent researchers tend to combine innovators and early adopters into a single category (Santini and Vyas Citation2005). While not definitive on this point, most of the scholarly literature on early adopters tends to suggest that they play a significant role in creating a market momentum for the adoption of innovations (Frattini et al. Citation2014). In this study, we adopt this term in a more practical way, that is, within the context of EV adoption in Australia, and interpret the present cohort of EV users as early adopters, playing a pivotal role in driving the uptake of EVs in the country.Footnote2
Second, we analyse the question from the perspective of the innovation itself. Purely economic, utility-based approaches are commonly used in the literature to explain the perceived attributes of innovations. This approach suggests that the expected utility from adopting new technology should exceed the utility of traditional technology for it to be accepted (Batz, Peters, and Janssen Citation1999; Lahiri and Ratnasiri Citation2012). These two notions are incorporated into our model in the context of adopting the new EV technology in Australia. Thus, the basic construct of the model in this article unifies Expected utility and Perceived usefulness in the form of a unique variable to explore the adoption behaviours of Australian EV owners (). The model considers that the Expected utility or Perceived usefulness of an emerging technology is influenced by external factors such as age, gender, income, types of dwellings in which consumers live, and the level of education. These external factors act via two channels. The first is related to prior experience of using EVs. For example, in the survey, questions were asked about whether the respondents had a test drive or any other form of experience using EVs. The second channel is related to the knowledge and attitudes of the consumers. Knowledge mainly refers to the understanding and proficiency of concepts through learning and study (Wang et al. Citation2018). Knowledge is derived in this study from various factors such as research undertaken and information received from previous users.
Figure 1. A basic theoretical framework for electric vehicle adoption and Tesla ownership.
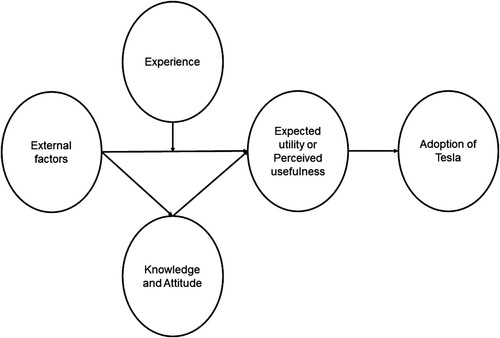
While many researchers confirm that psychological factors such as emotion and attitude strongly influence usage intention, Wang et al. (Citation2018), Carley et al. (Citation2013) and Degirmenci and Breitner (Citation2017) specifically suggested that environmental concerns play a key role in the adoption of EVs. In the current survey, attitudes towards purchasing EVs was examined by having questions such as preference for the latest and exciting technology or CO2 emissions to identify any environmental concerns. These two factors together influence the behaviours of the EV adopters that eventually connect the adoption of EVs, in particular adoption of Tesla in Australia.
Questionnaire design
The questionnaire was designed in collaboration with Energy Queensland and the Department of Transport and Main Roads Queensland. The questionnaire consisted of three sections. The first section gathered the socio-economic profile of the respondents, the second section asked the respondents about their motivation to purchase, and the third section asked them about their use of EVs, with charging practices and energy considerations.
Socio-economic characteristics
To understand the respondents’ socio-economic characteristics, questions were asked about gender, age, combined household gross income, highest level of education, employment status, type of residence, location of residence (city dweller, suburban or rural), number of adults in the household, dwelling type, type of EV owned and number of vehicles (including EVs).
Motivation and attitudes
To understand the motivating factors behind purchasing an EV, the respondents were asked to express their agreement with a set of statements that included purchase cost, saving on ownership costs, latest technology, driving range on a single charge, low or zero CO2 emissions, fuel efficiency, vehicle performance in terms of acceleration and speed, and ability to charge their EV at home. The respondents were asked to indicate their level of agreement on a 7-point Likert scale on what they considered relevant when purchasing their EV: strongly disagree, disagree, somewhat disagree, neither, somewhat agree, agree and strongly agree. However, for simplicity, the responses have been merged into three groups ‘Agree’, ‘Neutral’ and ‘Disagree’ for analysis as they reflect the general trend in responses.
Experience of early adopters’ use of EVs – charging and energy
To learn the adopters’ use of EVs, respondents were asked about their driving ranges and patterns (weekday and weekend driving patterns expressed in the number of kilometres travelled per day). Further, their overall satisfaction of driving range was asked. Their energy use and charging information was gathered in terms of the source of electricity, place of charging, charging time of the day, charging hours, and availability of charging and fast charging infrastructure.
Finally, early adopters’ level of satisfaction concerning their EV driving range, battery charging time and availability of charging and fast charging infrastructure was captured on a 7-point Likert scale (ranging from extremely dissatisfied to extremely satisfied) statements. However, for simplicity, their responses have been aggregated into three groups: satisfied, neutral and dissatisfied for analysis.
Sampling procedure
A purposive sampling framework was used to recruit early adopters of EVs to participate in the online questionnaire. Because of the privacy laws in Australia and the inability for state governments to contact EV owners, indirect methods were used to contact EV owners. The methods included media releases on the Griffith University and Queensland Government websites, requests on local radio, presentations at local EV associations, and media releases on car websites and Facebook EV-owner forums for Tesla, Nissan Leaf and Hyundai Kona owners. Potential respondents were directed to an online information flyer notifying EV owners that Griffith University researchers, together with Department of Transport and Main Roads Queensland and Energy Queensland were conducting a survey of ‘Early Adopters of Electric Vehicles’ with an online link to a survey, which had been granted ethics approval from the University. The online survey was conducted between January and April 2020, with two reminder notices resulting in 348 survey responses. According to the Australian Bureau of Statistics Motor vehicle survey, 2021, EVs accounted for less than 1.8 per cent (23,000 EVs) of all types of vehicle registrations in Australia (ABS Citation2021). Queensland recorded 31 per cent (7,129) of Australian EVs in 2021 (Queensland Government Citation2021). Our sample, therefore, covers about 5 per cent of the EV owners in Queensland.
Data analysis
Before undertaking the econometric estimation, a simple descriptive analysis was carried out to explore the key features of the sample in terms of socio-demographic, economic and psychographic features of adopters, motivating factors when purchasing an EV and EV use and experiences.
The first step in the econometric estimation was to group the respondents into two categories: Tesla and non-Tesla owners. shows the different EV makes owned by the respondents. Around 63 per cent of the respondents are Tesla owners, followed by non-Tesla owners whose vehicles include Hyundai (15 per cent), Nissan (9 per cent) and Mitsubishi (7 per cent). Tesla models have a better range and battery that justifies somewhat their high retail price compared to the other models. This shows a clear trade-off between cost and quality.
Table 1. Selected characteristics of Tesla and non-Tesla models.
To explain the variation in the socio-demographic characteristics between Tesla and non-Tesla owners, simple descriptive analysis, chi-squares tests and regression analysis were carried out. The survey covered several attributes of the adopters such as their social and economic characteristics, demographic features and risk and preferences for adopting technologies such as EVs. For categorical variables, the chi-square analysis was used to test the measurement of association between ownership of Tesla and non-Tesla vehicles and individual socio-economic factors. For continuous variables, the Kolmogorov–Smirnov test was conducted.Footnote3 However, such analysis could not consider the multiple factors simultaneously. Therefore, a regression estimation that considers the effect of multiple variables was used to explain the determinants of Tesla ownership.
Tesla ownership was analysed based on random utility theory (McFadden Citation1986), which assumes that an individual will receive different levels of utility from owning a Tesla or a non-Tesla
vehicle. An individual will purchase a Tesla only if such a choice provides greater utility than owning a non-Tesla vehicle, that is,
. To operationalise this concept, a logistic regression format was used where the dependent variable is a binary variable indicating whether a respondent is a Tesla owner or not. The model is given in the following form:
(1)
(1) where
is the probability of observing an outcome, that is, in our analysis the probability of a respondent owning a Tesla. The probability depends on the estimation of regressor vector
, parameter vector
and an intercept
.
To understand which factors could influence Tesla ownership, we have included several variables in the model based on the theoretical framework presented above. However, the number of observations included in this analysis was limited by the availability of good-quality responses in the survey. We used information from 304 respondents in the regression model for whom we had complete data on relevant variables.
The main explanatory variables we considered were income, age, level of education, number of adults in the household, dwelling types, residential location and the source of influence. The existing literature has identified income and age as significant factors of EV ownership. We have included both variables after appropriate conversion. The income variable was created using the annual gross income of the respondents.Footnote4 The age variable was also collected as a categorical variable and a similar conversion method was adopted.Footnote5 The existing literature suggests that both income and age might have a non-linear effect on EV ownership (Hardman and Tal Citation2016). Therefore, both variables have been included as a logarithm to capture the possible non-linear effect.
Education is a dummy variable to indicate if the respondent had received education at bachelor degree level and above. The number of adults in each household was included to approximate the expenditure related to family size. Dwelling type and the residential location were included to understand the effect of dwelling type and location. Along with these socio-economic variables, responses to the following question were included in the regression analysis to understand the sources of influence that facilitate the purchase of EVs: ‘What encouraged you to purchase an electric vehicle?’Footnote6
Given that it is difficult to interpret the coefficients from logistic regressions directly, a common practice is to estimate the marginal effect of individual variables, which captures the probability of observing an outcome given a unit change in a continuous regressor. For discrete variables, it is the change in the probability due to moving from the base level to the alternative level. Stata 16 was used to analyse the data.
Results and discussion
Socio-demographic, economic and psychographic features of adopters
presents the socio-demographic characteristics of the sample. The third and fourth columns show statistics relevant to non-Tesla and Tesla groups while the fifth column shows statistics for the whole sample. The final column shows Queensland statistics, where available, for benchmarking against sample values. The number of observations related to each question and the test statistics examining the association between vehicle ownership and socio-economic factors are also presented. The frequency distributions have been presented as a percentage of the respective group total for easier comparison among Tesla, non-Tesla, total sample and Queensland groups.
Table 2. Socio-demographic characteristics of the groups.
Early adopters were predominantly male (84 per cent), which contrasts with the Queensland statistics. However, a similar imbalance was observed between males and females in other studies. For example, a survey of early adopters of EVs in Sweden (247 respondents) had a similar gender distribution to Queensland (Vassileva and Campillo Citation2017). There were more males (88 per cent) in the Tesla group than the non-Tesla group (77 per cent), and there was a statistically significant association between ownership type and gender (Chi-square = 10.39**, ).
The sample group had an average age of 49 years, which is older than the Queensland population. The average age of the Tesla group (48 years) was slightly lower than the non-Tesla group (53 years) which was statistically significant (Kolmogorov–Smirnov = 0.18***, ). The average household income in the sample was substantially higher than the Queensland median income. Further, the Tesla group had significantly higher household income than the non-Tesla group (Kolmogorov–Smirnov = 0.28***, ).
The level of education for the sample was also substantially higher than the Queensland levels, with 66 per cent of respondents having a bachelor or higher degree. However, there was no statistically significant association between Tesla ownership and level of education indicating that early adopters were generally more highly educated.
The majority of the respondents were employed (60 per cent), a small group was self-employed (19 per cent) and the remainder had retired (18 per cent). There is a slight variation in employment between the Tesla (65 per cent employed) and non-Tesla (54 per cent employed) groups. This resulted in a weak statistically significant association between Tesla ownership and employment status (Chi-square = 11.47*, ).
The number of adults in the household followed a similar pattern to the Queensland statistics and there was no variation between Tesla and non-Tesla groups. Dwelling type was also similar and there was no significant difference between Tesla and non-Tesla groups. It is interesting to note that most of the respondents (68 per cent) lived in suburban areas as opposed to city and rural areas, which contrasts with the Queensland statistics. This could reflect the purposive nature of our sampling. Finally, the vehicle ownership rate was higher in the sample group than in the Queensland statistics, even though there was no statistical association between Tesla ownership and vehicle ownership rate.
In summary, EV owners in Queensland are predominantly male, slightly older than the general population, better educated, predominantly living in detached houses in suburban areas, and they possess more vehicles on average than the Queensland population. Such characteristics are strongly consistent with the observations made in studies in Austria (Wolf and Seebauer Citation2014), Canada (Axsen, Goldberg, and Bailey Citation2016), Germany (Plötz et al. Citation2014), the United States (Hardman, Shiu, and Steinberger-Wilckens Citation2016; Canepa, Hardman, and Tal Citation2019) and Sweden (Vassileva and Campillo Citation2017). We observed some variations between Tesla and non-Tesla groups in terms of gender, age, income and employment based on the chi-square tests. These differences were explored further through regression analysis.
Motivating factors when purchasing an EV
shows that environmental concern was the most relevant factor for early adopters when purchasing their EVs. Overall, about 92 per cent of respondents supported the statement ‘EV emits low or zero carbon dioxide emissions’ as one of the motivating factors that influenced purchase of an EV. This supports the literature findings that early adopters who are highly educated are usually environmentally sensitive (Hardman, Shiu, and Steinberger-Wilckens Citation2016), and being more concerned about the environment means they are more likely to adopt EVs (Vassileva and Campillo Citation2017). Burs et al. (Citation2020) also made a similar observation that environmental concerns were a strong driver of EV adoption. More non-Tesla owners agreed with the statement than the Tesla group even though the difference was not statistically significant. Hardman, Shiu, and Steinberger-Wilckens (Citation2016) also found that Tesla owners were less motivated by environmental concerns than non-Tesla owners.
Table 3. Motivating factors that encouraged early adopters to purchase an EV.
Convenience of charging their EV at home was the second most supported statement; all the respondents in the Tesla group and 86 per cent of non-Tesla group agreed with the statement. This was supplemented by the fact that a high percentage of early adopters live in detached houses (86 per cent), with only 6 per cent living in townhouses and 7 per cent living in units/apartments (). Charging at an apartment/unit was recognised as a barrier to the widespread uptake of EVs because the owners need to have the ability to charge at home to increase the uptake of EVs (Grote et al. Citation2019). The existing literature also found that most adopters have a strong preference to charge their vehicles overnight at home, instead of using public or workplace infrastructure (Anable, Schuitema, and Stannard Citation2014; Grote et al. Citation2019; Plötz et al. Citation2014).
The next important consideration for EV adopters was saving on ownership costs (87 per cent) with both groups placing similar importance on this factor. Financial savings have been cited as one of the strongest motivators of consumer interest in EVs (Breetz and Salon Citation2018). It was expected that low running and maintenance costs would offset the high purchase cost of an EV (Hardman, Shiu, and Steinberger-Wilckens Citation2016), meaning that these savings are a significant contributor to the likelihood of continuing with EV ownership. If the net cost over the lifespan of an EV is not less than that of an ICEV, current EV owners may switch back to ICEVs.
The statement about the driving range on a single charge also received relatively strong support (84 per cent) and shows a statistically significant association between Tesla ownership and the level of agreement (Chi-square = 4.60*, ). Furthermore, data show that this was more important for Tesla owners than non-Tesla owners (97 per cent vs 80 per cent). Tesla as a brand focuses more on long range EVs than most other EV models; this explains the stronger support from Tesla owners.
The statement about the latest and exciting technology also received strong support (81 per cent overall), even though there was difference between the two groups. Ninety percent of Tesla owners and 77 per cent of non-Tesla owners supported the statement. Tesla's brand has played an important role in the perception of EVs and conveys an image of ‘high performance’ and ‘intelligence for the future’ with societal benefits of helping to reduce climate change and air pollution (Long et al. Citation2019). The survey findings support the importance of the technology levels of EVs. Studies have reported that some consumers are reluctant to choose EVs due to their low level technology compared to ICEVs (Jang and Choi Citation2021).
Fuel efficiency is slightly more relevant for non-Tesla (81 per cent) owners than Tesla (76 per cent) owners. Although the EV purchase price has been identified as a barrier in surveys with the general population (Nicholson Citation2020), only 74 per cent of early adopters (overall) ranked it as a relevant consideration. de Rubens (Citation2019) also made a similar observation about the low priority of EV purchase cost to early adopters. Finally, vehicle acceleration and speed were very important for Tesla owners, with more than 97 per cent of respondents agreeing with the statement, compared to only 59 per cent of respondents in the non-Tesla group. This showed a strong statistical association between Tesla ownership and the importance of acceleration and speed (Chi-square = 14.03***, ). In summary, while there is general agreement between the two groups, preferences for two performance-related attributes – driving range and acceleration and speed – set the Tesla and non-Tesla groups apart.
The statements discussed above mainly refer to vehicle attributes. However, respondents were also influenced by social factors such as EV ownership status of friends and families, and social media (). The largest influencing factor for motivation and/or information was the internet. Overall, 35 per cent of respondents in both Tesla and non-Tesla groups researched EVs before purchasing them. Self-identifying as a pro-technology enthusiast was a contributory factor with 33 per cent of the respondents in the Tesla group and 22 per cent in the non-Tesla group stating this influenced their purchase. Test driving an EV also facilitated its purchase, particularly for Tesla owners. There is a strong statistical association between Tesla ownership and sources of information (Chi-square = 23.35***, ) which we explore further in the regression analysis.
Table 4. Source of information.
The combined effect of socio-economic factors on Tesla ownership
The combined effect of key socio-economic variables on Tesla ownership has been modelled through a logistic regression (). The signs of the coefficients indicate whether a variable has a positive or negative effect on the ownership. The associated marginal effects of the discrete variables indicate the extent of the impact. Both income and age have been included as a logarithm to capture the non-linear effect. Therefore, their impacts have been predicted over relevant ranges and are presented in .
Figure 2. Changes in the probability of ownership with income (a) and age (b).
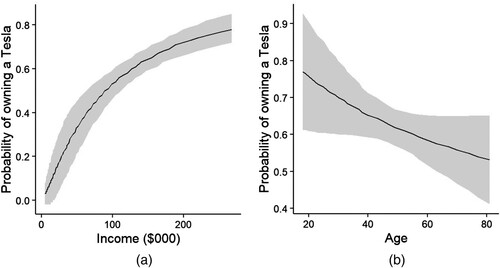
Table 5. Results of the regression model.
shows that income has a positive effect on Tesla ownership. The probability of owning a Tesla at the lowest observed income level ($20,000) is about 14 per cent compared to owning a non-Tesla, which increases to 65 per cent for households with an annual gross income of $155,000 (). The observed positive effect of income on Tesla ownership is supported by the existing literature (Hardman et al. Citation2017). In contrast to the effect of income, age has a statistically significant negative effect on Tesla ownership. The probability of owning a Tesla compared to a non-Tesla drops from 77 per cent at age 18 to 62 per cent at 49 years of age (). It seems that older generations do not prefer high-end EVs, which could be linked to the decreased earning capacity of the older adopters.
The remaining explanatory variables do not have much influence except for the variable capturing social influence. It seems peer influence (i.e. having a friend with EV) has the largest influence on purchasing a Tesla. Reading and gathering information through media and test driving a a Tesla also improves the prospects of owning a Tesla. As expected, consumers in our sample with pro-technology enthusiasm were also likely to own a Tesla. Similar evidence was found in studies by Axsen, Bailey, and Castro (Citation2015), Hardman et al. (Citation2017), Jansson (Citation2011) and Kurani, Caperello, and Hageman (Citation2016).
EV use and user experience
After discussing the socio-demographic profile of early adopters of EVs and examining the key factors influencing Tesla ownership, EV use and user experience in terms of the distance travelled, charging and charging times and the overall level of satisfaction are now summaried.
Distance travelled
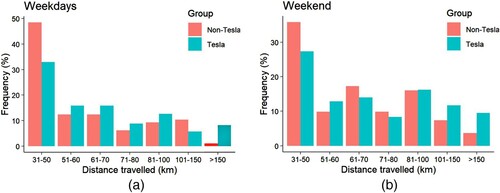
Overall, 39 per cent of the respondents, comprising 33 per cent of Tesla owners and 48 per cent of non-Tesla owners, drove on average fewer than 50 kilometres per day during the week (). There is a significant association between Tesla ownership and weekday driving patterns (chi-square = 11.806*). However, there is no statistical association between Tesla ownership and weekend driving patterns (chi-square = 5.18).
Figure 3. Distribution of respondents by distance travelled per day during weekdays (a) and weekends (b).
Charging and time of charging EV: grid and or renewable energy
Respondents were asked how they sourced their household electricity supply as it could indicate their tendency to adopt new technology and energy conservation behaviour (). There is a statistically significant association between the type of EV owned and the source of electricity (chi-square = 11.83***, ). About 29 per cent of Tesla owners relied on the electrical grid for their energy, which is much higher than the non-Tesla group (11 per cent). Tesla owners (46 per cent) relied much less on a combination of grid and solar PV, which is much higher for the non-Tesla group (68 per cent). Very few relied on or use solar alone. On average, 71 per cent of all respondents charged their EVs at home and there was no significant difference between the two groups.
Table 6. Source of household electrical supply and time of charging.
The battery charging time of day varied: 65 per cent charged their batteries during low tariff periods (late night 9 pm – 6 am), 11 per cent from morning to midday, 16 per cent during early afternoon (midday to early evening – 6 pm), and only 7 per cent at peak time from 6 pm to 9 pm. The time of charging was similar between the two groups. However, there were variations in charging patterns between the two groups. Over half of the Tesla owners recharged their batteries when they were above 50 per cent charge as Tesla batteries have a longer range; thus, Tesla owners spent less time charging batteries. On the other hand, only 37 per cent of the non-Tesla owners recharged their batteries above 50 per cent charge as they required more frequent recharging. They also spent more time charging their EVs.
Level of satisfaction in driving range and charging
Finally, early adopters’ level of satisfaction concerning their EV is reported in . shows that both groups expressed a high level of satisfaction with overall driving range and battery charging times. However, the availability of charging and fast charging infrastructure were major concerns. In general, a higher proportion of Tesla owners expressed satisfaction compared to non-Tesla owners. This is consistent with the findings of Hardman, Shiu, and Steinberger-Wilckens (Citation2016) who showed that Tesla owners, whose vehicles have a longer driving range, are less likely to charge away from home and have to charge less often. However, non-Tesla owners, whose vehicles have a shorter driving range, require more frequent recharging events and are more reliant on the availability of charging infrastructure.
Table 7. Level of satisfaction in driving range and charging.
In summary, our analysis suggests that early adoption of EVs in Queensland is mostly confined to a specific group. That is, the typical early adopters have socio-economic characteristics that are similar to their international peers: they are predominantly male, university educated and have higher incomes. Further, our study demonstrates that there are socio-demographic differences between the Tesla and non-Tesla groups. As observed in , high income households and younger people are more likely to own a Tesla which implies that affordability and age are important factors for Tesla ownership. Reducing CO2 emissions was the most relevant consideration in purchasing EVs and the purchase premium of EVs was of lower priority for both early adopter groups.
There were differences between the two groups with respect to vehicle performance in acceleration and speed, which are: latest technology, long range, driving on a single charge and source of household energy. However, there was no variation in the distances driven (fewer than 50 kilometres/day), and charging occurred mainly at home (over 70 per cent of the respondents). This observation supports the literature that the convenience of charging from home is a key factor in EV ownership (Hardman, Berliner, and Tal Citation2019). Further, EV owners have a strong preference to charge their vehicles at home rather than using public charging infrastructure (Grote et al. Citation2019).
There were some limitations to our study. The current research only focused on one state in Australia, Queensland, and identified the main factors that were relevant for early adopters in purchasing, driving and charging EVs. Because of the privacy laws in Australia, and the inability of state governments to contact EV owners, it was not possible to contact EV owners directly. Thus, we used indirect methods including social media which made it difficult to collect data on all relevant variables. Future studies should examine mainstream consumers to comprehensively understand the influence of various socio-economic and other factors that are critical on their attitudes to EVs across Australia.
Conclusion
For successful transition of the Australian transport sector to a more sustainable energy-efficient industry, it is necessary to understand the characteristics and motivations of people who have already adopted EVs (Bjerkan, Nørbech, and Nordtømme Citation2016). Identifying diversity among early adopters will help policy makers to develop more targeted incentive programs and allow auto-makers and car dealers to understand the future buyers of EVs (Kumar, Pritha, and Abhishek Citation2022; Lee, Hardman, and Tal Citation2019). This is one of the first studies to analyse the socio-economic characteristics of the early adopters of EVs in Australia.
Our data show that the convenience of home charging was an important consideration for both Tesla and non-Tesla owners, with both groups of EV owners having a low reliance on public charging infrastructure. Because not all potential owners of EVs will have access to home charging, public charging infrastructure will be important to meet future needs. Additionally, public charging insfrastructure is important to alleviate range anxiety when taking long distance trips (Lee et al. Citation2020; Globisch et al. Citation2019). Funke et al. (Citation2019) found public charging infrastructure was only needed in densely populated (metropolitan) areas with low availability of home charging infrastructure.
Australia’s lack of policy measures to offset the high price barrier of EVs with financial incentives such as tax exemptions and subsidies, and regulatory emission standards, has had a significant impact on the rate of diffusion of EVs and resulted in the country’s very low EV adoption rate (National Transport Commission Citation2020). Our survey found that the early adopters were prepared to pay the premium price of an EV. Without the support of financial incentives, EVs are out of reach of mainstream consumers who are unwilling to pay the premium price. Finally, the survey indicates that the early adopters have been significantly influenced by their peers, media and experience of test driving and are motivated by the environmental and financial benefits of owning an EV. Therefore, strategic communication and marketing activities should be undertaken to promote EV adoption.
Ethics approval
The survey was conducted with the ethics approval of Griffith University (GU Ref No: 2019/1031).
Author contributions
AM: Conceptualization; Data curation; Funding acquisition; Writing – original draft; SR: Formal analysis; Writing – review & editing; and MSI: Formal analysis; Writing – review & editing.
Acknowledgements
We thank the Queensland Government, Transport & Main Roads and the Energy Queensland Group for their input into the development, review, promotion and distribution of the survey. We gratefully acknowledge the Australian Electric Vehicle Association (Brisbane) and the Tesla Owners Club (Australia) for their help in promoting the survey. Talei Daly-Olm provided research support. The Accounting Finance and Economics Energy Cluster, Griffith University provided financial support. M S Iftekhar acknowledges funding support from the Australian Research Council's Discovery Early Career Researcher Awards grant (ARC DECRA grant number DE180101503).
Disclosure statement
No potential conflict of interest was reported by the author(s).
Notes
1 Another element of time is the stages of adoption: innovators, early adopters, early majority, late majority and laggards.
2 Our framework also aligns with the essence of models such as Davis (Citation1989) that explain technological acceptance and its variants (Venkatesh and Davis Citation1996; Venkatesh and Bala Citation2008). The technology acceptance model of Venkatesh and Davis (Citation1996) considers the consumer’s acceptance of emerging technologies.
3 It should be noted that the number of observations (respondents) were different for different chi-square and Kolmogorov-Smirnov test as not all respondents answered all questions. The exact numbers of observations have been reported against individual test statistics in the tables.
4 Respondents were asked to identify their gross household income from a list of 13 income categories: ‘Less than $11,000’, ‘$11,000 to $30,999’, ‘$31,000 to $50,999’, ‘$51,000 to $70,999’, ‘$71,000 to $90,999’, ‘$91,000 to $110,999’, ‘$111,000 to $150,999’, ‘$151,000 to $200,999’, ‘$201,000 to $250,999’, ‘$251,000 or more’, ‘Zero’, ‘Don’t know’, and ‘Prefer not to answer’. The categorical variable was converted into a continuous variable for the analysis. For the first nine categories mid-points of individual categories were calculated by taking the average of the lower and upper bounds of each category. The ‘$251,000 or more’ category does not have any upper bound. Therefore, an amount equal to half of the difference between the upper and lower bound of the previous income category was added to ‘$251,000’ to calculate the mid-point. Responses to the last two categories were treated as missing information.
5 Respondents were asked to identify their age from a list of 15 age categories: ‘18-19’, ‘20-24’, ‘25-29’, ‘30-34’, ‘35-39’, ‘40-44’, ‘45-49’, ‘50-54’, ‘54-59’, ‘60-64’, ‘65-69’, ‘70-74’, ‘74-79’, ‘80-84’ and ‘Prefer not to say’. The categorical variable was converted into a continuous variable by taking the average of the lower and upper bounds of each category. Responses to the last category was treated as missing information.
6 The respondents were asked to select their most preferred option from a set of seven responses: ‘I am a pro-technology enthusiast’, ‘I have a friend with an EV’, ‘I read about EVs in the media’, ‘I read/researched EVs on the internet’, ‘I read/researched about EVs in the Green Vehicle Guide’, ‘I test drove an EV’, and ‘Other (please specify)’ .
References
- ABS. 2021. Motor Vehicle Census, Australia. Australian Bureau of Statistics.
- Amsterdam Roundtables Foundation. 2014. “Electric vehicles in Europe:gearing up for a new phase?” Retrieved from McKinsey & Company: https://www.mckinsey.com/featured-insights/europe/electric-vehicles-in-europe-gearing-up-for-a-new-phase.
- Anable, J., G. Schuitema, and J. Stannard. 2014. Consumer Responses to Electric Vehicles Literature Review (Report for Energy Technologies Institute Plug-In Vehicles Infrastructure Project (June 2010). Transport Research Laboratory Published Project Report PPR728). Wokingham, UK: TRL.
- Australian Government. 2022. “National Electric Vehicle Strategy Consultation Paper.” Department of Climate Change, Energy, the Environment and Water.
- Axsen, J., J. Bailey, and M. A. Castro. 2015. “Preference and Lifestyle Heterogeneity Among Potential Plug-in Electric Vehicle Buyers.” Energy Economics 50: 190–201. https://doi.org/10.1016/j.eneco.2015.05.003.
- Axsen, J., J. Cairns, N. Dusyk, and S. Goldberg. 2018. “What Drives the Pioneers? Applying Lifestyle Theory to Early Electric Vehicle Buyers in Canada.” Energy Research & Social Science 44: 17–30. https://doi.org/10.1016/j.erss.2018.04.015.
- Axsen, J., S. Goldberg, and J. Bailey. 2016. “How Might Potential Future Plug-In Electric Vehicle Buyers Differ from Current “Pioneer” Owners?” Transportation Research Part D: Transport and Environment 47: 357–370. https://doi.org/10.1016/j.trd.2016.05.015.
- Batz, F. J., K. J. Peters, and W. Janssen. 1999. “The Influence of Technology Characteristics on the Rate and Speed of Adoption.” Agricultural Economics 21 (2): 121–130. https://doi.org/10.1111/j.1574-0862.1999.tb00588.x.
- Berliner, R. M., S. Hardman, and G. Tal. 2019. “Uncovering Early Adopter’s Perceptions and Purchase Intentions of Automated Vehicles: Insights from Early Adopters of Electric Vehicles in California.” Transportation Research Part F: Traffic Psychology and Behaviour 60: 712–722. https://doi.org/10.1016/j.trf.2018.11.010.
- Bjerkan, K. Y., T. E. Nørbech, and M. E. Nordtømme. 2016. “Incentives for Promoting Battery Electric Vehicle (BEV) Adoption in Norway.” Transportation Research Part D: Transport and Environment 43: 169–180. https://doi.org/10.1016/j.trd.2015.12.002.
- Breetz, H. L., and D. Salon. 2018. “Do Electric Vehicles Need Subsidies? Ownership Costs for Conventional, Hybrid, and Electric Vehicles in 14 U.S. Cities.” Energy Policy 120: 238–249. https://doi.org/10.1016/j.enpol.2018.05.038.
- Broadbent, G. H., G. Metternicht, and D. Drozdzewski. 2019. “An Analysis of Consumer Incentives in Support of Electric Vehicle Uptake: An Australian Case Study.” World Electric Vehicle Journal 10 (1): 11. https://doi.org/10.3390/wevj10010011.
- Burs, L., E. Roemer, S. Worm, and A. Masini. 2020. “Are They All Equal? Uncovering Adopter Groups of Battery Electric Vehicles.” Sustainability 12 (7): 2815. https://doi.org/10.3390/su12072815.
- Canepa, K., S. Hardman, and G. Tal. 2019. “An Early Look at Plug-In Electric Vehicle Adoption in Disadvantaged Communities in California.” Transport Policy 78: 19–30. https://doi.org/10.1016/j.tranpol.2019.03.009.
- Carley, S., R. M. Krause, B. W. Lane, and J. D. Graham. 2013. “Intent to Purchase a Plug-In Electric Vehicle: A Survey of Early Impressions in Large US Cites.” Transportation Research Part D: Transport and Environment 18: 39–45. https://doi.org/10.1016/j.trd.2012.09.007.
- Davis, F. D. 1989. “Perceived Usefulness, Perceived Ease of Use, and User Acceptance of Information Technology.” MIS Quarterly, 319–340. https://doi.org/10.2307/249008.
- Degirmenci, K., and M. H. Breitner. 2017. “Consumer Purchase Intentions for Electric Vehicles: Is Green More Important Than Price and Range?.” Transportation Research Part D: Transport and Environment 51: 250–260. https://doi.org/10.1016/j.trd.2017.01.001.
- de Rubens, G. Z. 2019. “Who Will Buy Electric Vehicles After Early Adopters? Using Machine Learning to Identify the Electric Vehicle Mainstream Market.” Energy 172: 243–254. https://doi.org/10.1016/j.energy.2019.01.114.
- Electric Vehicle Council. 2020. “State of Electric Vehicles, August 2020.” Retrieved from: https://electricvehiclecouncil.com.au/wp-content/uploads/2020/08/EVC-State-of-EVs-2020-report.pdf. Last accessed 26/02/2024.
- Electric Vehicle Council. 2021. “State of Electric Vehicles, August 2021.” Retrieved from: https://electricvehiclecouncil.com.au/wp-content/uploads/2021/08/EVC-State-of-EVs-2021-sm.pdf. Last accessed 26/02/2024.
- Frattini, F., M. Bianchi, A. De Massis, and U. Sikimic. 2014. “The Role of Early Adopters in the Diffusion of New Products: Differences Between Platform and Nonplatform Innovations.” Journal of Product Innovation Management 31 (3): 466–488. https://doi.org/10.1111/jpim.12108.
- Funke, SÁ, F. Sprei, T. Gnann, and P. Plötz. 2019. “How Much Charging Infrastructure Do Electric Vehicles Need? A Review of the Evidence and International Comparison.” Transportation Research Part D: Transport and Environment 77: 224–242. https://doi.org/10.1016/j.trd.2019.10.024.
- Gibson, G., S. Kollamthodi, K. Felix, W. Elisabeth, B. Charlotte, W. Ben, B. Eugenia, and K. Outi. 2015. Evaluation of Regulations 443/2009 and 510/2011 on CO2 Emissions from Light-Duty vehicles. European Commission.
- Globisch, J., P. Plötz, E. Dütschke, and M. Wietschel. 2019. “Consumer Preferences for Public Charging Infrastructure for Electric Vehicles.” Transport Policy 81: 54–63. https://doi.org/10.1016/j.tranpol.2019.05.017.
- Gong, S., A. Ardeshiri, and T. H. Rashidi. 2020. “Impact of Government Incentives on the Market Penetration of Electric Vehicles in Australia.” Transportation Research Part D: Transport and Environment 83: 102353. https://doi.org/10.1016/j.trd.2020.102353.
- Grote, M., J. Preston, T. Cherrett, and N. Tuck. 2019. “Locating Residential On-Street Electric Vehicle Charging Infrastructure: A Practical Methodology.” Transportation Research Part D: Transport and Environment 74: 15–27. https://doi.org/10.1016/j.trd.2019.07.017.
- Hardman, S., R. Berliner, and G. Tal. 2019. “Who Will be the Early Adopters of Automated Vehicles? Insights from a Survey of Electric Vehicle Owners in the United States.” Transportation Research Part D: Transport and Environment 71: 248–264. https://doi.org/10.1016/j.trd.2018.12.001.
- Hardman, S., E. Shiu, and R. Steinberger-Wilckens. 2016. “Comparing High-End and Low-End Early Adopters of Battery Electric Vehicles.” Transportation Research Part A: Policy and Practice 88: 40–57. https://doi.org/10.1016/j.tra.2016.03.010.
- Hardman, Scott, Eric Shiu, Robert Steinberger-Wilckens, and Thomas Turrentine. 2017. “Barriers to the Adoption of Fuel Cell Vehicles: A Qualitative Investigation Into Early Adopters Attitudes.” Transportation Research Part A: Policy and Practice 95: 166–182. https://doi.org/10.1016/j.tra.2016.11.012.
- Hardman, Scott, and Gil Tal. 2016. “Exploring the Decision to Adopt a High-End Battery Electric Vehicle: Role of Financial and Nonfinancial Motivations.” Transportation Research Record: Journal of the Transportation Research Board 2572 (1): 20–27. https://doi.org/10.3141/2572-03.
- Higueras-Castillo, E., S. Molinillo, J. A. Coca-Stefaniak, and F. Liebana-Cabanillas. 2020. “Potential Early Adopters of Hybrid and Electric Vehicles in Spain—Towards a Customer Profile.” Sustainability 12 (11): 4345. https://doi.org/10.3390/su12114345.
- Jang, S., and J. Y. Choi. 2021. “Which Consumer Attributes Will Act Crucial Roles for the Fast Market Adoption of Electric Vehicles?: Estimation on the Asymmetrical & Heterogeneous Consumer Preferences on the EVs.” Energy Policy 156: 112469. https://doi.org/10.1016/j.enpol.2021.112469.
- Jansson, J. 2011. “Consumer Eco-Innovation Adoption: Assessing Attitudinal Factors and Perceived Product Characteristics.” Business Strategy and the Environment 20 (3): 192–210. https://doi.org/10.1002/bse.690.
- Kumar, R. R., G. Pritha, and C. Abhishek. 2022. “Comparative Assessment and Selection of Electric Vehicle Diffusion Models: A Global Outlook.” Energy 238: 121932. https://doi.org/10.1016/j.energy.2021.121932.
- Kurani, K. S., N. Caperello, and J. T. Hageman. 2016. New Car Buyers’ Valuation of Zero-Emission Vehicles. California.
- Lahiri, R., and S. Ratnasiri. 2012. “Growth Patterns and Inequality in the Presence of Costly Technology Adoption.” Southern Economic Journal 79 (1): 203–223. https://doi.org/10.4284/0038-4038-79.1.203.
- Lee, J. H., D. Chakraborty, S. J. Hardman, and G. Tal. 2020. “Exploring Electric Vehicle Charging Patterns: Mixed Usage of Charging Infrastructure.” Transportation Research Part D: Transport and Environment 79: 102249. https://doi.org/10.1016/j.trd.2020.102249.
- Lee, J. H., S. J. Hardman, and G. Tal. 2019. “Who is Buying Electric Vehicles in California? Characterising Early Adopter Heterogeneity and Forecasting Market Diffusion.” Energy Research & Social Science 55: 218–226. https://doi.org/10.1016/j.erss.2019.05.011.
- Long, Z., J. Axsen, I. Miller, and C. Kormos. 2019. “What Does Tesla Mean to Car Buyers? Exploring the Role of Automotive Brand in Perceptions of Battery Electric Vehicles.” Transportation Research Part A: Policy and Practice 129: 185–204. https://doi.org/10.1016/j.tra.2019.08.006.
- Lundblad, J. P. 2003. “A Review and Critique of Rogers’ Diffusion of Innovation Theory as it Applies to Organizations.” Organization Development Journal 21: 50.
- McFadden, D. 1986. “The Choice Theory Approach to Market Research.” Marketing Science 5 (4): 275–297. https://doi.org/10.1287/mksc.5.4.275.
- Muneer, T., R. Milligan, I. Smith, A. Doyle, M. Pozuelo, and M. Knez. 2015. “Energetic, Environmental and Economic Performance of Electric Vehicles: Experimental Evaluation.” Transportation Research Part D: Transport and Environment 35: 40–61. https://doi.org/10.1016/j.trd.2014.11.015.
- Münzel, C., P. Plötz, F. Sprei, and T. Gnann. 2019. “How Large is the Effect of Financial Incentives on Electric Vehicle Sales? – A Global Review and European Analysis.” Energy Economics 84: 104493. https://doi.org/10.1016/j.eneco.2019.104493.
- National Transport Commission. 2020. “Carbon Dioxide Emissions Intensity for New Australian Light Vehicles 2019.” Retrieved from https://www.ntc.gov.au/sites/default/files/assets/files/Carbon-dioxide-emissions-intensity-for-new-Australian-light-vehicles-2019.pdf.
- Nicholson, T. 2020. Drivers Switching on to Electric Vehicles Survey Reveals. Royal Automobile Club of Victoria.
- Plötz, P., U. Schneider, J. Globisch, and E. Dütschke. 2014. “Who Will Buy Electric Vehicles? Identifying Early Adopters in Germany.” Transportation Research Part A: Policy and Practice 67: 96–109. https://doi.org/10.1016/j.tra.2014.06.006.
- Queensland Government. 2021. “Electric Vehicle Snapshot November 2021”, Retrieved from https://www.qld.gov.au/transport/projects/electricvehicles/zero-emission-strategy/electric-vehicle-snapshot-november-2021.
- Queensland Government. 2022. “Queensland’s Zero Emission Vehicle Strategy 2022–2032.” Department of Transport and Main Roads, March.
- Rogers, E. 1995. Diffusion of Innovations. 4th ed. Paperback. New York: Simon & Schuster.
- Santini, D. J., and A. D. Vyas. 2005. “Introduction of Hybrid and Diesel Vehicles.” Transportation Research Record: Journal of the Transportation Research Board 1941: 18–25. https://doi.org/10.1177/0361198105194100103.
- Transport and Public Works Committee. 2020. “Inquiry into Transport Technology.” Retrieved from https://www.parliament.qld.gov.au/documents/tableOffice/TabledPapers/2020/5620T1209.pdf.
- Vassileva, I., and J. Campillo. 2017. “Adoption Barriers for Electric Vehicles: Experiences from Early Adopters in Sweden.” Energy 120: 632–641. https://doi.org/10.1016/j.energy.2016.11.119.
- Venkatesh, V., and H. Bala. 2008. “Technology Acceptance Model 3 and a Research Agenda on Interventions.” Decision Sciences 39 (2): 273–315. https://doi.org/10.1111/j.1540-5915.2008.00192.x.
- Venkatesh, V., and F. D. Davis. 1996. “A Model of the Antecedents of Perceived Ease of use: Development and Test.” Decision Sciences 27 (3): 451–481. https://doi.org/10.1111/j.1540-5915.1996.tb01822.x.
- Wang, S., and M. Ge. 2019. Everything You Need to Know About the Fastest-Growing Source of Global Emissions: Transport. Washington, DC, USA: World Resources Institute.
- Wang, S., W. Jing, J. Li, and L. Liang. 2018. “Policy Implications for Promoting the Adoption of Electric Vehicles: Do Consumer’s Knowledge, Perceived Risk and Financial Incentive Policy Matter?” Transportation Research Part A: Policy and Practice 117: 58–69. https://doi.org/10.1016/j.tra.2018.08.014.
- Wolf, A., and S. Seebauer. 2014. “Technology Adoption of Electric Bicycles: A Survey among Early Adopters.” Transportation Research Part A: Policy and Practice 69: 196–211. https://doi.org/10.1016/j.tra.2014.08.007.