
ABSTRACT
While global greenhouse gas (GHG) emissions are still rising, a number of countries have emerged with a sustained record of emissions reductions. In this article, we identify these countries and examine their progress, exploring how fast, how deep, and in which sectors they have reduced emissions. We analyse changes in all major GHG emissions sources, with both production – and consumption-based accounting, but exclude very small countries with high volatility, along with land-use, land-use change and forestry CO2 emissions. We find that 24 countries have sustained reductions in annual CO2 and GHG emissions between 1970 and 2018, in total equalling 3.2 GtCO2eq since their respective emissions peaks. In all but three countries, overall GHG reductions are less than energy and industrial CO2 reductions alone. We group countries into three types of emissions pathway: six former Eastern Bloc countries, where emissions declined rapidly in the 1990s and have continued on a downward trajectory since; six Long-term decline countries, which have sustained reductions since the 1970s; and 12 Recent peak countries, whose emissions decline began in the 2000s. In all cases, emissions reductions were achieved primarily in the energy systems sector, specifically in electricity and heat generation, which still remains the largest source of emissions in most countries. By contrast, in the transport sector, emissions tend to be stable or increasing. Transport is the second largest source of current emissions in Recent peak and Long-term decline countries. While the total GHG reductions of these 24 countries are trivial compared to recent global emissions growth, some have achieved a decline of up to 50% in their annual emissions, showing what is possible even under very moderate climate action. Most countries achieved emissions reductions alongside sustained economic growth, and some approached the fast annual rates of change that will be needed across the world in the coming decades to limit warming to 2°C. This raises the hope that more substantive climate policy, as planned in a growing number of countries, may bring about deeper and more rapid emissions reductions than some may expect today.
Key policy insights
24 countries have sustained CO2 and GHG emissions reductions between 1970 and 2018
The annual emissions reductions of some countries are within the range of those needed to limit global warming to 2°C, but not consistently, nor across all underlying sectors
Most emissions reductions were achieved in the energy sector; transport emissions have remained stable or continue to grow
1. Introduction
Global greenhouse gas (GHG) emissions have continuously grown, almost uninterrupted, since the start of the industrial revolution (Friedlingstein et al., Citation2019; Minx et al. Citation2021). While countries in the Global North are responsible for building up the majority of GHGs in the atmosphere, some have managed to reach a peak in emissions and sustain long-term reductions (Le Quéré et al., Citation2019). These countries and their achievements in reducing GHG emissions are the focus of our article.
The goals of the Paris Agreement imply steep reductions towards net-zero global emissions within the next few decades (IPCC Citation2018). Assessing progress in countries with sustained emissions reductions is important for rapid learning and for spurring other countries to increase their ambition and action, fulfilling a key logic of the Paris Agreement. At the same time, it remains important not to overstate climate mitigation progress (Lamb et al., Citation2020), not least because current Nationally Determined Contributions (NDCs) indicate global emissions growth until 2030, with more than a decade already wasted on limited climate action in the meantime (Höhne et al., Citation2020). These issues will be the focus of the five-yearly global stocktake mechanism of the Paris Agreement rulebook, where countries evaluate their collective progress towards meeting the Agreement's goals.
In this article, we set out to comprehensively evaluate the progress of countries that have managed to reduce their GHG emissions – whether due to deliberate climate policy, or other factors. Our aims are to identify how many countries are sustaining long-term emissions reductions, by how fast, how much, and in which sectors. We then evaluate these reductions against rates of change projected in climate change mitigation scenarios that limit global warming to 1.5°C and 2°C. In doing so, we attempt to provide a multi-faceted perspective on progress in national GHG emissions reductions, identifying bottlenecks and future needs to scale up the low carbon transition.
Several articles and reports have dealt with the topic of decarbonizing countries (Burck et al., Citation2021; Eskander & Fankhauser, Citation2020; Le Quéré et al., Citation2019; Levin & Rich, Citation2017; Xia et al., Citation2020). We build on and update this prior literature in a number of ways. First, we identify decarbonizing countries based on sustained annual reductions in emissions between 1970 and 2018, starting from a year of peak emissions. We examine trends in all GHG emissions, as well as carbon dioxide (CO2) emissions from fossil fuel combustion. In doing so we capture important underlying shifts in the composition of national emissions and sources (albeit excluding land-use, land-use change and forestry (LULUCF) CO2 emissions due to high uncertainties). Second, we set out to explain different types of emissions reduction pathways by clustering countries with similar trajectories. Third, we analyse clusters and their constituent countries in terms of shifts in underlying emissions sources, allowing us to question the extent to which current reduction rates can be sustained into the future. Finally, we compare these historical rates of emissions reductions to rates projected in integrated assessment scenarios, thus benchmarking the achieved progress against necessary rates for meeting the 1.5°C and 2°C climate targets. Our analysis is mainly descriptive, rather than explanatory, but aims to give a comprehensive picture of the trends and underlying features of decarbonizing countries.
2. Materials and methods
2.1. Data
Our estimates of national CO2 and GHG emissions are from the Emissions Database for Global Atmospheric Research (EDGAR) v5 database (Crippa et al., Citation2019) – the methodology being in line with the earlier version 4.3.2 (Janssens-Maenhout et al., Citation2019). EDGAR covers the time span 1970–2018 for CO2 and 1970–2015 for non-CO2 gases. We use a fast-track extension for non-CO2 GHG emissions for 2016–2018 as described in Olivier et al. (Citation2005) and Minx et al. (Citation2021).
We group EDGAR emissions sources into 5 sectors: energy systems, transport, buildings, industry, and agriculture. These sectors cover aspects of energy supply, including fossil fuel extraction, processing, transport and generation (energy systems sector); energy demand in three final sectors (transport, buildings, and industry sectors); non-energy related process emissions (e.g. cement and F-gases within industry); and agriculture emissions (agriculture sector). These are further split into 27 subsectors, as described in the supplementary data file to this article, to enable the analysis of more fine-grained emissions trends.
Our data covering the agriculture sector includes the main sources of non-CO2 agricultural GHG emissions, such as those from livestock, soil management and fertilizer application. However, EDGAR does not include LULUCF CO2 emissions. We analyse the potential impact of including LULUCF CO2 emissions, using data from FAO (Citation2021), but choose not to include it in our core analysis due to high uncertainties – as discussed in the supplementary materials (SM).
To calculate total GHG emissions, we weight each gas using global warming potentials with a time horizon of 100 years (GWP100), using factors from the Intergovernmental Panel on Climate Change (IPCC) 5th Assessment Report (Myhre et al., Citation2013). While GWP100 has limitations, particularly in terms of differentiating the short – and long-term impacts of different gases, we follow much of the scientific and policy literature in adopting it here (Lynch et al., Citation2020). All GWP values are described in the supplementary data file to this article.
To complement our main analysis using the EDGAR data, we draw on two additional sources: consumption-based emissions data from the Global Carbon Project (Friedlingstein et al., Citation2020), as updated from Peters et al. (Citation2011), and population data from the World Bank (Citation2020). The data and results from this paper can be found at https://doi.org/10.5281/zenodo.5497833.
2.2. Identifying countries with sustained emissions reductions
Our main requirement for identifying countries with sustained emissions reductions is that they have reduced annual GHG emissions on average for at least 11 years (2008-2018). This time frame makes sure we don't give weight to short-term year to year fluctuations, and also avoids the main impacts of the global financial crisis, which led to a drop in global CO2 emissions in 2009 followed by a rapid rebound (Peters et al., Citation2012).
To make allowances for even longer sustained emissions reductions, we identify the peak year of CO2 emissions for every country between 1970 and 2008. We then calculate the average annual reduction rate in CO2 and total GHG emissions between that peak year and 2018, discarding any countries with positive growth in either metric. We therefore only include countries with declining CO2 and GHG emissions, based on the trend since the CO2 peak year. Several further exclusions were made on the basis of data quality and consistency in trends, as described in the SM.
To compute all average annual reduction rates, we use a method proposed by the Global Carbon Project (Friedlingstein et al., Citation2019): in a given time period, we fit a linear model to the natural logarithm of the GHG emissions data, expressing the time coefficient as the reduction rate in percent per year. This method has the advantage of not oversampling individual years. Compared to other smoothing procedures, such as averaging yearly growth rates, or a linear trend on a moving average-smoothed series, we see little difference in the results.
2.3. Grouping similar country trajectories
We complement our analysis of individual countries by clustering them into three groups based on socio-economic history and peak years. One cluster we identify as former members of the Eastern Bloc. These countries all sustained a sharp and distinctive decline in emissions following the Soviet Union collapse around 1990. We separate the two remaining groups by peak years: either early in the 1970s and 1980s, followed by a long trend of sustained emissions reductions; or in the late 1990s or early 2000s.
We analyse each cluster descriptively, summarizing their total emissions, population, absolute and relative reductions in annual emissions since peak years, and other information. In the case of absolute and relative reductions in annual emissions, we calculate these against the peak years of each constituent country in each cluster - hence using varying underlying time periods. As in our identification of decarbonizing countries (described in the prior section), for each country we use the same peak year for both GHG and CO2 emissions (the CO2 peak year), in order to ensure comparability between each emissions metric. All data and estimations for countries and clusters are available in the SM.
2.4. Estimating decarbonization rates over time
Our initial identification of countries is based on the average annual reduction rate between a peak year and 2018. However, each country has varying reduction rates at different points in time. To allow for this and to explore whether decarbonization rates are broadly increasing (or decreasing) in speed, we calculate five year rolling average reduction rates for each country. For every year starting in the peak year, we estimate the average annual reduction rate since the preceding 4 years (e.g. the rolling average reduction rate for 1975 spans the years 1971-1975). We use the same method for estimating reduction rates as described in section 2.2.
To contextualize these reduction rates, we contrast them with rates extracted from integrated assessment scenarios. We use the IIASA scenario database of the IPCC Special Report on 1.5°C (IPCC Citation2018; Huppmann et al., Citation2019; Rogelj et al., Citation2018). This database includes both 1.5°C and 2°C scenarios; we select all those that have a probability of meeting 2°C of at least 50%. To evaluate reduction rates closest to the time period of our own analysis (1970-2018), we extract the global emissions levels in these scenarios at the 2020 and 2040 time steps, then calculate average annual reduction rates as in section 2.2. This allows us to contrast recent national emissions reduction rates with the global rates necessary for meeting climate targets at varying levels of stringency. Importantly, integrated assessment scenarios embody different technological features and socio-economic assumptions, such as rates of carbon dioxide removal (CDR), which influence the comparison we make. These features are described in the underlying literature (Rogelj et al., Citation2018).
3. Results
We structure our results into four sections, corresponding to our different methods and areas of analysis: (1) the number of countries reducing emissions, their geographic coverage and rates of change; (2) the varying emissions trajectories of decarbonizing countries, grouped into three clusters; (3) the underlying sector changes that led to emissions reductions across countries and clusters; and (4) the comparison of achieved reduction rates over time with future rates expressed in 2°C and 1.5°C scenarios from the literature.
3.1. 24 countries sustained emissions reductions between 1970 and 2018
We find that 24 countries have managed to reduce both CO2 and GHG emissions between 1970 and 2018 (). Almost all of these countries are European (22 in total), ranging across all of the continent's diverse areas: from Scandinavia (e.g. Sweden, Finland, Denmark), to the Mediterranean (Spain, Italy, Greece), Eastern Europe (Ukraine, Hungary, Czech Republic) and Western Europe (France, Germany, the UK). Two more countries outside of Europe have further contributed to lowering global emissions: the United States (US) and Jamaica. So far, no country in Asia or Africa meets the criteria for sustained emissions reductions. overlays the trend in total territorial CO2 and GHG emissions, as well as consumption-based CO2 emissions, showing that all countries achieved consistent reductions by all three metrics, albeit with varying peak years depending on the metric.
Figure 1. Countries with declining CO2 and GHG emissions since peak year. Trends for territorial CO2 (green), territorial GHG (blue) and consumption-based CO2 emissions (orange) are shown. Note that the y-axis limit differs in each plot but always starts at 0, putting an emphasis on the completeness of each decarbonization trajectory. The average annual reduction rate and the reduction in annual CO2 emissions since peak years is shown in each plot subtitle. Clusters are described in the forthcoming section.
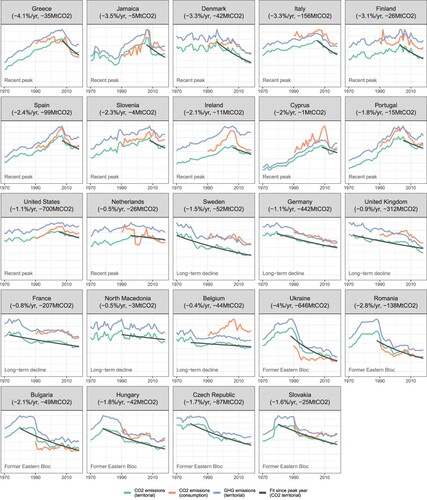
Average annual CO2 reduction rates range from rather modest trends of around −0.5%/yr (e.g. Belgium, North Macedonia, Netherlands) to rapid rates of more than −3%/yr (e.g. Greece, Italy, Finland, Denmark, Ukraine). However, when we contrast these CO2 reduction rates with GHG reduction rates tracked from the same peak year, then the performance of most countries declines significantly (see SM Figure 4, which tabulates reduction rates and amounts for each country). For example, the US has sustained an average −1.1%/yr in CO2 emissions reductions since 2005, but only −0.5%/yr over the same period in GHG emissions reductions. In some countries the difference is stark, such as Finland (−3.1% in CO2 to −1.8% in GHG), Ireland (−2.1% CO2, −1% GHG) and Denmark (−3.3% CO2, −2.5% GHG). In all but three countries, average annual reductions in GHG emissions were lower than those of CO2 emissions over the same time period. We address some of these cases and reasons for diverging CO2 and GHG reductions in subsequent sections.
Apart from JamaicaFootnote1, only countries in the Global North have managed to reduce emissions. Of course, most of these countries have a higher historic responsibility for warming trends, as well as a greater capacity to take mitigation action, as reflected in the Annex I categorization of the United Nations Framework Convention on Climate Change (UNFCCC). Nonetheless, several Annex I countries are prominently missing from the list of countries that reduced emissions. For instance, calculating average annual CO2 emissions change from 2008 to 2018, the same years as our minimum inclusion criteria, Turkey (+5.2%), Canada (+1.2%), the Russian Federation (+0.9%), Japan (+0.5%), Australia (+0.3%) and New Zealand (+0.2%) all grew in emissions.
How would different accounting methods change these results? If countries were only assessed on the basis of total GHG emissions, including LULUCF CO2 from a dataset that focuses on forestry (FAO, Citation2021), a further 17 would be added, including Australia, Brazil, Canada and the Russian Federation, while a single country would be removed – Slovenia (SM Table 1). Using UNFCCC accounting, the results are different yet again, e.g. with Australia's emissions falling by 14% from 2005 to 2020. Thus, many countries with growing fossil CO2 emissions but declining LULUCF CO2 emissions could also be considered, but we do not do so here as the complexities of LULUCF emissions data are beyond the scope of this paper.
In all 24 countries, consumption-based CO2 emissions have been declining since at least 2008. The flat or upward trend of consumption-based CO2 emissions up to this year in the UK, Denmark, France, Belgium and others confirms that offshoring was an issue but has since declined in importance as worldwide emissions transfers have peaked due to a decline in the carbon intensity of traded goods (Wood et al., Citation2020).
The total reductions in annual CO2 emissions of these 24 countries, subtracting 2018 emissions from each respective peak year, sum to approximately 3.2 GtCO2. Equivalent GHG emissions reductions were only marginally higher over the same period (by 0.1 GtCO2eq). Considering these reductions occurred over multiple decades, and that they represent approximately 9% of global CO2 emissions in 2018 (37.5 GtCO2), the total impact of these 24 countries appears to be rather limited to date. They have been far outweighed by the growth of emissions in other countries and regions of the world. Nonetheless, total reductions in annual emissions from peak years have been very large indeed in some countries. Ukraine has reduced CO2 emissions by 77% since 1988; Denmark by 56% since 1996; and the UK by 46% since 1973 (SM Figure 4). At the same time, the largest country in our sample had among the lowest reduction rates – the US, with a 12% reduction in CO2 emissions since 2005, and just 5% for GHG emissions.
3.2. Three types of emissions reduction pathways
Country emissions trends follow one of three broad patterns: (1) several decades of growth, followed by a recent peak and decline in emissions; (2) a long and continuous decline in emissions since the 1970s; or (3) a rapid and deep drop in emissions in the 1990s, followed by relative stability. We call these groups ‘Recent peak’, ‘Long-term decline’ and ‘Former Eastern Bloc’, respectively.
Recent peak countries had their highest levels of emissions on average in 2004. Prior to this year, most of them experienced several decades of continuous and sometimes rapid emissions growth. Breaking with this trend, these countries have managed relatively fast emissions reductions in the past decade. They include 12 countries, with the US, Italy and Spain standing out as the largest current emitters. Although the relative reductions in annual emissions of these countries have tended to be small, due to the short period since reductions started, the absolute impact was large, at 1.1 Gt CO2 emissions, and 0.8 GtCO2eq for GHG emissions. This is because they – particularly the US – account for a substantial proportion of current global CO2 and GHG emissions (16.8% and 15.5%, respectively), as shown in . But despite their overall reducing trend, some of these countries, such as Cyprus and Portugal, have seen an uptick of emissions in the past five years. Continued observation will therefore be needed to confirm a longer-term decarbonization trend.
Figure 2. Three groups of decarbonizing countries. Groups are clustered manually, based on socio-economic history (Former Eastern Bloc) and peak years. Panel b depicts country CO2 emissions trends normalized to 1 in 1970, with an average trend by group in bold. Panel c depicts the relative importance of each group in terms of their global CO2 emissions, GHG emissions and population in 2018. Panel d depicts the total relative reduction in annual emissions per group since each underlying peak year.
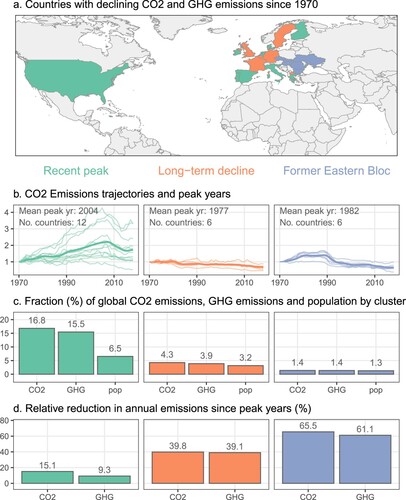
Long-term decline countries have undergone a continuous period of emissions reductions since the 1970s. They include 6 European nations: Sweden, Germany, the United Kingdom, France, North Macedonia and Belgium. Despite relatively slow average decarbonization rates compared to other groups, they have accumulated large relative reductions in annual emissions over a period of several decades: 39.8% in the case of CO2 emissions, and 39.1% for GHG emissions. Together, these countries have contributed a 1.1 Gt CO2 drop in annual emissions from their respective peak years to 2018. This is a similar level of magnitude as Recent peak countries. Yet unlike Recent peak countries, the Long-term decline group has also managed to reduce total GHG emissions by an equivalent amount: 1.3 GtCO2eq.
The emissions trends of countries in the Former Eastern Bloc group were shaped by a historic event of global significance: the dissolution of the former Soviet Union in 1990-1991. This event affected a swathe of countries across Eastern Europe and central Asia. As the Soviet Union broke up, the state-run economies of its core states (e.g. Ukraine in our analysis), as well as satellites in Eastern Europe (e.g. Romania, Hungary, Czech Republic, Bulgaria, and Slovakia) all suffered severe downturns, leading to historic drops in industrial output, energy demand, and emissions.
The longer-term trend in this group, however, has not been a rebound to high emissions levels, but rather a stabilizing of emissions and a continuous, albeit more gradual, decline in all cases. This indicates a structural break following the Soviet Union dissolution and the possibility of these countries continuing along a decarbonization trajectory driven by continuous reductions in emissions and energy intensity (SM Figure 3). This contrasts with many other former Eastern Bloc states, such as the Russian Federation, Poland, Belarus, and so on, which also experienced a sudden drop, but have since rebounded in emissions.
In terms of total emissions reductions, the collapse was dramatic, with Former Eastern Bloc countries equalling the other groups in reducing annual CO2 emissions by 1 GtCO2 since peak years in the late 1980s, and 1.1 GtCO2eq for total GHG emissions. The average relative reductions in annual CO2 and GHG emissions are 65.5% and 61.1%, respectively, but reached as high as 77% for CO2 emissions in Ukraine. Indeed, this country was responsible for the majority of this group's overall reduction in annual CO2 and GHG emissions, at 646 and 732 MtCO2eq, respectively.
3.3. GHG emissions reductions have been primarily realized in the energy and industry sectors
Shifts in the contributions of underlying sectors reveal a striking pattern across most countries: energy systems and industry are responsible for the large majority of GHG emissions reductions (SM Figure 5). Emissions in the energy systems sector are primarily from electricity and heat generation in power plants (e.g. coal and gas power stations), as well as the extraction, processing and transport of fuels for these plants. Across all country cases where we identify sustained emissions reductions, GHG emissions reductions were realized specifically in this sector. This indicates that such countries managed to reduce overall energy use, underwent a transition to cleaner fuels (such as coal to gas), expanded renewable energy or zero-carbon sources (such as solar PV, nuclear or wind power), or achieved a combination of these.
In all countries, GHG emissions reductions have also been realized in the industry sector –apart from the US. Industry comprises a variety of different manufacturing and resource extraction activities, including metals, chemicals, and cement production, as well as a broad range of generic manufacturing processes (‘Other industry’ in the underlying IEA data and our subsector classification). Again, GHG reductions in this sector may indicate a number of possible underlying shifts, such as improved manufacturing efficiencies, fuel switching between different feedstocks (e.g. coking coal to electric arc furnaces), as well as absolute reductions in industrial output at a national level.
The transportation, buildings, and agriculture sectors comprise direct emissions, such as vehicles on roads, gas or coal boilers in buildings, and methane produced by livestock (enteric fermentation). Countries have had varying levels of success in reducing these types of emissions. In the Recent peak group, transportation GHG emissions have declined alongside other sectors. However, the opposite is true in Long-term decline countries and the Former Eastern Bloc, with increases in transport emissions offsetting progress in other sectors. Changes in buildings emissions have tended to be quite small in most cases, excepting Sweden, the Netherlands, France, Ireland, Belgium and Slovakia, which reduced these sources on par with other sectors. Overall, agriculture emissions reductions have been more important for Former Eastern Bloc countries, compared to others.
Breaking down the emissions change into even more detailed subsectors shows the importance of particular sources in either driving or hindering decarbonization efforts (). In the Recent peak cluster of countries, the vast majority of reductions in annual GHG emissions were from the electricity and heat sector (over −800 MtCO2eq alone). These emissions were partially offset by growing fugitive emissions sources (+151 MtCO2eq) and ‘other industry’ (+192 MtCO2eq). Since the US is by far the largest emitter in this group, we can attribute most of these changes to this specific country. The absolute changes in other emissions sources were quite trivial, even though relative changes in some cases were not (e.g. fugitive emissions from coal mining: −43.1%). Electricity and heat remains the largest sector in 2018 at 2198 MtCO2eq, followed closely by road transport at 1862 MtCO2eq. Overall, most reductions were from CO2 emissions, which declined from 83% of total emissions in this cluster in 2000, to 78% in 2018 (SM Figure 6). N2O emissions have remained steady at 4% of total emissions since 2000, while CH4 grew from 10% to 12%, and F-gas emissions from 2% to 6%.
Figure 3. GHG emissions by subsector and country cluster. Solid bars indicate total emissions in 2018, transparent bars indicate total emissions at peak years for each cluster. A solid bar followed by a transparent bar indicates absolute reductions in emissions (with the remaining emissions in solid). A solid bar with no transparent area indicates that emissions were stable or have grown to this level in 2018. Selected large subsectors are shown. Numbers in % following each bar describe the relative change in annual emissions between peak years and 2018.
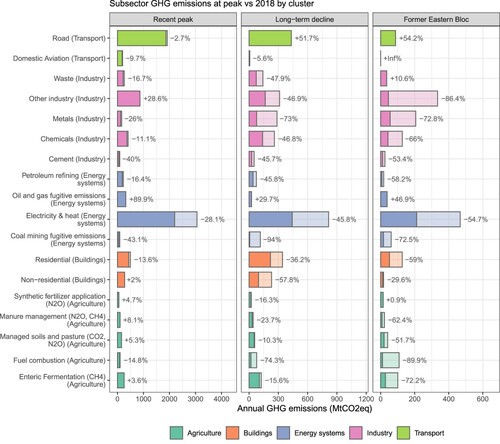
The Long-term decline group has undergone a more balanced decarbonization process across multiple subsectors. Again, this is mainly driven by a total of 373 MtCO2eq reductions in annual electricity and heat GHG emissions, but with substantial additional contributions from metals (−208 MtCO2eq), other industry (−146 MtCO2eq), non-residential buildings (−133 MtCO2eq), residential buildings (−124 MtCO2eq), chemicals (−121 MtCO2eq), and fugitive coal mining emissions (−109 MtCO2eq). The largest source of emissions growth is from the road transport subsector (+147 MtCO2eq), which remains almost equivalent to the electricity and heat sector in terms of total emissions in 2018 (433 MtCO2eq vs 441 MtCO2eq). Compared to the Recent peak group, there has been only a small change in the distribution of CO2 and non-CO2 GHG emissions, with CO2 emissions remaining approximately 79-80% of the total since 1970 – although F-gases have also slightly grown in recent years (SM Figure 6).
A largely similar picture emerges for the Former Eastern Bloc group of countries, with a deep drop in annual electricity and heat GHG emissions (−255 MtCO2eq), alongside other industry (−289 MtCO2eq), metals (−150 MtCO2eq), chemicals (−84 MtCO2eq), and residential buildings (−75 MtCO2eq). However, a notable difference in these countries is the additional role of agricultural emissions, with large annual reductions in fuel combustion in the farming sector (−98 MtCO2eq) and enteric fermentation (e.g. livestock CH4 emissions; −72 MtCO2eq). A small increase in oil and gas fugitive emissions (+12 MtCO2eq), road transport (+30 MtCO2eq) and waste (+3 MtCO2eq) has offset these changes to some extent. Electricity and heat still remains by far the largest emitting sector at 211 MtCO2eq in 2018. Since the 1990 decline in emissions, the fraction of CO2 emissions in total GHGs dropped from 81% to 72% (SM Figure 6). Thus, most mitigation took place for CO2 sources only, leaving a substantial fraction of remaining CH4, N2O and F-gas emissions.
Looking to broader trends underlying these shifts in emissions, it is important to note that each cluster on average grew in GDP since 1990, including the Former Eastern Bloc, at rates between 1.2% and 1.5% per year (SM Figure 3). All clusters and their constituent countries steadily reduced the carbon intensity of their energy supplies, as well as the energy intensity of GDP (the latter particularly so in the Former Eastern Bloc). Thus, while the effects of economic decline in recent years following the global financial crisis cannot be excluded, structural changes in energy use and other activities (whether driven by policy or not) are the main long-run drivers of emissions reductions in these cases. Kaya plots showing these trends for each individual country are also available in the SM.
3.4. Country reduction rates in some years are compatible with those required to meet the 2°C goal of the Paris Agreement
In previous sections, we report emissions reductions since country peak years. However, this ignores the possibility that countries have at times experienced faster or slower reduction rates. Here we examine the evolution of reduction rates over time, and consider whether or not they are compatible with those needed to meet the goals of the Paris Agreement.
a depicts how CO2 emissions reduction rates have varied since the peak years of each country, based on 5 year rolling averages. How do these compare to annual reduction rates necessary for meeting stringent warming targets? In b we depict the global CO2 reduction rates estimated in scenarios that limit warming to 1.5°C and 2°C, averaged between the years 2020 and 2040. Overall, we observe that while most countries have outlier values that stretch into the range of these reduction rates, few appear to be consistently achieving the necessary rates of decarbonization. The lower end of the interquartile range of 17 countries reaches the median value (−2.5%/yr) for scenarios with a 50% likelihood of avoiding 2°C warming (all countries apart from the US, Netherlands, Germany, France, Belgium, Czech Republic and Slovakia). But the interquartile range of just eight countries reaches the median value (−4.1%/yr) for scenarios with a 66% likelihood of avoiding 2°C warming (Greece, Italy, Spain, Cyprus, Jamaica, Denmark, Ukraine, and Romania). Apart from Jamaica and Ukraine, only extreme values beyond the interquartile range of countries are placed at, or are exceeding, the median value (−6.9%/yr) for scenarios that avoid more than 1.5°C of warming.
Figure 4. Rolling average country CO2 reduction rates in the context of average future global scenario reduction rates compatible with different climate targets. Panel a shows the rolling average rates of change for each country since their respective peak years, where rates of change in a given year are averaged using data from the prior 4 years. Panel b shows the range of global average CO2 reduction rates between 2020 and 2040 across different scenarios from the IPCC Special Report on 1.5°C (Rogelj et al., Citation2018), which meet three different levels of warming stringency: 2°C at 50% probability, 2°C at 66% probability, and 1.5°C at 50% probability. Dashed lines in panel b projected into panel a show the median values for these scenario categories (−2.5%, −4.1% and −6.9%, respectively). Panel c shows years where CO2 reduction rates exceed 4% per year in dark blue (the approximate median value for scenarios that achieve 2°C at 66% probability), with lighter shading towards yellow for slower growth rates. Only reductions from CO2 emissions are shown, in order to ensure compatibility with the scenario data.
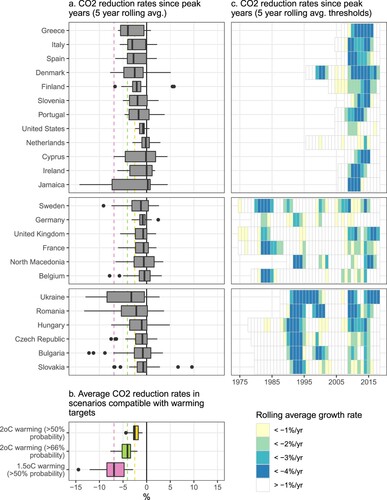
An alternative way of depicting country progress is shown in c, where individual years that achieved high rolling average growth rates (−4%/yr, i.e. approximately equivalent to those required in 2°C, 66% likelihood scenarios) are highlighted in dark blue, with progressively lighter shading towards yellow in years with slower growth rates. This demonstrates that while a few countries do achieve consistent and rapid year on year reductions of −4%/yr (such as Greece, Denmark, and Ukraine), most other countries only reach such rates in a few consecutive years. Three countries – the US, Germany and the Netherlands – were not able to achieve rapid rolling average reduction rates of −4% in any year. Thus while country growth rates do approach Paris-compatible rates in some individual years, it is more uncommon to reach these rates consistently.
Two cautionary notes on this analysis are required. First, scenarios show a relatively wide range of emissions reduction rates that are driven by important underlying assumptions. 2°C 66% likelihood scenarios range from −1.9% to −7.7% per year, while 1.5°C scenarios range from −2.9% to −14.4% per year. Lower rates of change are likely to occur in scenarios that have a higher dependence on the net removal of carbon dioxide from the atmosphere later in the twenty-first century, and vice-versa (Strefler et al., Citation2018). Hence, even though some countries may approach the lower end of scenario rates of change, for these to be consistent with Paris Agreement warming targets, one would still need to assume the availability of certain technologies, limitations on energy demand growth, and global cooperation. Second, here we analyse only CO2 emissions reductions, in order to ensure compatibility with the scenario data. Earlier results showed that reduction rates have tended to be lower for total GHG emissions (SM Figure 4). Hence the combined effect of accounting for total GHG emissions, as well as ruling out certain scenario features that may be considered undesirable (e.g. from political, social or technological perspectives), could shift Paris-compatible reduction rates even further beyond the range of the rates achieved by countries.
4. Discussion
In our analysis, we identify 24 countries with sustained CO2 and GHG emissions reductions between 1970 and 2018. Together, they reduced annual GHG emissions by a total of 3.2 GtCO2eq since their respective peak years. We group these countries into three types of emissions reduction pathways, disentangling their progress by focusing on changes in underlying sectors and subsectors. Finally, we contrast historical trends in CO2 emissions reductions with future reduction rates envisaged by Paris-consistent mitigation scenarios, finding that some countries enter the range of annual reduction rates required to limit warming to 2°C (e.g. >4%/yr), but few sustain these rates longer than 3–4 years, and none achieve the very fast reduction rates consistent with 1.5°C scenarios.
As a caveat, our analysis considers reductions of annual emissions only in countries that peaked before 2009. This may exclude lower emissions growth driven by climate policies in countries and sectors that have not yet peaked in emissions. Eskander and Fankhauser (Citation2020) perform such a calculation, and find much higher abatement levels against a counterfactual case of emissions growth – up to 5.9 GtCO2 per year in 2016 compared to our drop of 3.2 GtCO2eq in annual emissions since peak years.
Further, since we do not attribute national emissions reductions to policies, our analysis includes reductions that were driven by wider structural changes and other non-climate policy factors. Considering the timing of emissions reductions by group, it is important to note that the majority of climate policy legislation has built up from the early 2000s, with most activity occurring between 2007 and 2012 (Climate Action Tracker, Citation2020; Dubash et al., Citation2013; Grantham Institute, Citation2017; Iacobuta et al., Citation2018). This coincides with the passage of the Kyoto Protocol – one of several international factors that have stimulated climate policy development – which was adopted in 1997, entered into force in 2005 and had a first phase of binding constraints between 2008–12 (Fankhauser et al., Citation2016). Indeed, 21 of the 24 countries we identify had binding targets under the Kyoto Protocol. Kyoto targets have been linked to emissions reductions of up to 7% against a counterfactual case (Maamoun, Citation2019), and potentially larger reductions if the worldwide impact of the Clean Development Mechanism is included (Kuriyama & Abe, Citation2018; Maamoun, Citation2019). It is hence likely that policy-linked emissions reductions mainly occurred in the past 10–15 years, while longer-term reductions before the 2000s were associated with wider structural changes.
Turning to our results, several cases illustrate the different types of climate policy progress made among the countries we study.
The US, a Recent peak country, is a key example where recent national progress in emissions reductions should be cautiously interpreted. Multiple studies highlight a rapid shift from coal to gas underway in the US, which is driven by a shale gas boom, federal tax incentives, and the declining competitiveness of coal (Feng, Citation2019; Mohlin et al., Citation2019; Peters et al., Citation2017; Peters et al., Citation2020). While the expansion of renewable energy is also starting to pick up pace (Mohlin et al., Citation2019), the fact that most progress results from fuel switching from coal to gas raises important questions about the viability of realizing continued and increasingly ambitious emissions reductions. Gas, the fastest growing fossil fuel worldwide (Jackson et al., Citation2019), is not a zero-carbon fuel, and new infrastructure locked in now will continue emitting into the future. Gas infrastructure is also prone to leakage across the supply chain, leading to additional CH4 emissions (Alvarez et al., Citation2018; Hmiel et al., Citation2020; Weller et al., Citation2020). Indeed, reductions of annual CO2 emissions compared to total GHG emissions diverge starkly in the US, halving from 700 MtCO2 to 351 MtCO2eq, while average annual rates decline from 1.13%/yr to 0.5%/yr.
In Long-term decline countries, all of which are in Europe, policies to expand renewables and improve energy efficiency have been more successful in driving down emissions. An extensive coal to gas switch also occurred over the past decades on the continent, but, around 2007, this effect was supplanted by the steady expansion of renewable generation capacity (Le Quéré et al., Citation2019; Peters et al., Citation2017; Rodrigues et al., Citation2020), which increased as a proportion of electricity generation from 43% in 2010–53% in 2018 (IEA, Citation2020). These trends are a result of both national and EU-level policies – such as a comprehensive set of supportive and restrictive regulatory measures in Denmark (Sovacool, Citation2013), or the carbon floor price in the UK, which near permanently switched the merit order of generation so that renewables and gas always outcompete coal (Agora Energiewende & Sandbag, Citation2017; Wilson & Staffell, Citation2018). Of course, another characteristic of low-emissions energy systems over the long run can be nuclear generation capacity (Burke, Citation2012; Saidi & Omri, Citation2020), which is extensive in many OECD countries, but particularly so in France, Belgium and Sweden.
Across the Former Eastern Bloc, the main driver of emissions reductions was evaporating industrial demand in the 1990s as economies and political systems broke-up and restructured in the wake of the Soviet Union dissolution. Cascading effects appeared to have played out across most sectors, with rapid emissions reductions particularly in the industry and coal mining sectors, and even the agriculture sector, with rapid dietary changes and reduced meat consumption occurring alongside the abandonment of farmland (Schierhorn et al., Citation2019). A key question is whether Former Eastern Bloc countries could now rebound to emissions levels previously sustained before 1990. Here the literature tends to emphasize the occurrence of deep structural changes during the early 1990s: many inefficient and loss-making enterprises were privatized or shut-down; there was an increasing pressure for environmental improvements; and previously subsidized energy prices saw sharp rises in many countries (Brizga et al., Citation2013; Rečková et al., Citation2017; Ürge-Vorsatz et al., Citation2006). As a result, energy efficiencies have dramatically improved, and in some countries carbon intensities have also declined (Brizga et al., Citation2013). All countries within this group are continuing to reduce emissions, albeit at a much slower pace, in the most recent decade.
In all countries, a notable lack of progress has been made in reducing transport emissions, which is now the second largest source of emissions in Recent peak and Long-term reduction countries (and if energy systems decarbonization continues, it will soon be the largest sector in the latter group). Indeed, transport is widely noted as a bottleneck to climate mitigation, due to both technological reasons (i.e. realizing affordable low-carbon energy vectors to substitute liquid fossil fuels), and the persistence and direction of underlying political economic drivers (such as cultures of car consumption and the influence of the automotive industry on transport planning) (Creutzig et al., Citation2015; Luderer et al., Citation2018; Mattioli et al., Citation2018). The industry sector will also face technological challenges in mitigating process emissions and high-temperature heat applications, with policies needed now in order to initiate transitions that may take several decades to overcome technological, political and social inertia (Davis et al., Citation2018; Luderer et al., Citation2018). It is thus not unlikely that countries making progress in energy system emissions alone could soon reach a frontier of mitigation efforts, which will require much more aggressive and comprehensive sectoral policies to break through, including demand-side measures (Creutzig et al., Citation2018).
5. Conclusions
While global GHG emissions are rising, a number of countries have emerged with a sustained record of emissions reductions, even during extended periods of economic growth. These front-runners have shown that reduction rates broadly in the range of those needed to limit warming to well below 2°C are possible. They further highlight that a deep and rapid decarbonization of the energy sector is feasible, driven by switching away from the most carbon intensive fuels, growing renewable and zero-carbon capacity, lowering demand, and improving energy efficiency.
However, sustained emissions reductions by these countries have been dwarfed so far by emissions increases in the rest of the world. Indeed, some declines in national territorial emissions reductions may be related to off-shoring and the recent industrialization of the Global South – even though all of these countries have also seen simultaneous reductions in consumption-based emissions. Further, we see that success in reducing non-energy sector emissions has been limited so far. In particular, the transport sector (and to a lesser extent industry and agriculture) now poses a potential barrier for mitigation efforts in many countries. And while some national emissions reduction rates have been fast, they have occurred intermittently, and not continuously – as is required for global mitigation pathways to meet the goals of the Paris Agreement.
Yet, to end with a positive note, it is not insignificant that this group of countries has managed to make progress in reducing emissions. In some, reductions of up to 50% or more in annual emissions have been achieved, under circumstances that have arguably been only moderately favourable for climate action. As technologies such as solar PV, wind power and electric batteries exceed all expectations of scale-up and cost reductions, and as citizen support for national and international climate policy grows, the challenge may become easier. More globally impactful action could potentially be built upon this foundation of progress.
Supplemental Material
Download MS Word (834.2 KB)Acknowledgments
We thank Finn Müller-Hansen for parsing the IIASA scenario database and Robbie Andrew for compiling the Kaya data.
Disclosure statement
No potential conflict of interest was reported by the author(s).
Additional information
Funding
Notes
1 According to EDGAR, Jamaica had a short-lived peak of emissions from the industry sector in 2006 followed by a sharp decline in subsequent years. This is likely due to activities in the mining sector (Jamaica is a major world producer of bauxite), where Jamaica's UNFCCC submission notes recent fuel use reductions leading to overall national emissions reductions, albeit less dramatic in scale than in EDGAR (from 16 MtCO2 in 2006–15 MtCO2 in 2012) (Jamaican Ministry of Economic Growth and Job Creation, Citation2018).
References
- Agora Energiewende, & Sandbag. (2017). Energy Transition in the Power Sector in Europe: State of Affairs in 2016. https://www.agora-energiewende.de/en/publications/energy-transition-in-the-power-sector-in-china-state-of-affairs-in-2016/&per;0Ahttps://www.agora-energiewende.de/fileadmin2/Projekte/2017/JAW_China_2016/Agora_Energy-Transition-China-2016-EN_WEB.pdf
- Alvarez, R. A., Zavala-Araiza, D., Lyon, D. R., Allen, D. T., Barkley, Z. R., Brandt, A. R., Davis, K. J., Herndon, S. C., Jacob, D. J., Karion, A., Kort, E. A., Lamb, B. K., Lauvaux, T., Maasakkers, J. D., Marchese, A. J., Omara, M., Pacala, S. W., Peischl, J., Robinson, A. L., … Hamburg, S. P. (2018). Assessment of methane emissions from the U.S. Oil and gas supply chain. Science, 361(6398), 186–188. https://doi.org/https://doi.org/10.1126/science.aar7204
- Brizga, J., Feng, K., & Hubacek, K. (2013). Drivers of CO2 emissions in the former Soviet Union: A country level IPAT analysis from 1990 to 2010. Energy, 59, 743–753. https://doi.org/https://doi.org/10.1016/j.energy.2013.07.045
- Burck, J., Hagen, U., Bals, C., Höhne, N., & Nascimento, L. (2021). Climate Change Performance Index 2021. https://ccpi.org/download/the-climate-change-performance-index-2021/
- Burke, P. J. (2012). Climbing the electricity ladder generates carbon kuznets curve downturns*. Australian Journal of Agricultural and Resource Economics, 56(2), 260–279. https://doi.org/https://doi.org/10.1111/j.1467-8489.2011.00572.x
- Climate Action Tracker. (2020). Paris Agreement turning point: Wave of net zero targets reduces warming estimate to 2.1C in 2100. https://climateactiontracker.org/publications/global-update-paris-agreement-turning-point/
- Creutzig, F., Jochem, P., Edelenbosch, O. Y., Mattauch, L., van Vuuren, D. P., McCollum, D., & Minx, J. (2015). Transport: A roadblock to climate change mitigation? Science, 350(6263), 911–912. https://doi.org/https://doi.org/10.1126/science.aac8033
- Creutzig, F., Roy, J., Lamb, W. F., Azevedo, I. M. L., de Bruin, W. B., Dalkmann, H., Edelenbosch, O. Y., Geels, F. W., Grübler, A., Hepburn, C., Hertwich, E., Khosla, R., Mattauch, L., Minx, J. C., Ramakrishnan, A., Rao, N., Steinberger, J., Tavoni, M., Ürge-Vorsatz, D., & Weber, E. U. (2018). Towards demand-side solutions for mitigating climate change. Nature Climate Change, 8(April), 260–271. https://doi.org/https://doi.org/10.1038/s41558-018-0121-1
- Crippa, M., Oreggioni, G., Guizzardi, D., Muntean, M., Schaaf, E., Lo Vullo, E., Solazzo, E., Monforti-Ferrario, F., Olivier, J. G. J., & Vignati, E. (2019). Fossil CO2 and GHG emissions of all world countries - 2019 Report. https://doi.org/https://doi.org/10.2760/687800.
- Davis, S. J., Lewis, N. S., Shaner, M., Aggarwal, S., Arent, D., Azevedo, I. L., Benson, S. M., Bradley, T., Brouwer, J., Chiang, Y. M., & Clack, C. T. (2018). Net-zero emissions energy systems. Science, 360(6396), eaas9793. https://doi.org/https://doi.org/10.1126/science.aas9793
- Dubash, N. K., Hagemann, M., Höhne, N., & Upadhyaya, P. (2013). Developments in national climate change mitigation legislation and strategy. Climate Policy, https://doi.org/https://doi.org/10.1080/14693062.2013.845409
- Eskander, S. M. S. U. S. U., & Fankhauser, S. (2020). Reduction in greenhouse gas emissions from national climate legislation. Nature Climate Change, 10(8), 750–756. https://doi.org/https://doi.org/10.1038/s41558-020-0831-z
- Fankhauser, S., Gennaioli, C., & Collins, M. (2016). Do international factors influence the passage of climate change legislation? Climate Policy, 16(3), 318–331. https://doi.org/https://doi.org/10.1080/14693062.2014.1000814
- FAO. (2021). Food and Agriculture Organisation of the United Nations: FAOSTAT Database. http://faostat.fao.org/
- Feng, K. (2019). Drivers of peak and decline. Nature Climate Change, 9(3), 188–189. https://doi.org/https://doi.org/10.1038/s41558-019-0421-0
- Friedlingstein, P., Jones, M. W., O’Sullivan, M., Andrew, R. M., Hauck, J., Peters, G. P., Peters, W., Pongratz, J., Sitch, S., Le Quéré, C., Bakker, D. C. E., Marland, G., McGuire, P. C., Melton, J. R., Metzl, N., Munro, D. R., Nabel, J. E. M. S., Nakaoka, S.-I., Neill, C., … Zaehle, S. (2019). Global Carbon Budget 2019. Earth System Science Data, 11(4), 1783–1838. https://doi.org/https://doi.org/10.5194/essd-11-1783-2019
- Friedlingstein, P., Sullivan, M. O., Jones, M. W., Andrew, R. M., & Hauck, J. (2020). Global Carbon Budget 2020. Earth System Science Data, 12(4), 3269–3340. https://doi.org/https://doi.org/10.5194/essd-12-3269-2020
- Grantham Institute. (2017). Climate Change Laws of the World database. http://www.lse.ac.uk/GranthamInstitute/legislation/
- Hmiel, B., Petrenko, V. V., Dyonisius, M. N., Buizert, C., Smith, A. M., Place, P. F., Harth, C., Beaudette, R., Hua, Q., Yang, B., Vimont, I., Michel, S. E., Severinghaus, J. P., Etheridge, D., Bromley, T., Schmitt, J., Faïn, X., Weiss, R. F., & Dlugokencky, E. (2020). Preindustrial 14CH4 indicates greater anthropogenic fossil CH4 emissions. Nature, 578(7795), 409–412. https://doi.org/https://doi.org/10.1038/s41586-020-1991-8
- Höhne, N., Elzen, M. d., Rogelj, J., Metz, B., Fransen, T., Kuramochi, T., Olhoff, A., Alcamo, J., Winkler, H., Fu, S., Schaeffer, M., Schaeffer, R., Peters, G. P., Maxwell, S., & Dubash, N. K. (2020). Emissions: World has four times the work or one-third of the time. Nature, 579(7797), 25–28. https://doi.org/https://doi.org/10.1038/d41586-020-00571-x
- Huppmann, D., Kriegler, E., Krey, V., Riahi, K., Rogelj, J., Rose, S. K., Weyant, J., Bauer, N., Bertram, C., Bosetti, V., & Calvin, K. (2019). IAMC 1.5°C scenario explorer and data hosted by IIASA release 2.0. Integrated Assessment Modeling Consortium & International Institute for Applied Systems Analysis, 10, https://doi.org/https://doi.org/10.5281/zenodo.3363345
- Iacobuta, G., Dubash, N. K., Upadhyaya, P., Deribe, M., & Höhne, N. (2018). National climate change mitigation legislation, strategy and targets: A global update. Climate Policy, 3062, 1–19. https://doi.org/https://doi.org/10.1080/14693062.2018.1489772
- IEA. (2020). World energy balances (2020th ed.). International Energy Agency. https://doi.org/https://doi.org/10.5257/iea/web/2013.
- IPCC. (2018). Summary for policymakers. In V. Masson-Delmotte, P. Zhai, H.-O. Pörtner, D. Roberts, J. Skea, P. R. Shukla, A. Pirani, W. Moufouma-Okia, C. Péan, R. Pidcock, S. Connors, J. B. R. Matthews, Y. Chen, X. Zhou, M. I. Gomis, E. Lonnoy, T. Maycock, M. Tignor, & T. Waterfield (Eds.), Global Warming of 1.5°C. An IPCC Special Report on the impacts of global warming of 1.5°C above pre-industrial levels and related global greenhouse gas emission pathways, in the context of strengthening the global response to the threat of climate change (pp. 1–24). Cambridge University Press.
- Jackson, R. B., Friedlingstein, P., Andrew, R. M., Canadell, J. G., Quéré, C. L., & Peters, G. P. (2019). Persistent fossil fuel growth threatens the Paris Agreement and planetary health. Environmental Research Letters, 14(12), 121001. https://doi.org/https://doi.org/10.1088/1748-9326/ab57b3
- Jamaican Ministry of Economic Growth and Job Creation. (2018). Third National Communication of Jamaica to the United Nations Framework Convention on Climate Change. https://www4.unfccc.int/sites/SubmissionsStaging/NationalReports/Documents/578491_Jamaica-NC3-1-TNC_Final_December132018.pdf
- Janssens-Maenhout, G., Crippa, M., Guizzardi, D., Muntean, M., Schaaf, E., Dentener, F., Bergamaschi, P., Pagliari, V., Olivier, J. G. J., Peters, J. A. H. W., van Aardenne, J. A., Monni, S., Doering, U., Petrescu, A. M. R., Solazzo, E., Oreggioni, G. D., Petrescu, R., Solazzo, E., & Oreggioni, G. D. (2019). EDGAR v4.3.2 global atlas of the three major greenhouse Gas emissions for the period 1970-2012. Earth System Science Data, 11(3), 959–1002. https://doi.org/https://doi.org/10.5194/essd-11-959-2019
- Kuriyama, A., & Abe, N. (2018). Ex-post assessment of the Kyoto Protocol – quantification of CO2 mitigation impact in both Annex B and non-Annex B countries-. Applied Energy, 220, 286–295. https://doi.org/https://doi.org/10.1016/j.apenergy.2018.03.025
- Lamb, W. F., Mattioli, G., Levi, S., Roberts, J. T., Minx, J. C., Müller-hansen, F., Capstick, S., Creutzig, F., Culhane, T., & Steinberger, J. K. (2020). Discourses of climate delay. Global Sustainability, 3(e17), 1–5. https://doi.org/https://doi.org/10.1017/sus.2020.13
- Le Quéré, C., Korsbakken, J. I., Wilson, C., Tosun, J., Andrew, R., Andres, R. J., Canadell, J. G., Jordan, A., Peters, G. P., & van Vuuren, D. P. (2019). Drivers of declining CO 2 emissions in 18 developed economies. Nature Climate Change, 9(3), https://doi.org/https://doi.org/10.1038/s41558-019-0419-7
- Levin, K., & Rich, D. (2017). Turning Points: Trends in Countries’ Reaching Peak Greenhouse Gas Emissions Over Time. http://www.wri.org/ publication/turning-points
- Luderer, G., Vrontisi, Z., Bertram, C., Edelenbosch, O. Y., Pietzcker, R. C., Rogelj, J., De Boer, H. S., Drouet, L., Emmerling, J., Fricko, O., Fujimori, S., Havlík, P., Iyer, G., Keramidas, K., Kitous, A., Pehl, M., Krey, V., Riahi, K., Saveyn, B., … Kriegler, E. (2018). Residual fossil CO2 emissions in 1.5-2°C pathways. Nature Climate Change, 8(7), 626–633. https://doi.org/https://doi.org/10.1038/s41558-018-0198-6
- Lynch, J., Cain, M., Pierrehumbert, R., & Allen, M. (2020). Demonstrating GWP *: a means of reporting warming-equivalent emissions that captures the contrasting impacts of short- and long-lived climate pollutants Demonstrating GWP *: A means of reporting warming-equivalent emissions that captures the contrasting. Environmental Research Letters, 15(4), 044023. https://doi.org/https://doi.org/10.1088/1748-9326/ab6d7e
- Maamoun, N. (2019). The Kyoto protocol: Empirical evidence of a hidden success. Journal of Environmental Economics and Management, https://doi.org/https://doi.org/10.1016/j.jeem.2019.04.001
- Mattioli, G., Roberts, C., Steinberger, J. K., & Brown, A. (2018). The political economy of car dependence: A systems of provision approach. Energy Research & Social Science, 66, 101486. https://doi.org/https://doi.org/10.1016/j.erss.2020.101486
- Minx, J. C., Lamb, W. F., Andrew, R. M., Canadell, J. G., Crippa, M., Döbbeling, N., Forster, P. M., Guizzardi, D., Olivier, J., Peters, G. P., Pongratz, J., Reisinger, A., Rigby, M., Saunois, M., Smith, S. J., Solazzo, E., & Tian, H. (2021). A comprehensive and synthetic dataset for global, regional, and national greenhouse gas emissions by sector 1970–2018 with an extension to 2019. Earth System Science Data, 13, 5213–5252. https://doi.org/https://doi.org/10.5194/essd–13–5213–2021
- Mohlin, K., Bi, A., Brooks, S., Camuzeaux, J., & Stoerk, T. (2019). Turning the corner on US power sector CO2 emissions - A 1990-2015 state level analysis. Environmental Research Letters, 14(8), 084049. https://doi.org/https://doi.org/10.1088/1748-9326/ab3080
- Myhre, G., Shindell, D., Bréon, F.-M., Collins, W., Fuglestvedt, J., Huang, J., Koch, D., Lamarque, J.-F., Lee, D., Mendoza, B., Nakajima, T., Robock, A., Stephens, G., Takemura, T., & Zhang, H. (2013). Anthropogenic and natural radiative forcing. In T. F. Stocker, D. Qin, G.-K. Plattner, M. Tignor, S. K. Allen, J. Boschung, A. Nauels, Y. Xia, V. Bex, & P. M. Midgley (Eds.), Climate Change 2013: The physical Science basis. Contribution of working group I to the fifth assessment report of the Intergovernmental Panel on Climate Change (pp. 659–740). Cambridge University Press.
- Olivier, J. G. J., Van Aardenne, J. A., Dentener, F. J., Pagliari, V., Ganzeveld, L. N., & Peters, J. A. H. W. (2005). Recent trends in global greenhouse gas emissions:Regional trends 1970–2000 and spatial distributionof key sources in 2000. Environmental Sciences, 2(2–3), 81–99. https://doi.org/https://doi.org/10.1080/15693430500400345
- Peters, G. P., Andrew, R. M., Canadell, J. G., Friedlingstein, P., Jackson, R. B., Korsbakken, J. I., Le Quéré, C., & Peregon, A. (2020). Carbon dioxide emissions continue to grow amidst slowly emerging climate policies. Nature Climate Change, 10(January), 2–10. https://doi.org/https://doi.org/10.1038/s41558-019-0659-6
- Peters, G. P., Andrew, R. M., Canadell, J. G., Fuss, S., Jackson, R. B., Korsbakken, J. I., Le Quéré, C., & Nakicenovic, N. (2017). Key indicators to track current progress and future ambition of the Paris agreement. Nature Climate Change, 7(2), 118–122. https://doi.org/https://doi.org/10.1038/nclimate3202
- Peters, G. P., Marland, G., Le Quéré, C., Boden, T., Canadell, J. G., & Raupach, M. R. (2012). Rapid growth in CO2 emissions after the 2008–2009 global financial crisis. Nature Climate Change, 2(1), 2–4. https://doi.org/https://doi.org/10.1038/nclimate1332
- Peters, G. P., Minx, J. C., Weber, C. L., & Edenhofer, O. (2011). Growth in emission transfers via international trade from 1990 to 2008. Proceedings of the National Academy of Sciences of the United States of America, 108(21), 8903–8908. https://doi.org/https://doi.org/10.1073/pnas.1006388108
- Rečková, D., Rečka, L., & Ščasný, M. (2017). Coal Transition in the Czech Republic. https://www.iddri.org/sites/default/files/PDF/Publications/Catalogue Iddri/Rapport/201706-iddri-climatestrategies-coal_uk.pdf
- Rodrigues, J. F. D., Wang, J., Behrens, P., & de Boer, P. (2020). Drivers of CO2 emissions from electricity generation in the European Union 2000–2015. Renewable and Sustainable Energy Reviews, 133, 110104. https://doi.org/https://doi.org/10.1016/j.rser.2020.110104
- Rogelj, J., Shindell, D., Jiang, K., Fifita, S., Forster, P., Ginzburg, V., Handa, C., Kheshgi, H., Kobayashi, S., Kriegler, E., Mundaca, L., Séférian, R., & Vilariño, M. (2018). Mitigation pathways compatible with 1.5°C in the context of sustainable development. In V. Masson–Delmotte, P. Zhai, H.–O. Pörtner, D. Roberts, J. Skea, P. R. Shukla, A. Pirani, W. Moufouma–Okia, C. Péan, R. Pidcock, S. Connors, J. B. R. Matthews, Y. Chen, X. Zhou, M. I. Gomis, E. Lonnoy, T. Maycock, M. Tignor, & T. Waterfield (Eds.), Global warming of 1.5 °C an IPCC special report on the impacts of global warming of 1.5 °C above pre-industrial levels and related global greenhouse gas emission pathways, in the context of strengthening the global response to the threat of climate change (pp. 93–174). Cambridge University Press.
- Saidi, K., & Omri, A. (2020). Reducing CO2 emissions in OECD countries: Do renewable and nuclear energy matter? Progress in Nuclear Energy, 126(June), 103425. https://doi.org/https://doi.org/10.1016/j.pnucene.2020.103425
- Schierhorn, F., Kastner, T., Kuemmerle, T., Meyfroidt, P., Kurganova, I., Prishchepov, A. V., Erb, K. H., Houghton, R. A., & Müller, D. (2019). Large greenhouse gas savings due to changes in the post-Soviet food systems. Environmental Research Letters, 14(6), 65009. https://doi.org/https://doi.org/10.1088/1748-9326/ab1cf1
- Sovacool, B. K. (2013). Energy policymaking in Denmark: Implications for global energy security and sustainability. Energy Policy, 61, 829–839. https://doi.org/https://doi.org/10.1016/j.enpol.2013.06.106
- Strefler, J., Bauer, N., Kriegler, E., Popp, A., Giannousakis, A., & Edenhofer, O. (2018). Between scylla and charybdis: Delayed mitigation narrows the passage between large-scale CDR and high costs. Environmental Research Letters, 13(4), 044015. https://doi.org/https://doi.org/10.1088/1748-9326/aab2ba
- Ürge-Vorsatz, D., Miladinova, G., & Paizs, L. (2006). Energy in transition: From the iron curtain to the European Union. Energy Policy, 34(15), 2279–2297. https://doi.org/https://doi.org/10.1016/j.enpol.2005.03.007
- Weller, Z. D., Hamburg, S. P., & Von Fischer, J. C. (2020). A national estimate of methane leakage from pipeline mains in natural Gas local distribution systems. Environmental Science and Technology, 54(14), 8958–8967. https://doi.org/https://doi.org/10.1021/acs.est.0c00437
- Wilson, I. A. G., & Staffell, I. (2018). Rapid fuel switching from coal to natural gas through effective carbon pricing. Nature Energy, 3(5), 365–372. https://doi.org/https://doi.org/10.1038/s41560-018-0109-0
- Wood, R., Grubb, M., Anger-Kraavi, A., Pollitt, H., Rizzo, B., Alexandri, E., Stadler, K., Moran, D., Hertwich, E., & Tukker, A. (2020). Beyond peak emission transfers: Historical impacts of globalization and future impacts of climate policies on international emission transfers. Climate Policy, 20(sup1), S14–S27. https://doi.org/https://doi.org/10.1080/14693062.2019.1619507
- World Bank. (2020). World Bank Development Indicators. http://data.worldbank.org/
- Xia, Q., Wang, H., Liu, X., & Pan, X. (2020). Drivers of global and national CO2 emissions changes 2000–2017. Climate Policy, https://doi.org/https://doi.org/10.1080/14693062.2020.1864267