
 ?Mathematical formulae have been encoded as MathML and are displayed in this HTML version using MathJax in order to improve their display. Uncheck the box to turn MathJax off. This feature requires Javascript. Click on a formula to zoom.
ABSTRACT
Biomechanical measurements of accidental ankle sprain injuries are rare but make important contributions to a more detailed understanding of the injury mechanism. In this case study, we present the kinematics and kinetics of a lateral ankle sprain of a female athlete performing handball-specific fake-and-cut manoeuvres. Three-dimensional kinematics and kinetics were recorded and six previously performed trials were used as reference. Plantarflexion, inversion, and internal rotation angles were substantially larger than the reference trials and peaked between 190 and 200 ms after initial ground contact. We observed a highly increased inversion and internal rotation moment. However, compared to the non-injury trials the data also revealed a reduction in the second dorsiflexion moment peak. Ground reaction forces were lower throughout the injury trial. Other parameters at initial ground contact including ankle and hip position, step length, and the traction coefficient indicate that a preparatory maladjustment occurred. This study adds valuable contributions to the understanding of lateral ankle sprains by building upon previously published reports and considering the shoe-surface interaction as an important factor for injury.
Introduction
Lateral ankle sprains are highly prevalent sports injuries that occur frequently in indoor and court sports (Doherty et al., Citation2014; Fong et al., Citation2009; Gribble et al., Citation2016). At present, lateral ankle sprains are most often characterised by excessive inversion in combination with internal rotation, plantarflexion, or a combination of both (Gribble et al., Citation2016; Lysdal et al., Citation2022). Repeated occurrences of such an injury may lead to chronic ankle instability, which has been linked to the development of ankle osteoarthritis (Gribble et al., Citation2016). Furthermore, the injury is often associated with high costs caused by a high treatment burden and productivity loss in both recreational and professional sports (Gribble et al., Citation2016). Despite existing reviews (Lysdal et al., Citation2022) and consensus statements (Gribble et al., Citation2016), the causes and mechanisms of lateral ankle injuries are still not fully understood. Gehring et al. (Citation2013) suggested that injuries can be initiated even long before the actual ground contact, emphasising the existence and significance of preparatory (mal)adjustments. Such inadequate postural adjustments may easily occur during non-anticipated and time-critical tasks, and they can result in compromised movement performance, increased loads, and possibly injury (Besier et al., Citation2001; Gehring et al., Citation2013).
High shoe-surface traction is believed to be an important risk factor for lateral ankle sprains (Dragoo & Braun, Citation2010; Pasanen et al., Citation2008) and was hypothesised to increase the torque around the ankle joint during cutting tasks (Frias Bocanegra & Fong, Citation2022). It is typically measured as the coefficient of friction, which assesses the amount of traction in shoe-surface interactions. The coefficient of friction can be divided into utilised (UCOF) and available (ACOF) values. UCOF is measured during biomechanical studies, reflecting actual traction, while ACOF is determined using mechanical testing devices, representing maximum traction potential. While traction should provide enough grip to prevent slipping, excessive friction increases the risk of lower extremity injuries (Dragoo & Braun, Citation2010; Orchard et al., Citation2013). It has been further suggested that unexpected changes in traction coefficients resulting from the interaction between the shoe and the surface could create potentially hazardous situations for athletes (Bagehorn et al., Citation2023). The role of traction in ankle sprain injuries is not well understood, and clear guidelines and critical thresholds for such injuries remain unclear, particularly during lateral-oriented movements (Bagehorn et al., Citation2023).
Different possibilities exist to investigate the occurrence and mechanism of injury, among them prospective cohort studies (Herzog et al., Citation2019), video analyses (Skazalski et al., Citation2018), single case studies in form of accidental lab injuries (Chin et al., Citation2021; Gehring et al., Citation2013) or video-based motion analysis with Model-Based Image-Matching (MBIM) (Fong et al., Citation2012), and cadaveric experiments (Rochelle et al., Citation2020). A previous review has highlighted the importance of analysing case studies from biomechanical lab studies and how they have helped to better understand the injury mechanisms of lateral ankle sprains (Lysdal et al., Citation2022). These incidents often included a detailed three-dimensional kinetic analysis of the injury situation, which is currently only possible if the injury eventuates in a laboratory setting during data recording. Such in-depth biomechanical analyses are thus crucial for creating a better understanding of the injury mechanisms of lateral ankle sprains and improving prevention strategies and rehabilitation methods in the future (Bahr & Krosshaug, Citation2005).
The purpose of this study is to describe ankle joint biomechanics in a recent injury case that occurred in a force plate-equipped motion capture laboratory while studying handball-specific fake-and-cut manoeuvres.
Materials and methods
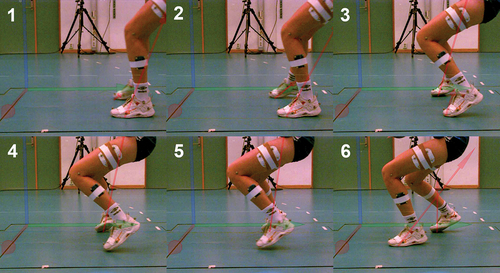
The affected athlete was a female junior elite handball player (182 cm, 63 kg, 17 years). She was right foot dominant, right arm dominant, and played on the right back position in the first Norwegian junior division. She had no injury history in the injured foot (right) but had several previous ankle sprains on the contralateral side. After the incident (), she was immediately treated by an attending physiotherapist. She was unable to continue with the measurements and could not participate in any sport for the next two days. Though there was no swelling of the ankle, she described a radiating pain up the calf on the first day after the injury with perceptible tenderness the following week. She did not seek any further medical treatment from a doctor or physical therapist.
Figure 1. Screenshot sequence of the lateral ankle sprain. The pictures show initial ground contact (1), foot placement after sliding at 20 ms (2), the course of injury at 105 and 155 ms (3,4), maximum joint distortion at 195 ms (5), recovery and second foot touching the force plate at 255 ms (6).
The intended task involved executing a handball-specific fake-and-cut movement in front of a passive defender. Participants initiated the movement after accelerating for 6 metres following a pass from an experienced handball player. Once in possession of the ball, players performed a pre-planned fake and cut in front of the static defender (Kristianslund et al., Citation2014). This deceptive manoeuvre is frequently used in handball, simulating a movement in one direction while swiftly changing direction and passing the defender on the opposite side. During the recordings, participants performed cuts in both directions. However, given that the injury occurred during a fake-cut to the left side, this study specifically focused on analysing cuts towards that side. Six trials were performed before the injury, and their calculated mean value and standard deviation were used as a reference for the analysis. During the testing session, the athlete wore her own indoor shoes (Mizuno Wave Momentum, 4 months old), shorts, and a sports bra. The ethics committee of the Norwegian School of Sports Sciences approved the study prior to data collection, and written consent was obtained from the athlete.
Three-dimensional motion capture was used to record the movement of the player with the help of 23 infrared high-speed cameras (Qualisys AB, Gothenburg, Sweden) operating at 200 Hz. An eighty-two retro-reflective full-body marker set was used. Ground reaction forces (GRFs) were recorded with two force plates at 1000 Hz (AMTI, Watertown, Massachusetts, USA, 600 × 1200 mm). Initial ground contact was determined using a raw vertical GRF threshold of 30 N (Morio et al., Citation2017). Marker trajectories and GRFs were filtered with a fourth-order low-pass Butterworth filter at a 20 Hz cut-off frequency (Mai & Willwacher, Citation2019). Joint angles were calculated using the Cardan angle convention and joint kinetics with a standard inverse dynamic approach where all moments are reported as external moments (Hof, Citation1992). Moments pre-ground contact are generated by the inertia and acceleration of body segments relative to each other. Hip joint centres were determined using a regression model (Harrington et al., Citation2007) with markers attached to the anterior superior and posterior superior iliac spine. The centre of mass (COM) was calculated based on the regression model of de Leva (de Leva, Citation1996). Calculated parameters prior to ground contact are presented as negative time values. A custom-made MATLAB (R2021a, The Mathworks, Natick, USA) script was used for all model calculations. OpenSim (Delp et al., Citation2007) was used to visualise a 3D full-body model. Marker placement, joint centre definitions, and other details have been described in previous publications (Bill et al., Citation2022; Mai et al., Citation2022; Willwacher et al., Citation2013).
The following variables of the injured leg were exported and included in our analysis: Ankle, knee, and hip joint angles, pelvic and forefoot global angles, angular velocities, joint moments, GRF, COM position, velocity, and acceleration. Additionally, the ankle joint moment arm was calculated as the distance from the ground reaction force vector to the ankle joint centre. To account for force fluctuations, 5% of the trial length was removed at the beginning and end of each trial. Cutting angle was defined as the angle between the horizontal COM velocity vector at initial contact and toe-off, foot progression angle as the angle between the long axis of the foot projected onto the horizontal plane and the vector of the horizontal COM velocity (Bill et al., Citation2022). Step length was calculated as the distance between the left and right heel markers, COM distance to the injured leg as the 2D distance between COM projected on the floor and right heel in the transverse plane, and shoe-surface traction represented as UCOF (EquationEquation 1(1)
(1) ) (Bagehorn et al., Citation2023). Horizontal COM velocity, step length, COM distance, hip angles, pelvic angle, and foot progression angle were calculated at initial ground contact.
Results
Kinematics
For the injury trial, the athlete’s horizontal COM velocity was 3.06 m/s, cutting angle 19° and foot progression angle −9.3°. By contrast, for the reference trials values were 2.88 ± 0.24 m/s, 71 ± 11.8° and −8.5 ± 4.1° respectively. Step length for the injury trial was 42.1 cm and foot to COM distance 39.9 cm, while the reference trials showed a step length of 66.6 ± 8.6 cm and foot to COM distance of 50.7 ± 8.6 cm. Pelvic external rotation at initial ground contact was 9.9° in the injury trial compared to 17.1 ± 3.0° in the reference trials. Hip abduction angle at initial ground contact was 16.7° compared to 25.5 ± 1.6° in the reference trials (Figure App1). After the initial ground contact, the athlete’s foot slid another 23.1 cm over a duration of 60 ms.
Ankle angles
At initial ground contact, ankle plantarflexion was 15.8° compared to 22.0 ± 3.8° in the reference trials, inversion 9.4° compared to 4.1 ± 1.7°, and internal rotation 8.0° compared to −0.5 ± 2.2° (). During the injury trial, plantarflexion, inversion, and internal rotation started to deviate from the reference trials at approximately 80 ms after initial ground contact. In all planes, peak values were reached at a nearly simultaneous timepoint between 190 and 200 ms after initial contact. In contrast to the reference trials, where the ankle went into dorsiflexion after approximately 90 ms, the foot drastically moved into an increased plantarflexion which peaked at 40.7° at 190 ms. This was followed by a rapid dorsiflexion which increased towards the end of the ground contact. The reference trials’ average plantarflexion peak was 25.6 ± 1.3° at 22 ± 10 ms. Inversion peaked at 39.8° at 200 ms, compared to 31.9 ± 7.1° at 44 ± 56 ms in the reference trials. At 62.8°, internal rotation reached its peak at 195 ms which was substantially higher and later than the average of the reference trials, the majority of which reached their peak value before ground contact (11.9 ± 6.1° at −57 ± 82 ms). During ground contact, internal rotation demonstrated another small peak at approximately 110 ms in the reference trials. The injury trial showed the highest inversion and internal rotation at initial ground contact (0 ms) of all recorded trials.
Figure 2. Ankle angles and moments before and after ground contact. 0 ms indicates initial ground contact. The bold line represents the injury trial, while the shaded area represents the mean and standard deviation of the reference trials.
Peak angular velocities observed in the injury trial were 411.5°/s for plantarflexion, 776.2°/s for inversion, and 584.1°/s for internal rotation. In comparison, the reference trials had peak angular velocities with values of 338.9 ± 109.5°/s for plantarflexion, 1078.5 ± 319.7°/s for inversion, and 385.7 ± 139.4°/s for internal rotation.
Knee angles
Sagittal plane knee angles remained mostly unaffected until 200 ms, after which flexion increased further and peaked (285 ms, 78.8°) (). In the reference trials, knee flexion angles reached their maximum values before ground contact (at −92 ± 7 ms) or during ground contact at around midstance (100–200 ms). Knee abduction peaked late in-stance at 265 ms. By contrast, the reference trials reached their maximum abduction angle at 163 ± 20 ms and decreased afterwards. Internal rotation started to increase after 100 ms and peaked at 200 ms at 28.1°, whereas the reference trials peaked at 63 ± 16 ms at 15.7 ± 2.1° on average.
Figure 3. Knee angles and moments before and after ground contact. 0 ms indicates initial ground contact. The bold line represents the injury trial, while the shaded area represents the mean and standard deviation of the reference trials.
Center of mass (COM)
The COM position showed deviations from the reference trials after 150 ms in the x-direction and after 200 ms in the z-direction. In the x-direction, the COM velocity exhibited higher velocity at initial ground contact and remained above the reference trials throughout the trial. For the z-direction, the COM velocity varied shortly after ground contact and later in the stance phase. The COM acceleration increased in both the x- and z-directions at initial ground contact and displayed significant variations in time and amplitude throughout the entire trial ().
Figure 4. Center of mass (COM) position, velocity, and acceleration. The bold line represents the injury trial, while the shaded area represents the mean and standard deviation of the reference trials.
Kinetics
Ground reaction forces
In the injury trial, the maximum GRF was 1.62 N/BW (body weight) at 94 ms in the vertical direction, 0.82 N/BW at 85 ms in the medial direction (‘x’), and 0.56 N/BW at 47 ms in the posterior direction (‘y’) (). By comparison, the average of the reference trials was 2.43 ± 0.3 N/BW at 60 ± 19 ms in the vertical direction, 1.61 ± 0.3 N/BW at 59 ± 13 ms in the medial direction (‘x’), and 0.69 ± 0.1 N/BW at 35 ± 21 ms in the posterior direction (‘y’). The UCOF in the injury trial differed from the other trials mentioned in terms of its pattern. While it was not the highest, it exhibited a unique behaviour characterised by a rapid increase in traction immediately after ground contact. This was followed by a subsequent decline in traction (). Maximum UCOF values were 1.35 in the injury trial and 1.45 ± 0.46 in the reference trials.
Figure 5. Ground reaction forces (GRFs) after initial ground contact. The bold line represents the injury trial, while the shaded area represents the mean and standard deviation of the reference trials.
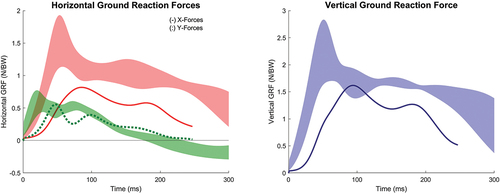
Figure 6. Traction coefficient during the ground contact phase. The bold line represents the injury trial.
Ankle moments
After an initial increase, the dorsiflexion moment peaked at 77 ms and declined afterwards (). By contrast, the average peak of the reference trials was located at 226 ± 32 ms. Inversion moment increased steadily after initial ground contact until it reached its maximum at 179 ms with 89.9 Nm. This is roughly five times higher than the average moment of the reference trials (17.2 ± 5.7 Nm), which reached its maximum at 90 ± 26 ms. The internal rotation moment peaked at 176 ms with 42.9 Nm, whereafter it rapidly declined. The reference trials not only reached their highest value earlier (63 ± 50 ms), but also at a lower magnitude (9.3 ± 4.8 Nm) before changing into an external rotation moment in late stance.
GRF ankle joint moment arms
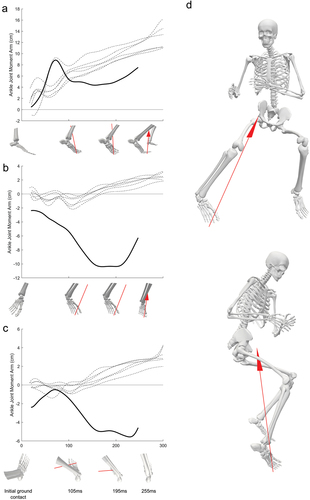
The ankle joint moment arm, which generated an external dorsiflexion moment in the sagittal plane, showed a rapid increase in the injury trial, peaking at 8.8 cm at 72 ms, and then quickly dropped (). Subsequently, the moment arm remained consistently lower than the reference trials throughout ground contact. In the frontal plane, the ankle joint moment arm, which generated an external inversion moment in the injury trial, exhibited a lower onset value which rapidly increased and reached a peak of 10.4 cm at 171 ms. In contrast, the reference trials displayed oscillations around the zero axis and demonstrated a slight increase as ground contact progressed, extending into the phase of foot push-off. The ankle joint moment arm in the transverse plane, which generated an externally applied internal rotation moment, was initially lower than the reference trials but reached a peak distance at 5.6 cm at 229 ms. In contrast, the reference trials moment arms were generally small until push-off.
Figure 7. Ankle joint moment arm time curves and ankle joint position at highlighted timepoints in the sagittal (A), frontal (B), and transverse planes (C). The full body skeleton (D) shows the athletes body alignment and GRF at highest ankle excursion (195 ms) from a frontal and lateral perspective.
Knee moments
We observed a reduced knee flexion moment which reached its peak at 171 ms, whereas the reference trials did this on average at 82 ± 12 ms (). The knee abduction moment was also considerably lower in the injury trial compared to the reference trials. However, variation among the reference trials in knee abduction moment was large. The injury trial showed a peak of 40.9 Nm at 120 ms while the reference trials peaked on average at 228 ± 31 ms with 101.5 ± 21.1 Nm. Peak internal rotation moment steadily increased and peaked at a similar time point (200 ms, 18.5 Nm) as the majority of the reference trials (191 ± 83 ms, 20.3 ± 5.4 Nm).
Discussion and implication
This case report of a lateral ankle sprain provides detailed and unique insights into an accidental injury event in the laboratory while building upon the knowledge of previously released cases. Substantial differences between the injury and the reference trials were observed at initial contact in ankle position, pelvic orientation, hip abduction angle, step length, and foot distance to COM. The subsequent injury exhibited differences in GRF progression, excessive plantarflexion, inversion, and internal rotation angles of the ankle. Furthermore, it is characterised by ankle inversion and internal rotation moments five times higher than the reference trials. A preparatory maladjustment and a slip-catch shoe-surface interaction are likely to have contributed to this injury.
Step length, foot distance to the COM, pelvic external rotation, and hip abduction angle at initial contact were considerably smaller compared to the reference trials, indicating that the approach strategy was different in the preparatory phase with the foot airborne. Similar circumstances have been described previously by Chin et al. (Citation2021). In Chin’s investigation, step length and COM distance were 51 and 52 cm compared to 59–65 cm (step length) and 59–61 cm (COM) in the reference trials. These discrepancies in step length, COM, and hip abduction thus make this a potential cause for lateral ankle sprains. The COM data revealed an increased lateral velocity compared to the reference trials, with a temporary drop at 20 ms. Additionally, a sudden decrease in COM acceleration was observed at that instant, which coincides with the UCOF peak. This could resemble the impact of premature foot contact and its effect on the weight acceptance phase. The increased lateral velocity suggests a failure in braking the lateral motion, causing the heavier body segments like the torso to continue to move towards the faking direction. Upper body adjustment and lower extremity configuration during the force plate approach, however, resembled the reference trials. Visually, it could be inferred that the athlete did not lift her foot high enough, resulting in the injured leg being positioned closer to the body’s centre compared to the other trials. Consequently, the athlete contacted the ground prematurely and in a most likely unfavourable position, which is further indicated by an increased ankle joint moment arm directly after initial ground contact (). This maladjustment also resulted in the right foot to slide 23.1 cm for 60 ms which lets all angle time-curves and GRFs appear slightly delayed in time compared to the reference trials.
Major deviations in kinematics from the six reference trials took place at 60–80 ms after initial contact, suggesting that the injury was initiated in this time window. Sudden increases in inversion, plantarflexion, and internal rotation with simultaneous peaks at 190–200 ms highlight the extent of the injury. The inversion and internal rotation moments reached their highest values shortly (between 176–179 ms) before this and concurrently with the second dorsiflexion peak but at a lower deflection moment. We observed a higher inversion and internal rotation moment, but a lower dorsiflexion moment in the injury trial relative to the reference trials. These biomechanical patterns are strikingly similar to the ones observed in Kristianslund et al. (Citation2011), where mistakenly an external plantarflexion moment was reported instead of a dorsiflexion moment. This may be linked to the fact that the athlete in both case studies performed a handball-specific sideward cutting movement against a static defender. The peak inversion moment attained in our study was five times higher than in the reference trials, indicating high stress on the lateral structures of the ankle. Both inversion and internal rotation moments are the third highest ever recorded in a laboratory environment (Lysdal et al., Citation2022). The increased ankle joint moment arms may have largely contributed to the emergence of such high moment amplitudes. The simultaneous combination of ankle movements suggests that joint and ligament loading were at their highest during these time intervals (Panagiotakis et al., Citation2017). Considering the observations from this study in the context of recent simulation studies, it seems likely that the anterior talofibular ligament would experience high strain and possibly fail due to the combination of high inversion and internal moments along with a high degree of plantarflexion (Purevsuren et al., Citation2018). Interestingly, the current sprain did not result in a complete ligament tear.
As previously highlighted by Lysdal et al. (Citation2022) we could likewise observe a ‘two peaks’ pattern of the inversion angle, with the second being higher and more pronounced. This pattern was also evident in the plantarflexion angle, dorsiflexion moment, and internal rotation moment. This was, however, not the case for the inversion moment which has often been observed in combination with such an inversion pattern. As previously suggested, the ‘two peaks’ pattern could indicate a joint maladjustment and a subsequent attempt to unload the foot (Lysdal et al., Citation2022). In the frontal plane an eversion correction movement was observed shortly after peak inversion and resulted in a slightly less inverted foot before lift-off.
Previous research defined an inverted and highly plantarflexed ankle joint at ground contact as a vulnerable position for lateral ankle sprains (Wright et al., Citation2000). Slightly increased ankle inversion was observed in the present case, where the ankle was 9.4° inverted at initial ground contact, as compared to 4.1 ± 1.7° in the reference trials. It therefore might have played a role in the injury occurrence. Initial foot plantarflexion was present during all reference trials (22.0 ± 3.8°) but slightly reduced in the injury trial (15.8°). Therefore, it seems unlikely to have contributed to the injury, as proposed in previous research (Hamel et al., Citation2004; Wright et al., Citation2000). Plantarflexion was, however, a defining characteristic of the injury. This supports the claim that although plantarflexion is not crucial for the occurrence of a lateral ankle sprain, it can still be present (Lysdal et al., Citation2022). Moreover, we also observed a higher internal rotation angle at initial ground contact compared to the reference trials. This finding supports the higher importance of internal rotation in lateral ankle sprains compared to plantarflexion, which has been hypothesised in recent research (Lysdal et al., Citation2022). Apart from that, neither knee angles nor approach velocity differed much from the reference trial at initial contact. The cutting angle of the injury trial was lower (less sharp), which was not surprising as the athlete tried to unload her leg, thus hindering the cutting movement.
The reduced GRFs during the sprain injury can be associated with the foot sticking to the ground before full weight acceptance and a subsequent unloading reaction by the athlete, similar to what was previously reported by Chin et al. (Citation2021). That the injury was already in motion could thus be inferred as the reason that the athlete did not generate as much force towards the ground as in the reference trials. It was observed that the athlete flexed and internally rotated the knee in the late phase of ground contact. Altered flexion angles and knee moments can be interpreted as a mechanism to make the knee more compliant and to decelerate the COM (Chin et al., Citation2021). However, we did not observe an increase in knee flexion moment, only reduced knee extension and abduction moments and the continuous presence of internal rotation moments. Nevertheless, our observations match the ones from Chin et al. (Citation2021), suggesting a similar interpretation that there was an immediate response from the athlete in the form of reduced GRF values right after ground contact and a late voluntary response in the form of changes in knee biomechanics. Under this interpretation, all these adaptations were made in order to unload the affected foot and reduce the extent of the injury.
As suggested recently, the first milliseconds after initial contact are critical and may decide if an injury occurs or not (Lysdal et al., Citation2022). Looking at the traction coefficient during this period provides important insights into the utilised traction and details of the shoe-surface interaction. Unfortunately, we couldn’t quantify the athlete’s shoe ACOF using mechanical tests and compare it to the measured UCOF. However, a study by Bagehorn et al. (Citation2023) reported ACOF values of 1.01 ± 0.12 in medio-lateral sliding direction and 0.92 ± 0.12 for sliding on the lateral edge of indoor shoes. The average stance phase UCOF values in the reference trials were between 0.5–0.8, resembling the friction range perceived as sufficient during direction changes (Keshvari & Senner, Citation2015; Morio et al., Citation2017). This suggests adequate traction during most cuts. Yet, during initial ground contact, UCOF values averaged 1.44 ± 0.43 and remained elevated for a few milliseconds. These high initial values indicate an increased injury risk during early contact, implying a potential need for reduced friction in critical shoe contact areas.
In the injury trial and right after initial ground contact, we observed a rapid increase in UCOF followed by a steady decline, which is atypical compared to the other trials (.). This behaviour may indicate a sudden increase in shoe traction, possibly caused by the prevalent joint maladjustment and consequent premature ground contact. Throughout all reference trials, the athlete approached the ground with an inverted ankle, neutral internal/external rotation, and inverted global forefoot position, suggesting initial foot contact towards the lateral side of the shoe (Figure App2). Surprisingly, no substantial differences in global forefoot inversion and global internal rotation angles were observed in the injury trial, indicating a similar shoe position towards the ground. However, increased ankle inversion and internal rotation angles were observed in the injury trial, which consequently means that the overall body alignment towards the foot had to be different. This is reflected in the differences in hip abduction, step length, and the COM distance towards the foot, of which the latter might be critical when combined with the observed high friction. This may have stopped the landing movement at a premature point in time, anchoring the foot to the ground in a vulnerable position, and consequently leading to injury (Bagehorn et al., Citation2023). Previous research observed similar preparatory maladjustments and stated their importance in the occurrence of ankle sprains (Gehring et al., Citation2013; Lysdal et al., Citation2022). It seems plausible that such maladjustments were the driving factor in this case study. While the shoe-surface interaction was often overlooked in previous case studies, our findings, along with evidence from other studies (Frias Bocanegra & Fong, Citation2022; Lysdal et al., Citation2020; Pasanen et al., Citation2008) suggest that it may have facilitated the development of the injury. However, due to the nature of this being a case study and the lack of knowledge about the shoe’s traction properties, these findings remain speculative. Further research is needed to confirm the role of shoe-surface interaction in ankle sprains.
This study aimed to describe and better understand the mechanics of an accidental lateral ankle sprain. Despite being a single case study, it offers potential implications for future injury prevention. Future interventions could involve the exploration of options like braces designed to elevate the outer edge of the foot, aiming to prevent premature catching of the floor. Furthermore, it may prove beneficial to address a reduction in friction on the lateral edge of the shoe as highlighted by Lysdal et al. (Citation2020). Footwear brands should be more aware of the importance of traction on different parts of the shoe outsole and incorporate this understanding into the design of future products. Additionally, training interventions that target proper movement execution in complex and unexpected situations may prove beneficial in reducing preparatory maladjustments (Besier et al., Citation2001).
Limitations
During data analysis, an effort was made to isolate the sliding motion to be able to better compare the injury loading characteristics with the reference trials. This was achieved by aligning the vertical GRF of the injury trial with their average (Figure App3). Consequently, the GRF required 25 ms of sliding time to align with the reference trials, leaving an additional 35 ms of sliding while loading increased. However, clear separation of the sliding phase from the weight acceptance phase was not possible. Although some angles and moments visually aligned better with the reference trials until the injury offset, this report’s focus is to comprehend the injury’s cause, in which the sliding motion appears crucial. Eliminating or shifting it would impede meaningful interpretation. Moreover, given that reported values primarily involve peak angles and moments, the need for comparing loading time curve characteristics becomes less essential. Thus, the decision was made to maintain the GRF threshold as the reference point for comparison. If time-dependent interpretation is crucial, the 25 ms shift can be taken into account.
Conclusions
The kinematic and kinetic analyses of this injury case indicate that the primary factor leading to the accidental lateral ankle sprain was a preparatory maladjustment. This maladjustment was characterised by a shorter step length, reduced COM distance, decreased hip abduction and pelvic external rotation, and larger degrees of ankle inversion and internal rotation at initial contact. High traction during the first milliseconds of ground contact may have played a facilitating role in the occurrence of the injury. Further research is needed to better understand the shoe surface interaction as well as the reasons for preparatory maladjustment. This study further supports previous hypotheses, underscoring the greater significance of internal rotation in comparison to plantarflexion. These findings hold valuable implications for revising and refining the existing definition of the injury mechanism behind lateral ankle sprains.
Supplemental Material
Download Zip (764.5 KB)Disclosure statement
No potential conflict of interest was reported by the author(s).
Supplementary material
Supplemental data for this article can be accessed online at https://doi.org/10.1080/14763141.2024.2319134.
Additional information
Funding
References
- Bagehorn, T., Lysdal, F. G., Jakobsen, L., de Zee, M., & Kersting, U. G. (2023). Medio-lateral and lateral edge friction in indoor sports shoes. Footwear Science, 15(1), 17–27. https://doi.org/10.1080/19424280.2022.2127921
- Bahr, R., & Krosshaug, T. (2005). Understanding injury mechanisms: A key component of preventing injuries in sport. British Journal of Sports Medicine, 39(6), 324–329. https://doi.org/10.1136/bjsm.2005.018341
- Besier, T. F., Llloyd, D. G., Ackland, T. R., & Cochrane, J. L. (2001). Anticipatory effects on knee joint loading during running and cutting maneuvers. Medicine and Science in Sports and Exercise, 33(7), 1176–1181. https://doi.org/10.1097/00005768-200107000-00015
- Bill, K., Mai, P., Willwacher, S., Krosshaug, T., & Kersting, U. G. (2022). Athletes with high knee abduction moments show increased vertical center of mass excursions and knee valgus angles across sport-specific fake-and-cut tasks of different complexities. Frontiers in Sports and Active Living, 4, 4. https://doi.org/10.3389/fspor.2022.983889
- Chin, M., Leppänen, M., Kulmala, J., Vasankari, T., Parkkari, J., & Pasanen, K. (2021). A 3D motion capture analysis of a giving-way ankle episode during a 180-degree pivot turn: A case report. Journal of Biomechanics, 118, 110318. https://doi.org/10.1016/j.jbiomech.2021.110318
- de Leva, P. (1996). Adjustments to Zatsiorsky-Seluyanov’s segment inertia parameters. Journal of Biomechanics, 29(9), 1223–1230. https://doi.org/10.1016/0021-9290(95)00178-6
- Delp, S. L., Anderson, F. C., Arnold, A. S., Loan, P., Habib, A., John, C. T., Guendelman, E., & Thelen, D. G. (2007). OpenSim: Open-source software to create and analyze dynamic simulations of movement. IEEE Transactions on Biomedical Engineering, 54(11), 1940–1950. https://doi.org/10.1109/TBME.2007.901024
- Doherty, C., Delahunt, E., Caulfield, B., Hertel, J., Ryan, J., & Bleakley, C. (2014). The incidence and prevalence of ankle sprain injury: A systematic review and meta-analysis of prospective epidemiological studies. Sports Medicine, 44(1), 123–140. https://doi.org/10.1007/s40279-013-0102-5
- Dragoo, J. L., & Braun, H. J. (2010). The effect of playing surface on injury rate. Sports Medicine, 40(11), 981–990. https://doi.org/10.2165/11535910-000000000-00000
- Fong, D. T. P., Chan, Y.-Y., Mok, K.-M., Yung, P. S., & Chan, K.-M. (2009). Understanding acute ankle ligamentous sprain injury in sports. BMC Sports Science, Medicine and Rehabilitation, 1(1), 1–14. https://doi.org/10.1186/1758-2555-1-14
- Fong, D. T.-P., Ha, S. C.-W., Mok, K.-M., Chan, C. W.-L., & Chan, K.-M. (2012). Kinematics analysis of Ankle inversion Ligamentous Sprain injuries in sports. The American Journal of Sports Medicine, 40(11), 2627–2632. https://doi.org/10.1177/0363546512458259
- Frias Bocanegra, J. M., & Fong, D. T. P. (2022). Playing surface traction influences movement strategies during a sidestep cutting task in futsal: Implications for ankle performance and sprain injury risk. Sports Biomechanics, 21(4), 380–390. https://doi.org/10.1080/14763141.2021.1980606
- Gehring, D., Wissler, S., Mornieux, G., & Gollhofer, A. (2013). How to sprain your ankle – a biomechanical case report of an inversion trauma. Journal of Biomechanics, 46(1), 175–178. https://doi.org/10.1016/j.jbiomech.2012.09.016
- Gribble, P. A., Bleakley, C. M., Caulfield, B. M., Docherty, C. L., Fourchet, F., Fong, D. T. P., Hertel, J., Hiller, C. E., Kaminski, T. W., McKeon, P. O., Refshauge, K. M., Verhagen, E. A., Vicenzino, B. T., Wikstrom, E. A., & Delahunt, E. (2016). Evidence review for the 2016 international ankle consortium consensus statement on the prevalence, impact and long-term consequences of lateral ankle sprains. British Journal of Sports Medicine, 50(24), 1496–1505. https://doi.org/10.1136/bjsports-2016-096189
- Hamel, A. J., Sharkey, N. A., Buczek, F. L., & Michelson, J. (2004). Relative motions of the tibia, talus, and calcaneus during the stance phase of gait: A cadaver study. Gait & Posture, 20(2), 147–153. https://doi.org/10.1016/j.gaitpost.2003.07.003
- Harrington, M. E., Zavatsky, A. B., Lawson, S. E. M., Yuan, Z., & Theologis, T. N. (2007). Prediction of the hip joint centre in adults, children, and patients with cerebral palsy based on magnetic resonance imaging. Journal of Biomechanics, 40(3), 595–602. https://doi.org/10.1016/j.jbiomech.2006.02.003
- Herzog, M. M., Mack, C. D. F., Dreyer, N. A., Wikstrom, E. A., Padua, D. A., Kocher, M. S., DiFiori, J. P., & Marshall, S. W. (2019). Ankle sprains in the National Basketball Association, 2013-2014 through 2016-2017. The American Journal of Sports Medicine, 47(11), 2651–2658. https://doi.org/10.1177/0363546519864678
- Hof, A. L. (1992). An explicit expression for the moment in multibody systems. Journal of Biomechanics, 25(10), 1209–1211. https://doi.org/10.1016/0021-9290(92)90076-D
- Keshvari, B., & Senner, V. (2015). Comparison of shoe-surface tractions on various playing surfaces in futsal. Procedia Engineering, 112, 267–272. https://doi.org/10.1016/j.proeng.2015.07.245
- Kristianslund, E., Bahr, R., & Krosshaug, T. (2011). Kinematics and kinetics of an accidental lateral ankle sprain. Journal of Biomechanics, 44(14), 2576–2578. https://doi.org/10.1016/j.jbiomech.2011.07.014
- Kristianslund, E., Faul, O., Bahr, R., Myklebust, G., & Krosshaug, T. (2014). Sidestep cutting technique and knee abduction loading: Implications for ACL prevention exercises. British Journal of Sports Medicine, 48(9), 779–783. https://doi.org/10.1136/bjsports-2012-091370
- Lysdal, F. G., Bandholm, T., Tolstrup, J. S., Clausen, M. B., Mann, S., Petersen, P. B., Grønlykke, T. B., Kersting, U. G., Delahunt, E., & Thorborg, K. (2020). Does the spraino low-friction shoe patch prevent lateral ankle sprain injury in indoor sports? A pilot randomised controlled trial with 510 participants with previous ankle injuries. British Journal of Sports Medicine, 55(2), 92–98. https://doi.org/10.1136/bjsports-2019-101767
- Lysdal, F. G., Wang, Y., Delahunt, E., Gehring, D., Kosik, K. B., Krosshaug, T., Li, Y., Mok, K.-M., Pasanen, K., Remus, A., Terada, M., & Fong, D. T. P. (2022). What have we learnt from quantitative case reports of acute lateral ankle sprains injuries and episodes of ‘giving-way’ of the ankle joint, and what shall we further investigate? Sports Biomechanics, 21(4), 359–379. https://doi.org/10.1080/14763141.2022.2035801
- Mai, P., Bill, K., Glöckler, K., Claramunt-Molet, M., Bartsch, J., Eggerud, M., Tidemann Pedersen, A., Sæland, F., Bergh Moss, R., Mausehund, L., Willwacher, S., Kersting, U. G., Eriksrud, O., & Krosshaug, T. (2022). Unanticipated fake-and-cut maneuvers do not increase knee abduction moments in sport-specific tasks: Implication for ACL injury prevention and risk screening. Frontiers in Sports and Active Living, 4. https://doi.org/10.3389/fspor.2022.983888
- Mai, P., & Willwacher, S. (2019). Effects of low-pass filter combinations on lower extremity joint moments in distance running. Journal of Biomechanics, 95, 109311. https://doi.org/10.1016/j.jbiomech.2019.08.005
- Morio, C., Bourrelly, A., Sissler, L., & Gueguen, N. (2017). Perceiving slipperiness and grip: A meaningful relationship of the shoe-ground interface. Gait and Posture, 51, 58–63. https://doi.org/10.1016/j.gaitpost.2016.09.029
- Orchard, J., Walden, M., Hagglund, M., Orchard, J., Chivers, I., Seward, H., & Ekstrand, J. (2013). Comparison of injury incidences between football teams playing in different climatic regions. Open Access Journal of Sports Medicine, 251. https://doi.org/10.2147/OAJSM.S52417
- Panagiotakis, E., Mok, K. M., Fong, D. T. P., & Bull, A. M. J. (2017). Biomechanical analysis of ankle ligamentous sprain injury cases from televised basketball games: Understanding when, how and why ligament failure occurs. Journal of Science and Medicine in Sport, 20(12), 1057–1061. https://doi.org/10.1016/j.jsams.2017.05.006
- Pasanen, K., Parkkari, J., Rossi, L., & Kannus, P. (2008). Artificial playing surface increases the injury risk in pivoting indoor sports: A prospective one-season follow-up study in Finnish female floorball. British Journal of Sports Medicine, 42(3), 194–197. https://doi.org/10.1136/bjsm.2007.038596
- Purevsuren, T., Kim, K., Batbaatar, M., Lee, S., & Kim, Y. H. (2018). Influence of ankle joint plantarflexion and dorsiflexion on lateral ankle sprain: A computational study. Proceedings of the Institution of Mechanical Engineers, Part H: Journal of Engineering in Medicine, 232(5), 458–467. https://doi.org/10.1177/0954411918762955
- Rochelle, D. C., Herbert, A., Ktistakis, I., Redmond, A. C., Chapman, G. J., & Brockett, C. L. (2020). Mechanical characterisation of the lateral collateral ligament complex of the ankle at realistic sprain-like strain rates. Journal of the Mechanical Behavior of Biomedical Materials, 102(June 2019), 103473. https://doi.org/10.1016/j.jmbbm.2019.103473
- Skazalski, C., Kruczynski, J., Bahr, M. A., Bere, T., Whiteley, R., & Bahr, R. (2018). Landing-related ankle injuries do not occur in plantarflexion as once thought: A systematic video analysis of ankle injuries in world-class volleyball. British Journal of Sports Medicine, 52(2), 74–82. https://doi.org/10.1136/bjsports-2016-097155
- Willwacher, S., Fischer, K. M., Benker, R., Dill, S., & Brüggemann, G. (2013). Kinetics of cross-slope running. Journal of Biomechanics, 46(16), 2769–2777. https://doi.org/10.1016/j.jbiomech.2013.09.006
- Wright, I. C., Neptune, R. R., Van Den Bogert, A. J., & Nigg, B. M. (2000). The influence of foot positioning on ankle sprains. Journal of Biomechanics, 33(5), 513–519. https://doi.org/10.1016/S0021-9290(99)00218-3