
 ?Mathematical formulae have been encoded as MathML and are displayed in this HTML version using MathJax in order to improve their display. Uncheck the box to turn MathJax off. This feature requires Javascript. Click on a formula to zoom.
ABSTRACT
This paper presents challenges in the control of 5GDHC networks and proposes an approach for the robust control design of these networks. Temperatures are low and temperature differences are small in 5GDHC networks, in order to minimise heat losses in the distribution network and directly utilise low-temperature heat sources. Therefore, the robust control design of substations is crucial for stable and efficient operation of 5GDHC networks. We proposed the key steps to obtain a consistent control design that can be verified and tested prior to commissioning of the building substations and network. The design approach was elaborated in a case study in an existing neighbourhood in Haarlem, the Netherlands, constructed in the 1930s to 1970s. This neighbourhood will become independent of natural gas using PVT-rooftop panels, individual heat pumps (HP), a 2-pipe, bi-directional energy flow network operating at ultra-low temperatures and ATES system as a seasonal and daily storage facility.
Abbreviations
5GDHC: 5th generation District Heating Cooling, ATES: Aquifer Thermal Energy Storage; Net: Network; HP: Heat Pump; PVT: PhotoVoltaic Thermal Panels; DH: District Heating; DHN: District Heating Network; TPAN: Panel Temperature; Tn: Network Temperature; TS: Storage Temperature; TPVT: PhotoVoltaic Thermal Panel Outflow Temperature; DT: temperature difference; b: Half Degree; MV: Mixing tap-valve; LTDH: Low-Temperature District Heating; ULTDH: Ultra-Low-Temperature District Heating.
1. Introduction
District heating networks (DHN) have been used since the late nineteenth century, however, several major changes have happened. They accommodate the heat consumption decreasing due to improved buildings efficiency and a reduction of the environmental impact compared to boilers and heating systems at a local/building level.
Traditional district heating (DH) systems are centralised power stations that supply hot water or steam to pipes for further city heat distribution. High-temperature DH systems are characterised by high heat losses and maintenance costs. Therefore, the economic viability of traditional high-temperature DH infrastructures can be at risk with a decrease in heating demand due to the rate of renewal of the existing building stock (Prando et al. Citation2015). The 4th generation (Li and Wang Citation2014; Olsen et al. Citation2014) DHN can be divided into two categories following internationally accepted definitions, Low-Temperature DH (LTDH) with supply temperatures ranging between 50 and 70°C and Ultra-Low-Temperature DH (ULTDH) which has supply temperatures below 50°C (Averfalk et al. Citation2021). For ULTDH networks the water used for domestic hot water preparation has to be heated additionally by an electric booster or booster HP (Kiss and Ferreira Citation2016) to prevent legionella distribution. In (Jones et al. Citation2019) a 4th generation heating network on a community scale is discussed and designed based on component sizing. However, all these networks cannot yet be integrated with a district cooling system, even though the 4GDH was only recently developed, the introduction of the 5th generation DHC, 5GDHC (Lund et al. Citation2021; Pellegrini and Bianchini Citation2018) was made. Modern researches introduce how 4th (Li and Nord Citation2018) and 5th-generation DHC networks (Boesten et al. Citation2019) can utilise low-temperature heat sources which enable smart energy systems combined with low-energy buildings and networks with low grid losses. The 5GDHC has advantages in low-temperature resources integration, bi-directional operation and decentralised energy flows. 5GDHC system may include decentralised heat pumps (HPs), thermal storage in energy hubs and buildings, as well as pumps, chillers and electric boilers. If existing buildings are renovated with decentralised HPs and a 5GDHC network, then attention must be paid to the annual demand for heating and cooling if applicable. Another advantage of 5th generation is the possibility of combined heating and cooling via the same network.
A typical feature of 5GDHC is the presence of prosumers in these networks. Brange, Englund, and Lauenburg (Citation2016) showed multiple benefits of prosumers in LTDH in a Swedish case study. The ULTDH (5th Generation: ‘higher temperature line’ operates at maximum 50°C), further enhances the aforementioned advantages. Brand et al. (Citation2014) performed a simulation study with prosumers to assess their impact on temperatures, pressures and velocities in the distribution network. Lennermo, Lauenburg, and Werner (Citation2019) analysed different control concepts for decentralised solar district heating networks. They concluded that the return/supply connection must have a more advanced control strategy, due to the feed-in temperature requirement. Furthermore, Lennermo, Lauenburg, and Werner (Citation2019) stressed that the design of the control system is as important as the design of the substation. Buffa et al. (Citation2019) conclude that no technical standards or guidelines are available for designers and there is a lack of knowledge for 5GDHC operational optimisation and control (Buffa et al. Citation2019).
One of the challenges for the widespread use of 5GDHC networks is the development of robust and standardised control systems, because these control systems are complex due to the bi-directional power flows (Buffa et al. Citation2019) and small temperature differences, compared to earlier district heating generations. The modelling and stability of prosumer networks have recently gained attention from scientists with a mathematical background, addressing the temperature dynamics in prosumer networks (Alisic, Paré, and Sandberg Citation2019).
The purpose of this work is to present a new stepwise approach to robust control for 5GDHC networks with bidirectional power flows. The research focuses on the substation control design using the example of a 5GDHC consumer network with decentralised heat pumps, rooftop PVT panels and an aquifer thermal energy storage (ATES) system. Such types of application of 5GDHC networks can offer a sustainable solution for existing areas where no other energy sources are available and space availability for large-scale development of sustainable sources is limited.
2. Materials and methods
2.1. Methods
This section first summarises the design approach of the substation controls. The case study and mathematical model are detailed in the subsequent paragraphs. The modelling of the case study substations was performed using the validated WANDA software (Deltares Citation1992-Citation2023). We propose the following key steps for safe and energy-efficient operation of 5GDHC substations:
Starting point: The hydraulic design must be completed, including design of expansion vessels and a pressure transient analysis for emergency scenarios.
Active components: Identification of all active components that enable the control of the substation.
Substation states: Then define the possible substation ‘states’ as unique combinations of active component settings.
State transitions: Define all feasible transitions between the possible states.
Stability of substation states: The stability within each state is verified using control theory or simulation studies.
Verification of transitions: The most critical state transitions should be verified.
These steps are elaborated hereafter.
2.1.1. Starting point
In (Pothof and Karney Citation2012) a general hydraulic and control design framework for water distribution networks has been developed and extensively validated. Despite the obvious differences between distribution of drinking water and thermal energy (in a closed water loop), the methodological approach in (Pothof and Karney Citation2012) with respect to hydraulics and control design can be adopted for the design of district heating networks. The hydraulic design of 5GDHC and drinking water networks is determined by maximum and minimum incidental pressures. Measures to manage incidental pressures may include surge vessels or limitations to pump and valve ramp rates. These hydraulic design parameters affect the control design. Therefore, the hydraulic design must be completed with respect to emergency scenarios prior to the design of control systems. This starting point is applicable to drinking water and DH and DHC networks.
2.1.2. Active components
This step identifies the components in the thermal network that are activated in the operational control philosophy. A conventional substation includes valves to control the heat transfer for space heating respectively DHW preparation. Prosumer substations may include pumps and valves with specific purposes.
2.1.3. Substation states
The substation states are defined by combinations of active component settings such as a discrete setting (ON/OFF) or a setting to control a certain continuous variable, like a temperature difference or pressure. For a general prosumer substation, all possible states are listed in a logical order, e.g. from large net heating demand via no demand or balanced heating and cooling demand to large net cooling demand. Note that cooling demand in a 5GDHC network is identical to heat supply by the prosumer, if the heat is supplied to the warm line in the 5GDHC network.
2.1.4. State transitions
This step is the actual design of the control strategy. The state transitions are preferably summarised in a state-transition diagram. The conditions for a transition from state i to j are summarised on the directed edge (i,j). Such a graphical representation helps to identify all possible states and transitions in a logical coherence.
2.1.5. Stability of substation states
Alisic, Paré, and Sandberg (Citation2019) investigate the network temperatures and stability in different scenarios, and show the possibility to optimise the network temperature for minimal HP energy input. The results show that the energy can be temporarily stored in the network. Machado et al. (Citation2021) propose a novel adaptive controller for flow and storage volume regulation of a multi-producer DH system and present asymptotic stability of the overall DH system’s closed-loop dynamics.
The control parameters that guarantee local stability in the vicinity of operational states without transitions to other operational states can be derived from classical control theory. To the authors’ knowledge, the mathematical guarantees are not available across multiple operational states, because the set of equations that model the dynamic behaviour changes fundamentally at a state transition. Therefore, these state transitions need to be simulated to assess the transient behaviour and the acceptability of the integrated substation behaviour.
2.1.6. Verification of transitions
This step includes the identification of the extreme, but still realistic, transition scenarios. Definition of these transitions requires expert knowledge and ‘devils-advocate thinking’. Transitions during normal operations should never trigger emergency control actions, such as a pump stop triggered by a pressure violation. The normal operating transitions should maintain the pressure levels within the boundaries for normal operations. Three types of transitions should be considered:
Extreme variations: State transitions for substations include extreme variations in boundary conditions, such as an increasing heat demand during a morning peak. The control system should stabilise its control objective within a reasonable timespan.
Another category of transitions occurs at minimum operating conditions, such as at the minimum pump speed. At these conditions, the substation control may swap between multiple system states at a predefined acceptable frequency.
Finally, substations may affect neighbouring substations via the 5GHDC network, but these interactions should not result in oscillatory system dynamics in the network.
All transitions should be verified with integrated simulations, as illustrated in section 4. The type 1 and 2 transitions should be verified with simplified boundary conditions on the network side, such as constant pressure and temperature boundaries. Type 3 transitions can be verified after type 1 and 2 have been successfully verified. The network model with multiple, individually controlled substations should capture thermal transients between substations that propagate through the network at the convective velocity. Hydraulic transients propagate at the acoustic wave speed through the network, which is at least 2 orders of magnitude larger than the convective velocity. Hydraulic transients may affect the control stability at the network scale, but these transients can be ignored at the substation scale. Therefore, the hydraulic pipe model of the substation has been simplified to rigid columns with friction. The case study is detailed in section 2.2 and the mathematical model is summarised in section 2.3.
2.2. Case study description
The case study area is Ramplaankwartier neighbourhood in Haarlem, The Netherlands, dominated by terraced dwellings, constructed in the 1930s–1970s. The neighbourhood is dominated by private ownerships that are actively supporting novel approaches to decarbonise their thermal energy demand. The yearly thermal energy demand after renovation is reduced to 70 kWh/m2/yr for space heating on average and 3000 kWh/yr for domestic hot tap water (DHW), resulting in 10 MWh annual heat demand for the average dwelling. Every dwelling with a suitable rooftop orientation is equipped with PVT-panels, a water/water HP with DHW tank and circulation pumps on both sides of the substation heat exchanger ().
Figure 1. Dezonnet configuration.
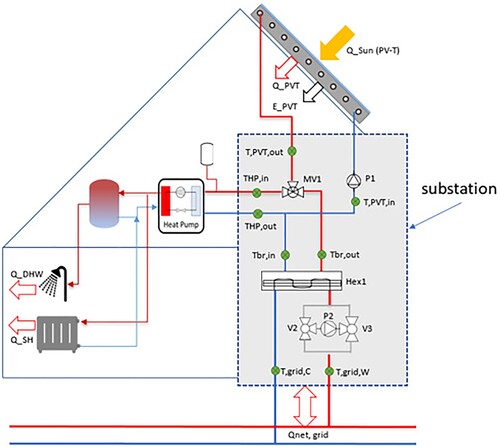
The individual house heat-pumps are boosting the temperature of the PVT and/or grid outlet. Representative yearly time series of expected thermal energy production depending on the house location, roof orientation and weather predictions are used. The network basically operates without centralised pressures differences between the warm and cold lines. The 5GDHC network does not include centralised circulation pumps, because each connected building with PVT panels is a prosumer with their own substation pump. The substation pumps are designed to create the necessary differential pressure during design conditions: high PVT production on a summer day. The substation circulation pump on the network side (label P2 in ) is installed in a Wheatstone bridge to enable heat demand from the network and heat supply from the PVT to the network. The design distribution temperatures are 18/11°C in summer and 14/7°C in winter. More information on the thermo-hydraulic design of this case study is available in (Loverdou, van der Zwan, and Pothof Citation2020).
The excess heat production in the summer is stored in a seasonal aquifer thermal energy storage (ATES), which is hydraulically separated from the 5GHDC network. The circulation pump at the ATES connection balances the pressure levels in the warm and cold lines, while supplying the net demand for heating or cooling from the ATES wells. The network pump in the substation (P2) controls the substation flow to reach the desired temperature difference of 7 K between the warm and cold distribution lines. The pipeline lengths inside the Ramplaankwartier dwellings are assumed as follows:
Pipelines between service line and substation, typically 7 m horizontal distance to cross gardens or pavement and 8 m inside the dwelling: 2 × 15 m (approximation for a 3-level terraced dwelling).
Length inside the PVT: 12 m (as reported from the PVT supplier).
Length towards and from the PVT: 2 × 1 m (inside the house connection).
Length towards and from HP: 2 × 1.5 m (inside the house connection).
For the definition of these lengths, it is being assumed that the substation with HP set-up will be installed in the attic where usually the boiler installation is typically installed in old Dutch houses predominantly found in the case-study area. The piping diameter is DN25 (internal diameter 20.4 mm) and the wall roughness 0.2 mm. The latter value is intentionally set on the high side to compensate for potential local-losses at piping bends and branches that are not included in this conceptual hydraulic model.
A counter-current plate heat exchanger (HEX1) is selected for this design to separate the distribution pipes from the rooftop PVT-pipes. The heat transfer coefficient and the hydraulic resistance factor are defined as per the specification documents and are respectively 2740 W/K and C: 22.8·106 m2/s5.
2.3. Mathematical model
The thermo-hydraulic model includes all pipe sections between the distribution pipes in the street and the rooftop PVT-panels, as outlined in the case study description (). The mathematical model of the pipes is governed by the mass balance, a momentum balance and energy equation. The mass balance assumes the fluid is incompressible and the pipes are rigid, as motivated above for this study. The momentum balance includes the fluid inertia and pipe friction. The energy equation models the convective heat transfer. The thermal losses in the piping connections of the substation have been neglected. Given that the lengths of the pipes are rather small, this assumption does not harm the overall conclusions of the substation design analysis. The numerical grid in the pipes is based on a design velocity of 1 m/s, a time step of 0.1 s and an element length of 0.1 m to satisfy the Courant–Friedrichs-Lewy (CFL) condition for transient velocities below 1 m/s. An upwind scheme with flux-limiters is used to minimise numerical diffusion.
Other thermo-hydraulic components include the evaporator side of the heat pump with a forced heat demand (kW) and circulation pump (HP), the PVT-panel with a forced heat supply (kW) and its own circulation pump (P1), a mixing valve (MV1) and the circulation pump (P2) on the grid side of the heat exchanger, fitted with 3-way valves to determine the direction of the energy flow (V2, V3). All circulation pumps must be variable speed pumps to meet all operational requirements (Nord et al. Citation2021).
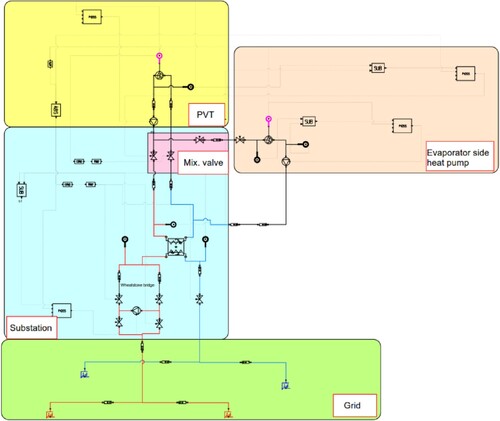
The case study substation has been modelled in WANDA (), developed by Deltares (Deltares Citation1992-Citation2023). WANDA is an advanced interactive software package that supports the thermo-hydraulic design of piping systems. This software is used for thermal and hydraulic analysis of steady and unsteady flows in pipeline networks of custom configurations. The WANDA Control module enables the integrated simulation of thermodynamics, hydraulics and control actions (https://warmingup-wanda-core.readthedocs-hosted.com/en/latest/). Openly available spatial data sets (GIS format) of the neighbourhood have been used as input to create a detailed pipeline network with geopandas library in Python (https://geopandas.org/). That was directly converted into a WANDA hydraulic model.
Figure 2. Substation hydraulic and control model (Wanda).
3. Stepwise approach to robust control strategy
We applied the stepwise approach to the case study substations. Step 1 on the hydraulic design was detailed in (Loverdou, van der Zwan, and Pothof Citation2020). The active substation components (Step 2) are summarised in .
Table 1. Overview of control setpoint values per operational mode.
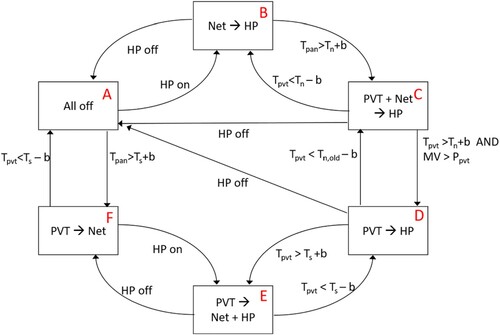
The different operational modes of the proposed substation architecture (Step 3) were summarised below:
All components are off. There is no energy demand from the house and no heat produced by the PVT. This state occurs for example during a summer night.
The DHN delivers energy to the heat-pump, the PVT is switched off (DHN -> HP). This state occurs for example during a cold winter evening.
PVT and DHN deliver energy to the heat-pump (PVT + DHN -> HP). This state occurs for example during a cold sunny winter day.
Stand-alone mode, no heat supplied or delivered to the DHN (PVT -> HP), a day in spring or fall.
PVT delivers energy to the net and the heat-pump (PVT -> DHN + HP), a day in spring or fall.
PVT delivers energy to the net, the HP is off (PVT -> DHN) day in summer.
Step 4 is the actual design of the operational control strategy, which defines the system states and feasible transitions. The state transition diagram is a useful, logical and consistent representation to identify and summarise all feasible transitions between operational states, as illustrated in .
Figure 3. State-transition diagram of the novel PVT-based 5GDHC substation.
The control philosophy and the setpoints for three pumps and the mixing taps are summarised in .
Step 5 (control parameters) was elaborated using classical methods. The control parameters guarantee local stability in the vicinity of operational states without transitions to other operational states.
The built-in control functionality of the WANDA software allows for the full control configuration to be designed and tested. The hydraulic and thermal response of the different control actions can be evaluated in an integrated model.
The general PI-equations with input signal X(t) and actuator signal Y(t), as used by WANDA, are the following:
(1)
(1)
(2)
(2)
(3)
(3) where parameters K and Ti denote the proportional gain and integration time constant respectively.
provides a summary of the PI parameters that are selected for the three substation pumps.
Table 2. Control setting of the three substation pumps.
For this substation design, PI (proportional & Integration) controllers have been manually tuned to ensure an accurate and fast response from all components in each state. PI controllers adjust the rotational speed of the three circulation pumps based on temperature sensors measuring the temperature values and the temperature differences (or exit temperature for the PVT). The PI controllers at the ATES circulation pumps maintain pressures in the warm and cold distribution lines; the design of the ATES pumps was not further addressed in this paper. contains the mixing tap parameters.
Table 3. Control settings of the mixing tap of the substation set.
Based on the control parameters the system response within each state should be verified. Furthermore, the system response for all feasible state transitions should be verified (Step 6). These integrated simulations of thermohydraulics and control actions provide a realistic insight in the actual dynamic behaviour. The acceptance criteria, e.g. setpoint deviations and duration of the deviation, determine whether the system and controls interact as designed. If necessary, the hardware or control strategy is modified until the results are considered acceptable. We present a selection of the state-transition verification simulations in the Results section hereafter.
4. Results
In order to illustrate the approach for step 6, four transition scenarios have been explained in more detail in this results section. These include the following state transitions: loss of PVT production (state C -> B); transition from PVT-deficit to stand-alone operation (state C -> D); PVT production excess with reducing heat demand (state E -> F) and transition from PVT-excess to stand-alone operation (state E -> D).
4.1. Loss of PVT production (C -> B)
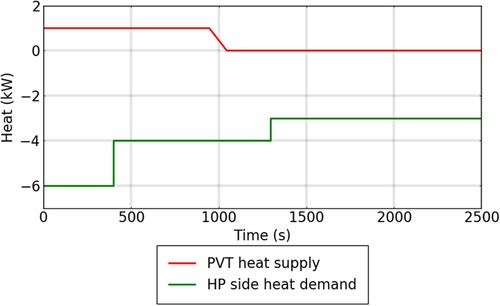
The model is initiated at state C where PVT is producing some energy but insufficient to cover the total demand of the house, therefore the energy deficit that is still needed from the house is covered by the grid. At some point in time, the production from the PVT is falling to zero and the total energy demand is now provided exclusively from the grid (mode B).
Changes in the demand time series can occur practically instantaneously, for example when the user is turning off/on the hot water supply. Therefore, the steps of the demand line are abrupt as shown in . On the contrary, the PVT production time series have more gradual changes. The changes of external air temperature or the sun radiation are finding place in time spans in the order of magnitude of minutes rather than seconds. For this analysis, it has been conservatively assumed that the production of the PVT is dropping at a maximum rate of 1 kW within approximately 1.5 min (100 s).
Figure 4. C →B: House heat demand in kW (bottom green line) and heat supply PVT (top red line).
The temperature difference along the HP inlet is shown in . The peaks coincide with the demand or supply changes. The pump speed is adjusted within approximately 200 s (approximately 3.3 min; ). This response is considered acceptable for the system performance.
Figure 5. C →B: Control setpoint for HP evaporator side. DT before and after the heat-pump is 7 K.
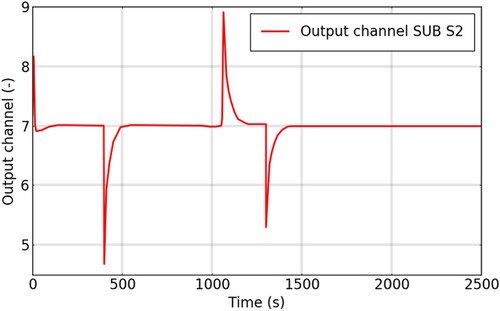
Figure 6. C → B: Pump rotational speed controlled (Top green line: network pump speed, bottom red line: HP inlet speed).
Within approximately 150 s from the moment that a demand/supply change takes place, the output signal reaches the preselected setpoint. The mixing tap is partly or completely open during the C operating phase.
4.2. Transition to stand-alone operation (C -> D)
The model is again initiated at mode C, but now shifting to stand-alone operation (state D). At the beginning of the simulation, a fraction of the house demand is covered by the production from the PVT panel and the rest is supplied from the grid. At some point in time, the total production of the PVT becomes equal to the total demand. Pumping from the network is not necessary anymore ().
Figure 7. C →D: Control signal for HP evaporator side. DT before and after heat-pump is 7 K.
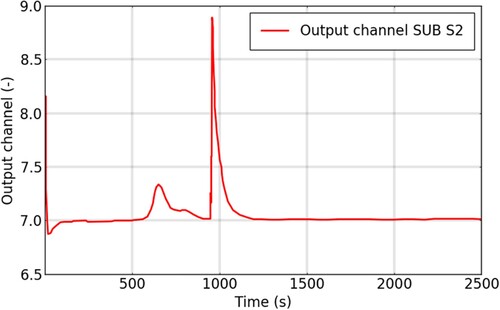
Figure 8. C →D: Pump rotational speed controlled (HP inlet side).
The valve of the mixing-tap left branch (from the network) is closing completely together with the network pump in the Wheatstone bridge, which is turning-off. Warm water is recirculating in the PVT/HP circuit in state D.
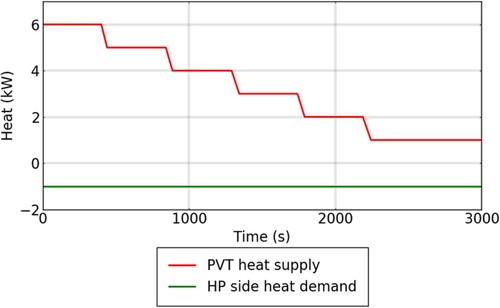
4.3. PVT production excess with reducing heat demand (E -> F)
The model is initiated at mode E where the production from the PVT is more than what is needed to fulfil the heat demands of the house (). This heating surplus, which declines over time in this scenario, is reinjected to the grid so that neighbouring houses can use it or so that it can be stored in the warm ATES in cases where there is not any uncovered demand in the network.
Figure 9. E →F: House heat demand in kW (bottom green line) and heat supply PVT (top red line).
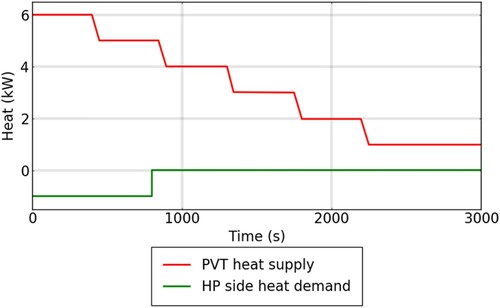
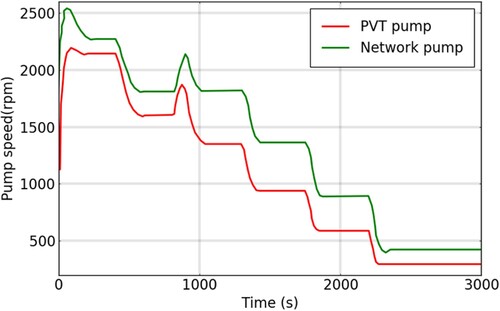
In state F, the branch of the mixing tap upstream of the HP outlet is turned off, because the house heat demand has stopped at 800 s. This event causes short-term excursions in the PVT outlet temperature (), the network differential temperature () and the pump speeds ().
Figure 10. E →F: Temperature at the outlet of PVT. Setpoint is adjusted at 20°C.
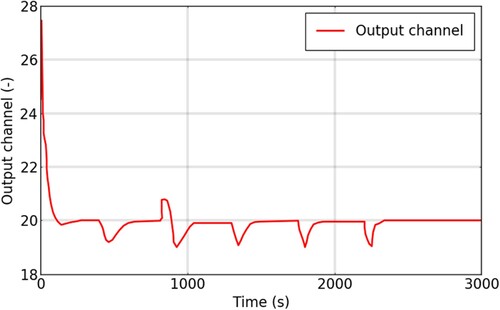
Figure 11. E → F: Temperature difference at the two network sides. Setpoint adjusted at DT = 7 K.
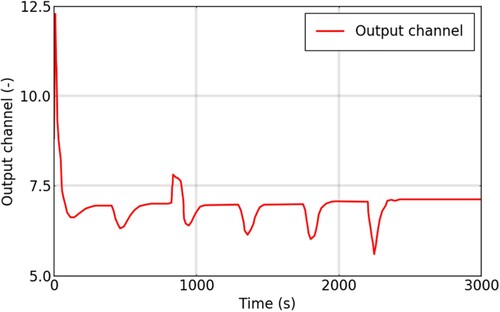
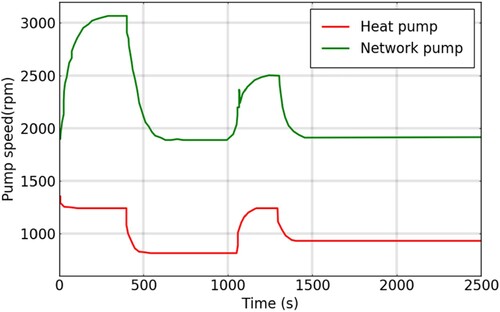
Figure 12. E →F: Pump rotational speed controlled (Top green line: the network pump speed and bottom red line: the PVT pump).
4.4. Transitions from PVT production excess to stand-alone operation (E -> D)
The model is initiated in state E. At some point, the PVT production declined and reached the heat demand by HP. At that point (around 2200 s) the surplus of the heat production is becoming zero and the system is operating in stand-alone operation (D mode) ().
Figure 13. E →D: House heat demand in W (bottom green line) and heat supply PVT (top red line).
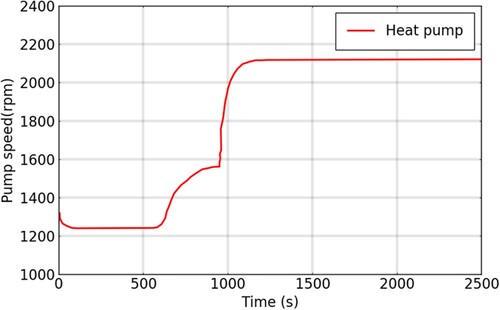
Both network and PVT pumps are turned off and the house pump is turned on. The valves at the Wheatstone bridge are closing. The pump at the HP evaporator is slowly ramping up starting from 1400 s when the supplied heat is 3 kW. After that point, it is further ramping up in steps. At 2200 s when the system is passing to stage D, both network and PVT pumps are closed, whilst the pump of the HP evaporator is operating at its maximum speed ( and ).
Figure 14. E → D: Pump rotational speed controlled (Top blue line: PVT pump, middle red line: HP evaporator, botom green line: network pump).
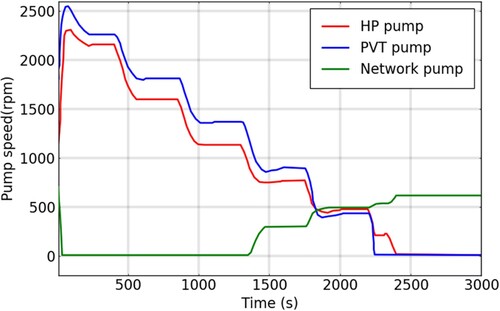
Figure 15. E → D: Control variable for network (top green line) and evaporator (bottom red line). DT before and after HP is 7 K.
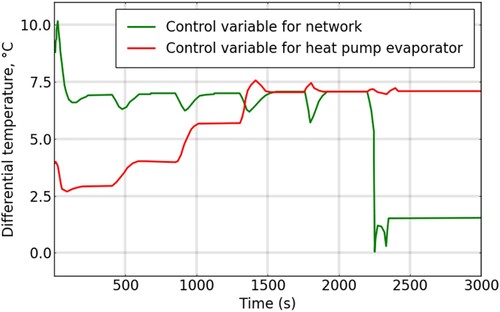
Initially, the PVT excess production is large such that the PVT pump provides enough pressure to meet the HP demand. Therefore, the temperature difference in the HP evaporator is smaller than 7 K. From the moment the HP evaporator pump is turned on, the temperature difference on the evaporator side evolves to the setpoint value of 7 K.
5. Discussion
In this study we have proposed a design approach for 5GDHC control systems. This approach was illustrated in a case study of a novel prosumer substation. The system boundaries for the substation were chosen in the distribution lines with fixed pressure and temperature boundaries. In reality, the network pressures and temperatures will vary due to variable operations of nearby substations and the pressure control system at the collective ATES. If a substation starts producing heat, it lifts the local pressure in the warm line. Adjacent substations, demanding heat, should respond to this change in network pressure level with a reduction in their pump speeds. These network interactions should be verified in a similar way. In order to assess the short-term stability of the control actions by multiple substations and the ATES system, it remains to be verified whether the hydraulic transients can still be ignored at the network scale. If the pressure variations in the network are dominated by the expansion vessels, then it might be feasible to avoid the explicit simulation of hydraulic transients. If hydraulic transients cannot be ignored, then the correct simulation of temperature transients (typical velocity 1 m/s), and hydraulic transients (typical acoustic velocity 200 m/s for PE up to 1000 m/s for steel pipes) is challenging due to the numerical diffusion in the temperature dynamics.
The proposed control design approach should be applied to the ATES as well in order to assess the stability of the pressure levels in the warm and cold lines; the same reflection on hydraulic transients applies.
6. Conclusion
The proposed substation architecture allows an in-place consumption of the produced heat as much as possible. In comparison to a typical individual system, it increases the total efficiency at the neighbourhood level since the produced energy can be shared by different users. The proposed control design approach has been applied to an innovative 5GDHC substation in the Netherlands. The integrated simulations, including hydro-thermal behaviour and control actions reveal the system response for critical state transitions. This control design approach is essential to guarantee a safe and energy-efficient operation.
The results of the control philosophy and manual tuning are generic and thus can also be used as a starting point in similar installations. The selected control parameter values presented in and 3 result in a response time in the order of 3–4 min. This is considered an acceptable response time for a user, even for the domestic hot water needs, because this response time refers to the filling of the hot water tank by the HP.
The proposed control approach to design safe and efficient low-level control systems in 5GDHC grids is a necessary precondition for the development of advanced (high-level) control strategies.
Advanced control strategies based on optimisation algorithms, such as model-predictive control, cell balancing, peak-shaving as well as market integration methods are currently being developed in different national and European projects (e.g. https://www.warmingup.info/over-warming-up). Applying advanced control methodologies in prosumer networks could further improve efficiency and reduce costs facilitating eventually the scaling-up of this technology.
Disclosure statement
No potential conflict of interest was reported by the author(s).
Additional information
Funding
References
- Alisic, R., P. E. Paré, and H. Sandberg. 2019. “Modeling and Stability of Prosumer Heat Networks.” IFAC-PapersOnLine 52 (20): 235–240. https://doi.org/10.1016/j.ifacol.2019.12.164
- Averfalk, H., T. Benakopoulos, I. Best, F. Dammel, C. Engel, R. Geyer, O. Gudmundsson, K. Lygnerud, N. Nord, J. Oltmanns, et al. 2021. “Low-Temperature District Heating Implementation Guidebook: Final Report of IEA DHC Annex TS2 Implementation of Low-Temperature District Heating Systems.”
- Boesten, S., W. Ivens, S. C. Dekker, and H. Eijdems. 2019. “5th Generation District Heating and Cooling Systems as a Solution for Renewable Urban Thermal Energy Supply.” Advances in Geosciences 49: 129–136. https://doi.org/10.5194/adgeo-49-129-2019
- Brand, L., A. Calvén, J. Englund, H. Landersjö, and P. Lauenburg. 2014. “Smart District Heating Networks – A Simulation Study of Prosumers’ Impact on Technical Parameters in Distribution Networks.” Applied Energy 129: 39–48. https://doi.org/10.1016/j.apenergy.2014.04.079
- Brange, L., J. Englund, and P. Lauenburg. 2016. “Prosumers in District Heating Networks – A Swedish Case Study.” Applied Energy 164: 492–500. https://doi.org/10.1016/j.apenergy.2015.12.020
- Buffa, S., M. Cozzini, M. D’antoni, M. Baratieri, and R. Fedrizzi. 2019. “5th Generation District Heating and Cooling Systems: A Review of Existing Cases in Europe.” Renewable and Sustainable Energy Reviews 104: 504–522. https://doi.org/10.1016/j.rser.2018.12.059
- Deltares. 1992-2023. WANDA Software. https://www.deltares.nl/en/software-and-data/products/wanda-software.
- Jones, S. R., M. Gillott, R. Boukhanouf, G. Walker, M. Tunzi, D. Tetlow, L. Rodrigues, and M. Sumner. 2019. “A System Design for Distributed Energy Generation in Low-Temperature District Heating (LTDH) Networks.” Future Cities and Environment 5 (1). https://doi.org/10.5334/fce.44
- Kiss, A. A., and C. A. I. Ferreira. 2016. Heat Pumps in Chemical Process Industry. CRC Press.
- Lennermo, G., P. Lauenburg, and S. Werner. 2019. “Control of Decentralised Solar District Heating.” Solar Energy 179: 307–315. https://doi.org/10.1016/j.solener.2018.12.080
- Li, H., and N. Nord. 2018. “Transition to the 4th Generation District Heating-300 Possibilities, Bottlenecks, and Challenges.” Energy Procedia 149: 483–498. https://doi.org/10.1016/j.egypro.2018.08.213
- Li, H., and S. J. Wang. 2014. “Challenges in Smart Low-Temperature District Heating Development.” Energy Procedia 61. https://doi.org/10.1016/j.egypro.2014.12.150.
- Loverdou, L., S. van der Zwan, and I. Pothof. 2020. “Memo Basic Design Ramplaankwartier”, DEZonnet report. https://dezonnet.nl/wp-content/uploads/2022/03/11203199-000-hye-0001_v0.2-memo-ramplaankwartier_finaldraft.pdf.
- Lund, H., P. A. Østergaard, T. B. Nielsen, S. Werner, J. E. Thorsen, O. Gudmundsson, A. Arabkoohsar, and B. V. Mathiesen. 2021. “Perspectives on Fourth and Fifth Generation District Heating.” Energy 227: 120520. https://doi.org/10.1016/j.energy.2021.120520
- Machado, J. E., M. Cucuzzella, N. Pronk, and J. M. Scherpen. 2021. “Adaptive Control for Flow and Volume Regulation in Multi-producer District Heating Systems.” IEEE Control Systems Letters 6 (2021): 794–799.
- Nord, N., M. Shakerin, T. Tereshchenko, V. Verda, and R. Borchiellini. 2021. “Data Informed Physical Models for District Heating Grids with Distributed Heat Sources to Understand Thermal and Hydraulic Aspects.” Energy 222: 119965. https://doi.org/10.1016/j.energy.2021.119965
- Olsen, P., C. Christiansen, M. Hofmeister, S. Svendsen, J. Thorsen, and O. Gudmundsson. 2014. “Guidelines for Low-Temperature District Heating. EUDP 2010-II: Full-Scale Demonstration of Low-Temperature District Heating in Existing Buildings.”
- Pellegrini, M., and A. Bianchini. 2018. “The Innovative Concept of Cold District Heating Networks: A Literature Review.” Energies 11 (1): 236–325. https://doi.org/10.3390/en11010236
- Pothof, I., and B. Karney. 2012. “Guidelines for Transient Analysis in Water Transmission and Distribution Systems.” https://doi.org/10.5772/53944.
- Prando, D., A. Prada, F. Ochs, A. Gasparella, and M. Baratieri. 2015. “Analysis of the Energy and Economic Impact of Cost-optimal Buildings Refurbishment on District Heating Systems.” Science and Technology for the Built Environment 21 (6): 876–891. https://doi.org/10.1080/23744731.2015.1040343