
ABSTRACT
Protecting soils during forest operations is important, especially soils with limited bearing capacity that are being harvested during the wet months. These soils can sustain damage to their structure, and therefore site productivity can be reduced. Climate change may change weather patterns, and less frozen soil conditions will occur more frequently, forcing planners to search for alternatives to overcome this challenge. In this context, cable-based systems for tree yarding are one option to reduce potential damage to soils and remaining stands. Time studies were performed on three cable yarding operations in the canton of Aargau, Switzerland, aiming to understand the performance of cable-based systems in flat terrain. A statistical analysis was performed, and costs were calculated. The yarding productivity was 13.92–21.86 cubic meters over bark (m3ob) per productive machine hour. The payload was identified as the main variable significantly influencing the productivity of a yarding cycle. Overall, installation procedures of the yarder were the most time-consuming and expensive work step. Production costs were 70–102 CHF m3ob−1 (corresponding to 73–107 € m3ob−1), including felling, yarding and roadside processing. This study confirms that the costs resulting from cable-based operations in flat terrain are high and the approach is not (yet) competitive with ground-based systems.
Introduction
Traditionally, cable-based (yarding) systems are applied in steep terrain where ground-based systems cannot operate (Heinimann et al. Citation2001; Böhm and Kanzian Citation2023). However, due to climate change, wet soils with low bearing capacity are occurring more frequently because frozen soil conditions are getting rare, forcing actors to search for alternatives to ground-based systems to avoid soil disturbances such as compaction or rutting (Cambi et al. Citation2015; Abbas et al. Citation2018; Erber and Spinelli Citation2020). Depending on the slope and terrain conditions, the recent further development of ground-based winch-assisted systems might be a “robust, safe, and high-performance alternative” (Holzfeind et al. Citation2020) to conventional ground-based systems (Visser and Stampfer Citation2015; Holzfeind et al. Citation2018; Haas et al. Citation2020; Schönauer et al. Citation2021; Visser and Spinelli Citation2023).
There is consensus that damage to the remaining stands and impacts on soil properties can ultimately be minimized by applying cable-based systems in all terrain types. Accordingly, forest planners are increasingly being asked to use yarders in flat sensitive terrain (Erber and Spinelli Citation2020; Schweier and Ludowicy Citation2020). A survey by Erber and Spinelli (Citation2020) showed that cable yarding in flat and wet terrain is a relevant topic in Central Europe, which seems reasonable given the above-mentioned arguments. Thus, cable-based systems might be used as an alternative to ground-based systems on flat terrain. However, it is not clear whether the productivity of cable yarders in flat terrain differs from what is known about their performance in their normal range of sites, e.g., due to longer installation times because more intermediate supports are needed (Erber and Spinelli Citation2020).
Generally, cable yarding is not considered cost-competitive where ground-based systems can be employed (Erber and Spinelli Citation2020; Pucher et al. Citation2023), unless the operation is subsidized. This means that it is particularly important for the operative planning of such a flat-terrain yarding operation to pre-estimate its performance. So far, however, there have been only a few studies focused on the productivity of cable yarders applied in the horizontal yarding direction. Some figures have been obtained through case studies (Schweier et al. Citation2020, Citation2023; Schweier and Ludowicy Citation2020), but we argue that more individual cases need to be collected to learn from experiences, counter-balance peculiarities, and generate a broader data basis. Here, we accompanied three cable yarding operations in flat terrain by time studies to better understand the productivity and cost of cable yarding in this unconventional situation. The specific objectives of this study were:
to analyze the productivity of the yarding processes and identify variables that have a significant influence on productivity;
to develop a productivity model for predictive use that can be used to estimate the productivity of comparable yarding operations before their implementation;
to investigate the installation times of cable yarders, which contribute significantly to the total costs;
to estimate the resulting production costs, also with regard to ground-based systems.
Materials and methods
Motivation and framework
At the start of this decade, the Swiss canton of Aargau was considering partially subsidizing forest operations that take additional soil protection measures in areas with sensitive soils. The intent was to reimburse the additional costs of cable yarding compared with ground-based operations. In 2022 and 2023, three operations were conducted in the communities of Muri (M), Unterlunkhofen (U) and Berikon (B), all located in the canton (, ), to address our research questions and develop recommendations for the cantonal authorities.
Figure 1. Position, length and inclination of the cable corridors at the three study sites (top); locations of the study sites in the Swiss canton of Aargau (bottom, left); and location of the study sites within Switzerland (bottom, right). Reproduced with permission from Swisstopo (JA100118).
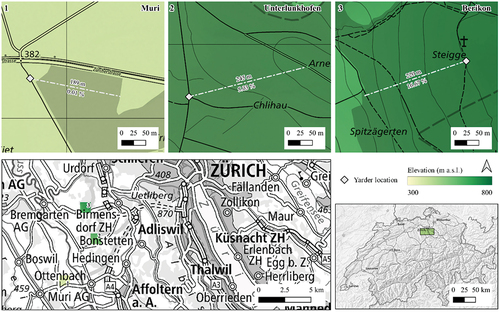
Table 1. Overview of the three study sites in the Swiss canton of Aargau.
Study sites
The terrain is wet and flat in all the study sites, with an average inclination of the cable corridor of 0–17%. There are no major obstacles, and the terrain can be considered easy for forestry operations but sensitive to traffic. Thus, cable yarding systems were selected for soil protection reasons. gives a more detailed overview of the three study sites and describes their individual peculiarities, which led to the decision to operate a cable-based system instead of a ground-based one.
Table 2. Overview of the peculiarities of each study site.
Forest classification
According to the phytosociological map of the canton (Aargauisches Geographisches Informationssystem, AGIS 2023), the study site areas are Ulmo-Fraxinetum listeretosum (two-leaf mixed ash forest on alluvial soils) in M and vigorous beech forest (mainly Galio odorati-Fagetum (woodruff – beech forest) with different characteristics) in U and B. The forest communities are characterized by a natural predominance of deciduous tree species, mainly ash (Fraxinus excelsior L.) in M and beech (Fagus sylvatica L.) in U and B, followed by oak (Quercus sp. L.) and sycamore maple (Acer pseudoplatanus L.). The proportion of hardwoods is especially low in B, at 10–30%, and much lower than what is recommended (70%). The proportion of hardwoods is within the recommended range in M and slightly lower in U. The coniferous component consists mainly of spruce (Picea abies (L.) H. Karst.) and silver fir (Abies alba Mill.) in all three areas.
Forest operations applied
Each operation was planned by the local foresters and pre-discussed with the contractors who were to carry out the yarding. In some cases, the contractors conducted only the yarding, whilst the felling and/or processing was conducted by the workforce of the forest enterprise. Motor-manual felling with the whole-tree system (Kellogg et al. Citation1993) was carried out by experienced workers before the yarder was installed. However, in M and U, the tree-length system (Kellogg et al. Citation1993) was applied often, i.e., many trees were cut into sections before yarding, to minimize soil disturbances. Anchor trees, tail trees and intermediate supports (one in all cases) were identified beforehand by the yarding contractor and the local forester. and provide more information about the specifications of the yarders and the overall forest operations, and images of the operations are given in .
Figure 2. Installation of the mobile cable-based system with a Koller tower yarder at the Muri (M) study site.
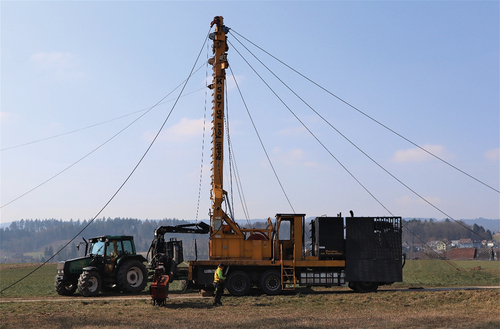
Table 3. Specifications of the cable-based extraction machines K507 and Mounty 40–3.
Table 4. Overview of the forest operations conducted in the three study sites.
Figure 3. Mobile cable-based system with a Konrad tower yarder at the Unterlunkhofen (U) study site.
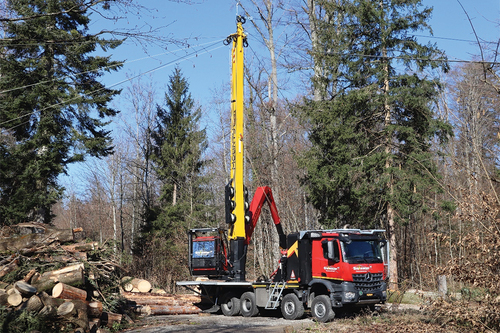
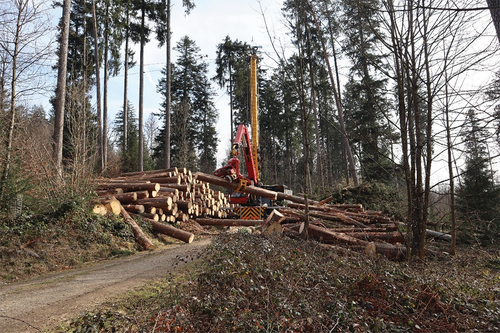
Figure 4. Mobile cable-based system with a Konrad tower yarder at the Berikon (B) study site.
In study site M, two workers of the contractor were in action. One was in the stand and attached the trees to the spooled-out mainline using choker slings. Trees were cut into sections if they were too large in diameter or length. The second worker operated the cable yarder and manually released the chokers. The machine operator was not working at 100% capacity, as the timber was not processed by him. Instead, one to two workers of the state forest cut the full trees into sections and delimbed and processed them at a landing, if necessary. Fuelwood was piled without further processing.
In the sites U and B, two workers of the contractor extracted trees or tree sections from the forest road, where the trees were picked up by the processor. One worker operated the machine, and one was in the stand and attached the trees to the choker. The trees and tree sections were immediately processed by the machine operator, i.e., delimbed, measured, cut-to-length and then piled. It was not the same team every day, and not all workers had the same level of experience.
Data collection
The yarding operations were accompanied by a team of two researchers conducting a time and motion study. Both were equipped with a chronometer and took notes by hand on paper. A walkie-talkie was used for communication. One researcher observed the processor and carriage at the forest road, while the other observed the forest worker attaching the trees and tree sections at the choker in the forest stand. One yarding cycle was defined as the period from the moment when the carriage started moving from the tower yarder processor until the point when it started moving for the next time. One processing cycle was defined as the period from the moment when the boom with grapple started to move (to take tree sections from the carriage) until the point when the next carriage arrived at the tower yarder processor and the boom with grapple started to move again. Processing work cycles were split into processing and delay times. All variables needed to assess productivity () were measured. Even though lateral yarding is included in productive yarding, its time requirement was assessed separately to analyze its influence on the overall productivity. In doing so, the lateral yarding distance per tree was noted. The respective distances were measured manually between felling and the yarding operation. The terrain difficulty during lateral yarding (low, medium or high) was visually evaluated based on the researchers’ personal experience, considering microtopography, regeneration/ground cover, stand density, block overlays and slope gradient. Regarding biomass volumes, the machine operators read the values in the display of the board computers () and reported them for each work cycle via radio. Additionally, a full forest inventory was done by the researchers before the operation to double-check the biomass volumes.
Table 5. Analyzed predictors of productivity response variables.
Production costs
Effective production costs were reported by the involved parties but were not used for the calculations here, to assure anonymity of the collaborators. Instead, costs were calculated using standard cost rates provided by the Swiss forest owner association (WaldSchweiz Citation2023). One Swiss Franc corresponds to 1.04 Euro and 1.17 US Dollar (27 July 2023).
Determination of productivity
The following operation times were recorded for each cycle.
Yarding
Productive yarding time (yard_prod_t): one cycle starts when the carriage starts moving away from the tower yarder processor, and it ends when the carriage returns to the tower yarder processor and stops moving. Lateral yarding time and delays of up to 15 min are included.
Yarding waiting time (yard_wait_t): begins when the carriage stops at the tower yarder processor and ends when the carriage starts moving away from the tower yarder processor.
Total yarding time (yard_tot_t): is the sum of the productive yarding time and the yarding waiting time.
Lateral yarding time (latyard_t): begins when the carriage coming from the tower yarder processor stops and ends when trees and tree sections are in the skyline corridor and the carriage starts moving toward the tower yarder processor.
Moreover, the time required for installation procedures was recorded, i.e., the hours spent and the number of workers involved in setting up and dismantling the cable yarder.
Processing
Productive processing time (proc_prod_t): processing time, without delays.
Total processing time 15 (proc_prod_15_t): processing time, including delays of up to 15 min.
Machine productivity was defined as the volume (cubic meters over bark, m3 ob) extracted per productive machine hour (PMH15), including delays of up to 15 min. Recorded cycles associated with non-working times (e. g. disturbances >15 min) and supportive working times (e.g., repair and maintenance) or incomplete cycles were not considered (IUFRO Citation1995; Magagnotti et al. Citation2013), resulting in a total of N = 367 cycles.
shows the productivity response variables that were derived for model building. Analyses were conducted to determine if the predictors had a significant impact on the response variables (), thus explaining productivity.
Table 6. Productivity response variables expressed as cubic meters over bark extracted per productive machine hour (m3 ob PMH15−1.).
Statistical analysis of yarding productivity
In study sites U and B, the identical yarding machinery was used by the same contractor; we therefore separated the evaluation of the yarding productivity at study site M from that at sites U and B (designated as UB below). Moreover, we excluded the processing step because it was not conducted by the operator at study site M but by the staff of the state forest. This decision was not based on technical reasons, but on the capacity of the employees.
Data cleaning
The first step of the statistical analysis of the yarding productivity consisted of creating a cleaned dataset. Cycles with incomplete data, yarding distance = 0, without a load or without a yarding or processing time were removed. Then, all cycles with delays longer than 15 min were removed, as well as cycles with interruptions due to individual reasons, such as visitors or meetings with the media. This resulted in reductions from N = 130 to N = 126 (M) and from N = 280 to N = 241 (UB) remaining cycles (for yarding and lateral yarding productivity).
Furthermore, in UB, felling work was carried out during the yarding in six cycles. The carriage was used as a felling support, and it was not possible to yard during this time. This interruption time was recorded as a delay. The cycles were kept (not removed), but the interruption time was subtracted from the total and the productive yarding times.
A particularity that occurred in UB was a partial “jam” in processing. One of the three machine operators was operating this machine for the first time. He was slow and could not process all the trees within one cycle. Later, the experienced operators took over and cleared this jam. The data records in which the jam was created or cleared were removed, with N = 142 cycles from UB remaining for statistical modeling for the processing productivity (does not apply for yarding or lateral yarding productivity).
The number of observations included for each model is summarized in .
Table 7. Model overview with response variable, predictors and key properties. The models are written in the following way in R (example for #1UB): log(yard_tot_prod) ~ latyard_dist + latyard_diff + log(yard_dist) + log(avrg_piece_volume) + log(payload). The following significance codes apply: “***” = 0–0.001;“**” = 0.001–0.01;“*” = 0.01–0.05; “.” = 0.05–0.1; “()” = 0.1–1.
Model selection and assessment
The procedure of model selection and assessment was the same as described in detail in a previous publication (Schweier et al. Citation2023). In short, ordinary least squares (OLS) regression models were used to estimate productivity. Next, the models were fit by performing variable selection based on the Akaike information criterion (AIC; Akaike Citation2011). Finally, the models were assessed using root mean square error (RMSE) from leave-one-out cross-validation (LOOCV).
Fitting of productivity models
Productivity models were fitted for the following processes (see for a complete overview): [I] the total productivity of a complete cycle (yard_tot_prod), [II] the yarding productivity (yard_prod_prod), [III] the processing productivity (proc_prod_prod), and [IV] the lateral yarding productivity (latyard_prod). The influence of study site on productivity was evaluated by introducing study site as a categorical variable (M, U, B). As no difference was detected between U and B, these sites were merged as the site “UB”. Models were also fitted for study site M and for all study sites together (All: U & B & M). For all study sites, models were fitted without labor influence, only for UB models including labor influence were fit by including the person responsible for carriage loading (resp_pers_latyard) or the machine operator as a predictor (resp_person_yard_proc) (in case of models including both machine operator and yarding team as predictors they were not fitted because these predictors were highly correlated). In study site M, the workers on the cable yarder and in the field were always the same and there was no change between the yarding operator and the field team, so no model with labor influence was fitted for study site M.
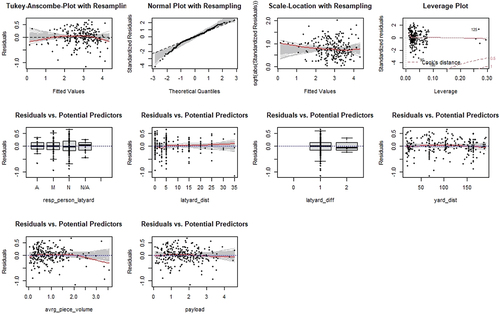
All models were generated with a log-transformed response variable and mainly also with log-transformed predictors (yard_dist. avrg_piece_volume, payload). Models with untransformed response and predictor variables showed significant problems in the model diagnostics (residual plots, in the Appendix).
Results
Distribution of total time
The total time (TT) of the overall operation from forest to road site at the study sites included felling, installation procedures, yarding and processing and was between 88.5 h and 226.25 h (). In site M, felling was the most time-consuming task (41.3% of TT), followed by yarder installation procedures (27.5% of TT), while yarder installation procedures clearly took the most time in site U (60.5% of TT). In site B, yarding was the most time-consuming task (42.7% of TT). More details are given in ; the machines and equipment used are listed in and .
Table 8. Distribution of the total time (TT) of the forest operation by study site expressed as absolute values (h) and relative amounts (%).
Productivity and production costs
The overall productivity was 21.86 m3ob PMH15−1 (M), 13.92 m3ob PMH15−1 (U), and 15.05 m3ob PMH15−1 (B). Results per cycle are shown in . Terrain difficulty was evaluated as “low” 99% of the time in M and B, and 90% of the time in U. Difficulty in the remaining time was considered to be “medium.” Total production costs were 12,470–30,050 CHF at roadside, corresponding to 13,065–31,484 € (more details are provided in in the Appendix).
Table 9. Overview of average yarding time, payload, pieces and lateral yarding distance per cycle.
On a relative basis, costs at roadside were 69.84–102.14 CHF m3ob−1 (), corresponding to 73.24–107.11 € m3ob−1. The most expensive step was the installation procedures of the cable yarder, at 22.48–49.41 CHF m3ob−1, corresponding to 29.9–59.4% of the costs per cubic meter, followed by felling and piling ().
Table 10. Costs (CHF m3ob−1) at roadside for each study site.
Productivity
Total productivity
In models #1–#3, the predictors latyard_dist + latyard_diff + yard_dist + avrg_piece_volume + payload were identified as significant. In model #2, the machine operator was not identified as a significant variable, while in model #3, the lateral yarding team was significant. All models performed quite well, with an adjusted R-squared between 0.85 and 0.92 and a LOOCV RMSE between 25% and 31%.
To demonstrate the effect of the individual predictors on productivity, a model effect plot was created. To visualize the effect of a particular predictor, the value for that predictor was varied, whereas all other predictors were fixed at their mean values. The model effect plot for model #3, which looks quite similar to those for models #1 & #2, is shown in . The plot shows that payload played a major role in determining the productivity of a complete cycle.
Figure 5. Model effect plots for model #3UB, with the productivity of a complete cycle (yard_tot_prod) as the response variable and the person (resp_person_latyard) attaching the trees/tree sections to the choker, lateral yarding distance (latyard_dist), lateral yarding difficulty (latyard_diff), yarding distance (yard_dist), average piece volume (avrg_piece_volume) and payload (payload) as a predictor.
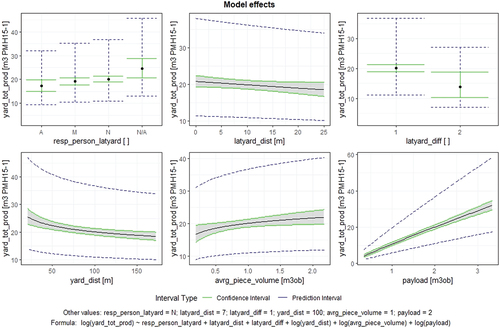
The study site influenced the total productivity, although only a weak effect was detected (p = 0.07), namely that M was more productive than UB.
Yarding productivity
Models (#4 & #5) included latyard_dist + latyard_diff + yard_dist + avrg_piece_volume + payload as significant predictors, but the study site was not identified as a significant predictor. Model #5UB further indicated that the predictor ’resp_person_latyard’ had a significant influence on yarding productivity. The model performance was quite good, with adjusted R-squared values between 0.85 and 0.92, and a LOOCV RMSE between 25% and 36%. Model effects were similar to those for the predictor yard_tot_prod. Therefore, we do not present the corresponding model effect plot.
Processing productivity
Two models were fitted for processor productivity: model #6 included avrg_piece_volume + payload as predictors, whereas model #7 additionally included the machine operator as a predictor (resp_person_yard_proc). The effect plot of model #7 indicates that the payload, the average piece volume, and the operator had large influences on processing productivity ().
Figure 6. Model effect plot for model #7UB, with productive processing productivity (proc_prod_prod) as the response variable and payload (payload), average piece volume (avrg_piece_volume), and machine operator as predictors (resp_pers_yard_proc).
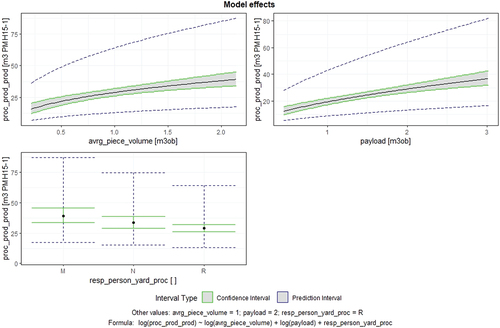
The model results show that machine operator M, who was the most experienced operator, performed significantly better than the other operators N and R. Compared with the models describing the yarding productivity, the models for processing were less accurate, with an LOOCV RMSE between 45.1% and 47.0%.
Lateral yarding productivity
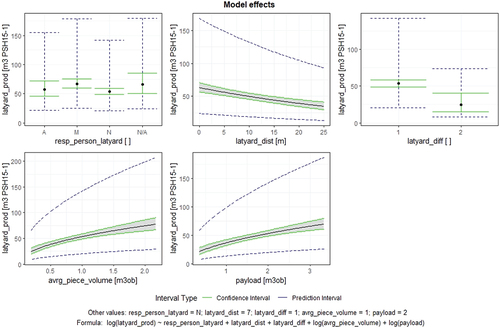
Two models were fitted to analyze lateral yarding productivity. Model #8 (UB, M & All) included the predictors latyard_dist + latyard_diff + avrg_piece_volume + payload as significant variables. Model #9 further included a variable for the person responsible for carriage loading (resp_pers_latyard), in which workforce personnel M performed slightly better than the others (non-significant difference, p = 0.19). The model effect plot for model #9UB is displayed in . As for the “yarding productivity” process, study site (M, U or B) was not identified as a significant predictor.
Figure 7. Model effect plot for model #9UB, with lateral yarding productivity (latyard_prod) as the response variable and the person responsible for carriage loading (resp_person_latyard), lateral yarding distance (latyard_dist), lateral yarding difficulty (latyard_diff), average piece volume (avrg_piece_volume) and payload (payload) as a predictor.
Models for predictive use
lists all the models that were evaluated. For each response variable, we selected the model that we recommend for predictive use ( and final column in ). These selected models do not include a variable for the responsible workforce, as this information is difficult to gather in practice. For total productivity, we recommend #1UB, as this model represents the systems which integrate yarding and processing with the tower yarder processor, whereas in model #1M (and #1All) the processing was done (partially) externally. For yarding productivity, we recommend #4All, as this model contains the largest set of cycles. The same applies for lateral yarding productivity, where we recommend model #8All. For processing, we recommend model #6UB as this model has no labor influence.
Table 11. Overview of model formulae recommended for predictive use, including the model coefficients. Variables are defined in .
Discussion
Installation times
The installation procedure times measured in our study are long. A smaller time requirement was reported in south-west Germany, where 133 labor-hours were required for the installation of 10 cable corridors in the horizontal yarding direction with a length of 270 m on average (Schweier and Ludowicy Citation2020). In another study, in which slope and terrain conditions were comparable to the ones of the present study, the time requirement for installation was 136 labor-hours for two cable lines with a length of 515 m and 590 m (Schweier et al. Citation2023). Stampfer et al. (Citation2006) studied the yarder installation times for a total sample size of 155 for uphill and downhill yarding. They mentioned the large number of key factors, such as corridor length, terrain, extraction direction, number of supports used and yarder type, which influence individual yarder installation times. The average time for one installation was 18 labor-hours for setting up and 8 labor-hours for dismantling (Stampfer et al. Citation2006). This is much shorter than the times we report here (53.5–67.5 labor-hours). Due to the numerous significant variables mentioned above, it is difficult to compare values with each other. One can expect that fewer intermediate supports are required in steep terrain, although in our case, one intermediate support was sufficient for 198–298 m corridors in flat terrain. Instead, all sites had some special characteristics (damaged wood, bordering a well-frequented road, missing anchor trees requiring deadman anchors), which seemed to prolong the installation times.
Productivity
The total yarding productivity was 13.92–21.86 m3ob PMH15−1. There was no significant difference between U and B. However, in comparison with M, the productivity was slightly lower in U and B. The higher productivity in M can probably be explained by the fact that the processing and piling were not conducted by the contractor who yarded but by the state forest enterprise. Thus, the yarder had no waiting times and fully concentrated on yarding. Moreover, this operation was carried out in a small clearcut of the site, and there were relatively large timber volumes in the small area – which also explains the large share of working time distributed to felling. The impact of the different workers conducting the yarding or attaching the trees/tree sections to the choker was not significant, but there were differences in single processes.
We compared our productivity results with those of a previous study conducted under similar conditions (Schweier et al. Citation2023). There, the average yarding productivity was 9.95 m3ob PMH15−1, which is lower than the values observed here, although cable lines were longer (551 m and 637 m). There is a predictor correlation between perimeter and yarding distance which needs to be considered, which means that it is not possible to distinguish whether an effect is due to the perimeter or the yarding distance. Therefore, we went back to the raw data collected by Schweier et al. (Citation2023) and excluded all cycles with yarding distances beyond 200 m. If this is taken as a reference, there is no significant difference in total productivity, yarding productivity, or lateral yarding productivity between the two studies.
Other studies with similar machines being applied in steep terrain report productivities of 7.0–21.0 m3ob PMH0−1 (Ghaffariyan et al. Citation2009; Campbell Citation2016; Stoilov et al. Citation2021). Recently, Böhm and Kanzian (Citation2023) reported 9.8 m3 per productive system hour. Thus, yarding productivity in flat terrain seems to be comparable to the productivity reached in steep terrain. We had initially assumed that more intermediate supports are needed in flat terrain on the one hand, but that lateral yarding is less challenging for labor on the other hand and that those two aspects counterbalance. However, this cannot be conclusively proven from this study.
If the terrain was not too sensitive, the reference harvesting method would be ground-based systems such as winch-assisted forwarders. Here, higher productivities can be expected, e.g., Holzfeind et al. (Citation2018) reported an average productivity of 13.7 m3 PSH15−1.
Finally, the payload (1.6–2.0 m3ob per cycle in our case, ) is an important variable. It was used as an input variable in roughly one-third of the reviewed studies reported in Böhm and Kanzian (Citation2023). Most of the studies differed significantly from ours regarding machine type (size), study area (forest type), and intensity (selective cutting). However, two studies were conducted under comparable conditions – but in steep terrain. The mean payload per cycle ranged from 1.1 to 2.0 m3ob (Campbell Citation2016; Stoilov et al. Citation2021), which is a bit lower than in our case.
Production costs
The resulting production costs were 69.84–102.14 CHF m3ob−1, including felling, installation, yarding and processing timber to the road site. These values can be considered high and not competitive with ground-based systems. In our case, the local foresters told us that the ground-based reference system costs approx. one-third less – at least compared with study sites M and U.
Labor costs made up 60% of the total cost of the operation and therefore had a major impact on the results. Bont et al. (Citation2024) demonstrated that a 1% change in labor costs affects harvesting costs by 0.33–0.77%. Of course, this depends on the harvesting method applied, and the percentage is larger for systems that involve a large share of motor-manual work and for cable-based methods.
At all three study sites, former strip roads were still clearly visible, and the local foresters told us that climate conditions have worsened in the last decade, making a ground-based system out of the question. However, due to economic reasons, we doubt that the cable yarding operations would have been conducted without subsidies from the canton.
Conclusions
We analyzed the productivity and costs of three cable yarding operations being conducted on sensitive soil in flat terrain in the Swiss canton of Aargau. In all cases, just one cable corridor was installed. The installation procedures (setting up and dismantling of the yarder) were the most time-consuming and expensive working step, demonstrating that planning – as well as the overall amount of biomass being removed – is essential for any operation, as is the selection of an appropriate technique. The productivity was 15.05–21.86 m3ob PMH15−1 and therefore comparable to the productivity reached in steep terrain. According to the local foresters, resulting production costs were one-third higher than ground-based systems. However, the soils were sensitive at all three sites, prohibiting the use of ground-based systems. Therefore, the canton paid the forest owners for the difference in cost between the reference systems (ground-based) and the applied ones (cable-based), making it possible to apply sustainable forest operations and contribute to sustainable forest management. The ideal case would be to find a technique that fosters sustainable forest operations at a low(er) cost.
Statements and declarations
The authors disclose any financial or non-financial interests that are directly or indirectly related to the work submitted for publication. The authors declare that there is no conflict of interest. The research did not involve human participants or animals. Finally, no sources of funding need to be acknowledged.
Acknowledgements
We acknowledge the Canton of Aargau for permitting and supporting the data analyses. Furthermore, we thank the local foresters of the state forest enterprises and the forest enterprises for cooperation. Finally, we are grateful to Flavian Stocker, Elias Vogel and Lioba Rath (all from WSL) for supporting the data collection.
Disclosure statement
No potential conflict of interest was reported by the author(s).
References
- Abbas D, Di Fulvio F, Spinelli R. 2018. European and United States perspectives on forest operations in environmentally sensitive areas. Scand J Forest Res. 33(2):188–201. doi: 10.1080/02827581.2017.1338355.
- Akaike H. 2011. Akaike’s information criterion. In: Lovric M, editor. International encyclopedia of statistical science. Heidelberg: Springer, Berlin; p. 25–25.
- Böhm S, Kanzian C. 2023. A review on cable yarding operation performance and its assessment. Int J For Eng. 34(2):229–253. doi: 10.1080/14942119.2022.2153505.
- Bont LG, Schweier J, Temperli C. 2024. Effect of labour costs on wood harvesting costs and timber provision. Eur J For Res. 143:393–418. doi: 10.1007/s10342-023-01621-5.
- Cambi M, Certini G, Neri F, Marchi E. 2015. The impact of heavy traffic on forest soils: a review. For Ecol Manag. 338:124–138. doi: 10.1016/j.foreco.2014.11.022.
- Campbell T. 2016. Assessment of the opportunity of modern cable yarders for application in New Zealand [ Master`s thesis]. University of Canterbury.
- Erber G, Spinelli R. 2020. Timber extraction by cable yarding on flat and wet terrain: a survey of cable yarder manufacturer’s experience. Silva Fenn. 54(2): doi: 10.14214/sf.10211.
- Ghaffariyan MR, Stampfer K, Sessions J. 2009. Production equations for tower yarders in Austria. Int J For Eng. 20(1):17–21. doi: 10.1080/14942119.2009.10702571.
- Haas J, Schack-Kirchner H, Lang F. 2020. Modeling soil erosion after mechanized logging operations on steep terrain in the Northern Black Forest, Germany. Eur J For Res. 139(4):549–565. doi: 10.1007/s10342-020-01269-5.
- Heinimann HR, Stampfer K, Loschek J, Caminada L. 2001. Perspectives on central European cable yarding systems. In: Proceedings of the international mountain logging and 11th Pacific Northwest skyline symposium. https://depts.washington.edu/sky2001/proceedings/papers/Heinimann.pdf.
- Holzfeind T, Stampfer K, Holzleitner F. 2018. Productivity, setup time and costs of a winch-assisted forwarder. J For Res. 23(4):196–203. doi: 10.1080/13416979.2018.1483131.
- Holzfeind T, Visser R, Chung W, Holzleitner F, Erber G. 2020. Development and benefits of winch-assist harvesting. Curr For Rep. 6(3):201–209. doi: 10.1007/s40725-020-00121-8.
- IUFRO. 1995. Forest work study. Nomenclature. Test Edition valid 1995-2000.
- Kellogg L, Bettinger P, Studier D. 1993. Terminology of ground-based mechanized logging in the pacific northwest. Research Contribution 1. Corvallis, OR, USA: Oregon State University.
- Magagnotti N, Kanzian C, Schulmeyer F, Spinelli R. 2013. A new guide for work studies in forestry. Int J For Eng. 24(3):249–253. doi: 10.1080/14942119.2013.856613.
- Pucher C, Erber G, Hasenauer H. 2023. Europe’s potential wood supply by harvesting system. Forests. 14(2):398. doi: 10.3390/f14020398.
- Schönauer M, Holzfeind T, Hoffmann S, Holzleitner F, Hinte B, Jaeger D. 2021. Effect of a traction-assist winch on wheel slippage and machine induced soil disturbance in flat terrain. Int J For Eng. 32(sup1):1–11. doi: 10.1080/14942119.2021.1832816.
- Schweier J, Klein M-L, Kirsten H, Jaeger D, Brieger F, Sauter UH. 2020. Productivity and cost analysis of tower yarder systems using the Koller 507 and the Valentini 400 in southwest Germany. Int J For Eng. 31(3):172–183. doi: 10.1080/14942119.2020.1761746.
- Schweier J, Ludowicy C. 2020. Comparison of a cable-based and a ground-based system in flat and soil-sensitive area: a case study from southern Baden in Germany. Forests. 11(6):611. doi: 10.3390/f11060611.
- Schweier J, Werder M, Bont LG. 2023. Timber provision on soft soils in forests providing protection against natural hazards: a productivity and cost analysis using the Koller 507 in the horizontal yarding direction in Switzerland. Small-Scale For. 22(2):271–301. doi: 10.1007/s11842-022-09526-8.
- Stampfer K, Visser R, Kanzian C. 2006. Cable corridor installation times for European yarders. Int J For Eng. 17(2):71–77. doi: 10.1080/14942119.2006.10702536.
- Stoilov S, Proto AR, Angelov G, Papandrea SF, Borz SA. 2021. Evaluation of salvage logging productivity and costs in the sensitive forests of Bulgaria. Forests. 12(3):309. doi: 10.3390/f12030309.
- Varch T, Erber G, Visser R, Spinelli R, Harrill H, Stampfer K. 2021. Advances in cable yarding: a review of recent developments in skyline carriage technology. Curr For Rep. 7(4):181–194. doi: 10.1007/s40725-021-00150-x.
- Visser R, Stampfer K. 2015. Expanding ground-based harvesting onto steep terrain: a review. Cro J For Eng. 36(2):321–331.
- Visser RM, Spinelli R. 2023. Benefits and limitations of winch-assist technology for skidding operations. Forests. 14(2):296. doi: 10.3390/f14020296.
- WaldSchweiz. 2023. Standard cost rates of forestry work in Switzerland. Personal Communication. 26 Jul 2023.
Appendix
Model diagnostics plots
Figure A1. Model diagnostics plot (residual analysis plot) for model #5UB (unterlunkhofen and berikon sites); representative of all models.
Machine effort and cost calculations in the study sites
Table A1. Personnel and machine effort in the Muri study site.
Table A2. Personnel and machine effort in the Unterlunkhofen study site.
Table A3. Personnel and machine effort in the Berikon study site.