
Abstract
Objective
To investigate older and younger adults’ perceptions of older and younger adults who wear hearing aids.
Design
Participants completed two Implicit Association Tests: One with images of older adults (OA-IAT) and one with images of younger adults (YA-IAT), either wearing or not wearing hearing aids. Participants also rated age, attractiveness, and intelligence of younger and older adults pictured with or without a hearing aid.
Study sample
Thirty older adults (M age = 70 years, SD = 4.38) and 30 younger adults (M age = 23 years, SD = 3.01) who reported not having hearing aids or a diagnosed hearing impairment.
Results
For both IATs, older and younger participants responded faster and more accurately when images of individuals wearing hearing aids were paired with negative words in comparison to positive words. Photo ratings did not vary in relation to the presence or absence of hearing aids for either age group.
Conclusion
Although the photo rating tasks indicate neutral explicit attitudes towards individuals who wear hearing aids, our interpretation of the IAT results indicates that younger and older adults may hold negative implicit attitudes towards both older and younger hearing aid users.
The World Health Organization reports that the proportion of the world’s population over 60 years will nearly double between 2015 and 2050, from 900 million to 2 billion (World Health Organization Citation2018). As the global population ages, rates of age-related hearing loss (ARHL) will increase. Indeed, recent reports suggest that one-third of adults aged 65+ years have ARHL (World Health Organization Citation2018). Hearing aids effectively reduce the impact of ARHL in many communication settings; however, only about 14–25% of older adults who could benefit from hearing aids use them (Franks and Timmer Citation2023). In addition to factors such as cost and comfort, perceived hearing aid stigma is reported as a barrier to hearing aid uptake (e.g. Jenstad and Moon Citation2011).
Existing research on stigma, hearing loss, and hearing aids suggests that age, as well as the size and visibility of hearing aids, are important factors in determining when a hearing aid wearer can be stigmatised (David and Werner Citation2016). Some studies suggest that younger age is associated with increased stigma, whereas others report that due to the prevalence of hearing loss and/or hearing aid use increasing with age, ageist stereotypes reduce the likelihood of individuals seeking hearing assessment and intervention (Southall, Gagné, and Jennings Citation2010). However, as the majority of stigma research in the context of hearing health has measured a single age group’s perception of peers (e.g. older adults’ perceptions of older adults), how the age of an observer and the age of a hearing aid user interacts to influence perceptions is not well understood.
An additional limitation of existing work on stigma and hearing is that most studies have used direct measures of perceptions of individuals who wear hearing aids, such as self-report questionnaires or picture rating tasks. Overall, these studies have produced inconsistent results (e.g. Blood, Blood, and Danhauer Citation1977; Danhauer, Mulac, and Eve Citation1985; Iler, Danhauer, and Mulac Citation1982). For example, Blood, Blood, and Danhauer (Citation1977) found that university students rated teens wearing hearing aids as less attractive and intelligent than teens without hearing aids (i.e. “the hearing aid effect”). In contrast, neither Danhauer, Mulac, and Eve (Citation1985) nor Iler, Danhauer, and Mulac (Citation1982) found a difference in older adults’ ratings of achievement, personality, or appearance in older adults with or without a hearing aid, and Rauterkus and Palmer (Citation2014) did not find a difference in intelligence, age, or appearance when college students rated a younger adult male wearing three different styles of hearing aids in comparison to a no hearing aid control condition. It is possible that perceptions of individuals with disabilities, such as hearing loss, have improved over time; however, as the picture rating method used in these studies is susceptible to social desirability bias, the results may not accurately capture underlying perceptions of people who wear hearing aids. To minimise the effects of social desirability bias, the current study adopted the Implicit Association Test (IAT) to evaluate younger and older adults’ perceptions of both younger and older adults who wear hearing aids (Greenwald, McGhee, and Schwartz Citation1998).
The IAT is perhaps best known for its use as an indirect measure of attitudes towards age and race. However, it has also been used to measure attitudes towards health-related topics such as blindness vs. sightedness (McDonnall et al. Citation2019), stuttering vs. clear speech (Walden and Lesner Citation2018), and disability vs. ability (Wilson and Scior Citation2014). The IAT requires rapid sorting of stimuli from four categories: two of the stimulus categories are evaluative, i.e. good words (e.g. laughter) and bad words (e.g. hurt); the other two categories are related to the target concept, e.g. young and old. The task uses two response keys, each of which is assigned to two of the four concepts for critical trials. For example, a participant would be instructed to pair pictures of younger adults with good words in one block, and with bad words in another block. The more quickly and accurately a person sorts two stimuli categories to the same response key (young/good) as compared to the opposite pairing (old/good) is considered an indication of how much bias a person has towards one or the other (e.g. associating positive qualities more strongly with younger adults than older adults). By focusing participants’ attention on the category task (i.e. deciding whether picture is X, or a word is Y), and having participants respond as quickly as possible, it is inferred that response latency captures a more automatic, unintentional, or efficient (implicit) measure of attitudes, in comparison to self-report measures (Greenwald, McGhee, and Schwartz Citation1998). Although there is variability in the strength of relationships between IAT scores and behaviour across studies, some IAT measures have been shown to predict behaviours, such as physical activity and alcohol consumption (Schinkoeth and Antoniewicz Citation2017; Uhlmann, Poehlman, and Nosek Citation2012).
The IAT is the most frequently used indirect measure of attitudes suitable for online research (see Greenwald and Lai Citation2020 for a review). The majority of work using the IAT method over the past 20 years interprets the results from this task as an indication of “implicit attitudes” or “implicit bias” (e.g. Greenwald and Lai Citation2020). However, there is still debate regarding the interpretation of the IAT. Namely, it has been proposed that the IAT could be measuring the salience or familiarity of the stimuli, or cultural knowledge, rather than attitudes alone (Rothermund & Wentura, Citation2004; Uhlmann, Poehlman, and Nosek Citation2012; but see Greenwald et al. Citation2005 for a rebuttal). The implicit nature of the IAT has also been challenged. That is, although it is harder to intentionally influence IAT results in comparison to self-report measures, some studies (e.g. Steffens Citation2004) suggest that it is possible when specific response instructions are provided. Therefore, it is standard not to give response instructions that could guide participant strategies.
To our knowledge, only one other published study has used a hearing-aid focused IAT (Manzi et al. Citation2022). These authors’ primary aim was to determine if language used in media communication about hearing aids (i.e. medical vs. colloquial language) would affect attitudes towards hearing aids. They measured attitudes with a hearing aid vs. eyeglasses IAT and semantic differential scales. For the IAT, participants exposed to a newspaper article with medical language (e.g. hypoacusis, acoustic devices) responded slower when hearing aid images and positive words were paired (in comparison to when hearing aid images and negative words were paired), than those exposed to either the same newspaper article with medical terms replaced with more colloquial language (e.g. hearing loss, hearing aids), or to a newspaper article on the topic of normal hearing. The authors interpreted this result as indicating that participants exposed to the medical language article had more negative implicit (automatic, unintentional, efficient) attitudes towards hearing aids than participants exposed to the other articles. Participants also rated the semantic differential scales more positively when exposed to the colloquial language or normal hearing article in comparison to the medical language article, which was interpreted to reflect more positive explicit attitudes.
The primary aim of the current study was to investigate the effects of participant age and the age of individuals who wear hearing aids on perceptions of individuals who wear hearing aids. To do this, we administered two versions of a hearing-aid IAT to younger and older participants—one with images of younger adults with and without hearing aids [YA-IAT], and the other with images of older adults with and without hearing aids [OA-IAT]. We also tested younger and older adult participants on an explicit picture rating task with pictures of both younger and older hearing aid users and non-users.
For the YA-IAT and OA-IAT measures, it was predicted that both younger and older participants would perform faster and more accurately when images of individuals wearing hearing aids were paired with negative words in comparison to positive words. This prediction is consistent with younger adults’ performance on IATs comparing disability vs. ability (Wilson and Scior Citation2014). We also predicted that there would be an interaction between Participant Age and IAT, but that the directionality of this interaction could go in one of two ways. First, because unaided older adults associate hearing aids with ageing more than aided older adults or younger adults (Cienkowski and Pimentel Citation2001), and older adults’ performance on the standard Age-IAT suggests an anti-ageing bias (Chopik and Giasson, Citation2017), response times could be significantly faster for older participants in comparison to younger participants for both IATs when people wearing hearing aids are paired with negative words in comparison to positive words. Alternatively, due to evidence of ageism in both younger and older populations (Chopik and Giasson, Citation2017), it is possible that both age groups will show significantly faster response times when people wearing hearing aids are paired with negative words in comparison to positive words for the OA-IAT in comparison to the YA-IAT.
For the picture rating method, we predicted that younger or older adult participants would not show a hearing aid effect for ratings of age, intelligence or attractiveness, which would be consistent with many hearing aid effect studies testing younger and older populations (e.g. Rauterkus and Palmer Citation2014). However, consistent with studies using the picture rating method to investigate ageism (e.g. Ebner Citation2008), we did predict ageism effects for both participant groups. That is, it was expected that both younger and older participants would rate older adult pictures as less attractive and intelligent than younger adult pictures, irrespective of whether individuals are pictured wearing a hearing aid or not.
The current study also aimed to investigate whether IAT performance was related to hearing aid stigma, ageism, hearing disability, and exposure to hearing devices. Based on previous studies investigating hearing aid stigma and ageism (e.g. Chopik and Giasson, Citation2017; Cienkowski and Pimentel Citation2001), we expected younger adults to report more hearing aid stigma and ageism than older adults; however, we did not expect that these self-report measures would correlate with either of the IATs, for either participant group. The latter prediction is motivated by previous research indicating that self-report ageism and the Age-IAT are not typically correlated (e.g. Chopik and Giasson, Citation2017; Hummert et al. Citation2002).
We expected that older adults would show more hearing disability and more hearing device exposure than younger adults. Although we predicted that older adults would show faster response times when hearing aid images were paired with negative words compared with positive words overall, we also expected that older adults’ response times would be slower (i.e. attenuated) when they experienced hearing disability or had exposure to individuals who wear hearing aids, leading these variables to each be associated with IAT performance. This prediction is supported by research showing that experiencing a virtual reality wheelchair simulation (i.e. having a brief experience of a physical disability) or experience working with wheel chair users has resulted in slower response times when disability images are paired with negative words (in comparison to positive words) on the Disability vs. Ability IAT (Chowdhury et al., Citation2019; Galli et al. Citation2015). Although this research was in the domain of physical disability, in principle the methods and logic could extend to a sensory disability.
In summary, the self-report variables described above were measured to be consistent with previous research on hearing aid stigma and ageism. That is, explicit measures of ageism are consistently included in standard Age-IAT literature, and hearing aid stigma, hearing disability, and exposure to hearing devices are included as correlational variables in research investigating perceptions of hearing aids using self-report measures alone (Wheeler and Tharpe Citation2020; Qian et al. Citation2021).
Earbud use and computer use were also evaluated as exploratory variables to investigate whether familiarity with these technologies would be related to performance on a hearing aid version of the IAT. Similarly to hearing device exposure, it was predicted that greater use of earbuds could be associated with faster response times when people wearing hearing aids are paired with positive words in comparison to negative words. We did not expect that computer use would be significantly related to IAT performance; however, this variable was included to test whether frequency of computer use was related to overall ability to perform as expected on the IAT (e.g. consistency of response times).
Materials and methods
Participants
Thirty younger adults (20 females, 10 males, 0 non-binary, MAge = 23) and 30 older adults (20 females, 10 males, 0 non-binary, MAge = 70) participated in this study. A power analysis indicated that a total sample size of 54 (i.e. 27 for each age group) is required to detect a medium size effect with 95% power for a repeated measures within-between interaction (Faul et al., 2007). A medium effect size was chosen for the power analysis due to consideration of effect sizes reported in previous IAT research (e.g. Greenwald and Lai Citation2020; Hummert et al. Citation2002). Younger adults were recruited from a university volunteer research participation list. Older adults were recruited via an advertisement in senior centre newsletters. All participants were reimbursed $20 CAD for their participation.
All participants were fluent English speakers and passed a cognitive screening test (The Montreal Cognitive Assessment, MoCA; Nasreddine et al. Citation2005). Participants also self-reported that they did not wear hearing aids or cochlear implants, had not previously been diagnosed with hearing loss, and did not have an uncorrected visual impairment. Sociodemographic characteristics of participants are available as supplementary materials.
Implicit association tests
Two Hearing Aid Implicit Association Tests, one with pictures of younger adults (YA-IAT) and one with pictures of older adults (OA-IAT), were designed to indirectly assess participants’ attitudes towards younger and older adults who wear hearing aids in comparison to those who do not. The Hearing Aid IAT tasks each used four sets of stimuli: 1) nine words with a positive evaluative connotation (e.g. joy), presented in text format; 2) nine words with a negative evaluative connotation (e.g. horrible), presented in text format; 3) six profile pictures of people wearing an in-the-ear style hearing aid (3 male and 3 female), and 4) the same 6 profile pictures, this time presented without hearing aids.
The positive and negative words were consistent with words that have been used for the Age-IAT by Project Implicit (IAT Corp Citation2022). These words are randomly selected from a larger group of 64 words which have shown consistent IAT results regardless of which words from this larger group are selected (IAT Corp Citation2022). All pictures were selected from the Face Database (Minear and Park Citation2004), which includes pictures of both younger and older adults at a profile angle, with the ear clearly visible.
All pictures selected for the Hearing Aid IATs showed the right ear with no hair or clothing covering the ear nor any jewellery, and did not already include a hearing aid. The selected pictures were also in the neutral expression category of the Face Database, with similar hairstyles for each age and gender group. The older adult pictures showed people with short, grey hair, and the males were clean shaven. The three younger females had their hair in a bun, and the three younger males had short, brunette hair, and were clean-shaven. We used photos of Caucasian individuals for this study as most photos in the Face Database that clearly showed the right ear were Caucasian. We acknowledge this as a limitation of the research.
An In-The-Ear Style Hearing Aid was added to each picture with Adobe Photoshop (Version 23). The fit and colour of the Hearing Aid were adjusted to look as natural as possible for each picture, as judged by an audiologist. Hearing Aid and No Hearing Aid duplicates were then cropped to 800 × 240 pixels.
The In-the-Ear Style Hearing Aid and cropping procedure were used in order to facilitate participants’ ability to see the Hearing Aid (if present) and thus correctly categorise Hearing Aid vs. No Hearing Aid pictures. This approach aligns with best practice for IAT; namely, the stimuli should be easy for subjects to correctly categorise, avoiding excessive delay in response time that can affect the overall results.
The IAT tasks followed the standard IAT structure (Greenwald, Nosek, and Banaji Citation2003), consisting of seven blocks of trials: (1) practice of single categorisation task for the evaluation (e.g. good-bad); (2) practice of single categorisation task for the target concept (e.g. hearing aid-no hearing aid); (3) practice of combined categorisation task (e.g. hearing aid-good, no hearing aid-bad); (4) test trials for the block 3 combined categorisation task; (5) practice of single categorisation task for the evaluation dimension, but with the response keys reversed from the block 1 assignment; (6) practice of combined categorisation task (e.g. hearing aid-bad, no hearing aid-good); (7) critical trials for the block 6 categorisation task. The order in which subjects performed the mixed categorisation blocks (i.e. blocks 3–4 and 6–7) was counterbalanced. Accuracy and response time data were collected for each trial. summarises the block and trial structure of the Hearing Aid IATs.
Table 1. Sequence of trial blocks for the YA-IAT and the OA-IAT.
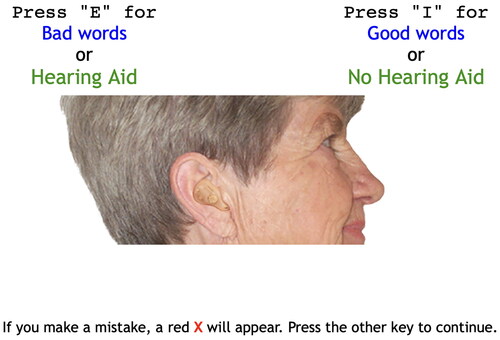
Before each block began, instructions regarding the categorisation task and the mapping of key responses to concepts appeared on the screen, and participants were reminded to respond as quickly and as accurately as possible. Participants pressed the “E” and “I” keyboard keys for left- and right-hand responses, respectively. During the task, reminders of which stimuli were assigned to which response key remained on the computer screen. depicts a single trial within a block with a Hearing Aid-Negative, No Hearing Aid-Positive structure.
Figure 1. Example IAT trial.
Note. Images of older and younger adults are from the Minear and Park (Citation2004) Face Database.
Picture rating
Twelve younger adult photos and 12 older adult photos not used in the IAT task were selected from the Face Database (Minear and Park Citation2004). Individuals in the selected photos were not pictured wearing a hearing aid, were between the ages of 18–27 (younger adult photos; MAge = 22) or 63–80 (older adult photos; MAge = 72) and were Caucasian. For 10 photos, earrings were removed with Adobe Photoshop (Version 23) using the clone stamp function.
The same In-The-Ear Style Hearing Aid that was used for the IAT stimuli was added to each photo with Adobe Photoshop. The fit and colour of the Hearing Aid were adjusted to look as natural as possible for each individual picture, as affirmed by an audiologist. Images were cropped to 2000 × 2000 pixels.
Two versions of the photo rating task were created (Version A and Version B). Males and females shown with hearing aids in Version A were then shown without hearing aids in Version B and vice versa. Half of the participants completed Version A of the task; half completed Version B. For both versions, participants were randomly presented with 24 photos, one at a time. Participants rated the age of the person in the photo by typing a number from 18 to 100, then rated intelligence and attractiveness of the person in the photo using a Likert-type scale ranging from 0 (Not at all) to 4 (Very much; Ebner Citation2008).
Questionnaires
A series of questionnaires were presented with Qualtrics. A summary of each questionnaire is provided in supplementary material. The rationale for including these questionnaires was to describe the participant sample and to explore the relationship between the variables of interest and performance on the YA-IAT and OA-IAT. Hearing disability was measured using the Hearing Handicap Inventory for the Elderly/Adults (HHIE/A; Ventry and Weinstein Citation1983). To measure hearing device exposure, participants completed items that assessed how many people they knew with a hearing aid and/or cochlear implant, and if they could recall characters with hearing aids or cochlear implants in movies, T.V. shows, and books (Wheeler and Tharpe Citation2020). Hearing aid stigma was measured using a subset of items from the Attitudes Towards Loss of Hearing Questionnaire (Cienkowski and Pimentel Citation2001); ageism was measured using a multiple-choice item that involves rating feelings towards younger in comparison to older adults, which is typically administered for research using the Age-IAT (Chopik and Giasson Citation2017).
Cognitive tasks
Participants completed two cognitive tasks, the Digit Symbol Substitution Task (Wechsler Citation1981) and the Simon Arrow Task (Tse and Altarriba Citation2014), to test if age-related changes in fluid cognition are related to IAT performance. We planned to use the updated IAT scoring procedure, which accounts for participants’ standard deviation (and should therefore account for differences in cognition). However, as our study is only one of a few that has used the IAT procedure with older adults, we wanted to evaluate whether processing speed and inhibition skills were driving any significant effects from the hearing aid IATs. Detailed descriptions of the Digit Symbol Substitution Task and the Simon Arrow Task are provided in supplementary materials.
Apparatus
Participants completed the tasks on their personal computer. The IAT tasks were programmed with MinnoJS and administered with Qualtrics. The Simon Arrow Task, the Simon-Switching Arrow Task, and the DSST were programmed with PsychoPy3 and administered online with Pavlovia (Peirce et al. Citation2019). All questionnaires were administered with Qualtrics.
Procedure
Upon contacting the researcher, participants were asked to confirm that they met the eligibility criteria. Information and consent documents were emailed to eligible participants. Participants met with a researcher (JB) on Zoom. The MoCA was always the first task administered. The MoCA-certified researcher followed the procedure for video-call MoCA administration. After completing the MoCA, participants were instructed to share their desktop screen to ensure that participants were not focusing on other tasks (e.g. email or social media). The researcher then shared the link for the first IAT task via the Zoom Chat and read the instructions for each block of the IAT. Participants were also told to read the instructions themselves before starting each block. The order of the IATs was counterbalanced across participants.
After completing both IATs, participants were invited to take a break. Next, participants completed the DSST and Simon Arrow Task, which were presented in a counterbalanced order across participants. Participants accessed each task via a link that the researcher shared in the Zoom Chat. The researcher read the instructions aloud for each task, and participants also had the opportunity to read the instructions and ask questions. Participants then completed the photo rating task and the questionnaires. After completing all tasks, participants were debriefed and reimbursed. The total session duration was approximately 1.5 hours (including breaks).
Analysis plan
Descriptive and inferential statistics were calculated using SPSS (Version 28.0.1.1). Consistent with previous IAT research, t-tests were conducted to evaluate whether mean IAT scores were significantly different from zero. Mixed repeated measures ANOVAs were planned for the IAT data and each variable of the photo rating task (i.e. age, intelligence, attractiveness), with any significant interactions to be followed-up with Bonferroni corrected paired comparisons. To examine the relationship between each of the questionnaire variables (hearing aid stigma, ageism, hearing disability, exposure to hearing devices, earbud use, and computer use) and performance on the IAT, Pearson or Spearman’s correlation analyses (depending on a post-hoc evaluation of the distributions of the questionnaire variables) were planned.
Implicit association tests
The IATs were scored using the standard scoring algorithm recommended by Greenwald, Nosek, and Banaji (Citation2003) to produce an IAT D score (D is an effect size measure related to Cohen’s d). Larger, more positive D Scores indicate that participants responded faster and more accurately when images of individuals wearing hearing aids and negative words were paired, in comparison to when images of individuals wearing hearing aids and positive words were paired; conversely, a negative D score indicates that participants responded faster and more accurately when images of individuals wearing hearing aids and positive words were paired.
Results
Mean IAT D scores for younger and older participants are shown in . Younger adult participants’ mean D score on the YA-IAT (M = .42, SD = .51) and OA-IAT (M = .49, SD = .60) were both significantly greater than zero (YA-IAT: t (29) = 4.50, p < .001; OA-IAT: t (29) = 1.72, p < .05).
Figure 2. IAT D scores for younger and older participants as a function of YA-IAT and OA-IAT.
Note. Tukey’s box plots represent the median and interquartile range (Q3-Q1). Violin plots represent the probability density of the data across the distribution. Filled circles represent the mean D score for each condition.
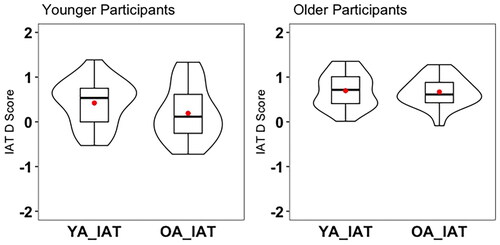
Older adult participants’ mean performance on the YA-IAT (M = .69, SD = .39) and OA-IAT (M = .64, SD = .35) were also both significantly greater than zero (YA-IAT: t (29) = 9.58, p < .001; OA-IAT: t(29) = 10.10, p < .001).
Visual inspection of histograms and qq plots, as well as a Shapiro-Wilk analysis, indicated that the IAT data was sufficiently normally distributed (Yap and Sim Citation2011). Levene’s test for homogeneity of variance was violated for the OA-IAT [F(1,58) = 10.20, p = .002] but not violated for the YA-IAT (F(1,58) = 2.41, p = .126). As ANOVA is generally robust with normal distributions of equal sample size (Sahai and Ageel Citation2000), we opted to proceed with the analysis as planned. A two-way mixed repeated measures ANOVA with Participant Age (Younger vs. Older) as the between-subjects variable and IAT (YA-IAT vs. OA-IAT) as the within-subjects variable showed a main effect of Participant Age: older adult participants’ D scores were significantly more positive than younger adult participants’ D scores, F(1, 58) = 13.80, p <.001,η2= .19. This indicates that older adults had faster response times than younger adults when images of individuals wearing hearing aids and negative words were paired, in comparison to when images of individuals wearing hearing aids and positive words were paired. On the other hand, the main effect of IAT was not statistically significant F(1, 58) = 3.41, p = .07, η2= .06), nor was the interaction between Participant Age and IAT, F(1, 58) = 1.42, p =.24, η2= .02).
Picture rating
Perceived age, attractiveness, and intelligence, as a function of Picture Age and Participant Age are shown in . There were no significant effects of hearing aid for pictures of younger or older adults, for the age, attractiveness, or intelligence ratings (p ≥ .06).
Figure 3. Picture rating results.
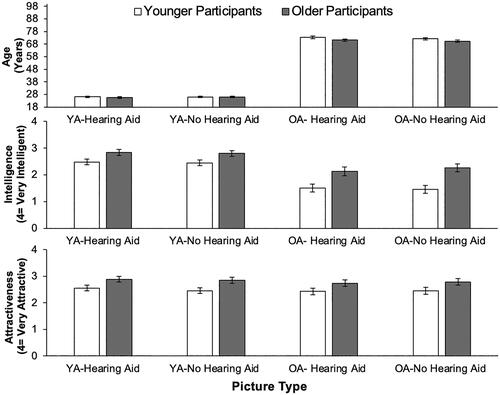
For the perceived age rating, younger and older participants were accurate in their ratings in that pictures of older adults were rated as “older” (OA Pictures-Hearing Aid: M = 72, Min = 62, Max = 85, SD = 5.48; OA Pictures-No Hearing Aid: M = 71, Min = 62, Max = 82, SD = 4.98) and pictures of younger were rated as “younger” (YA Pictures-Hearing Aid: M = 26, Min = 20, Max = 33, SD = 2.82; YA Pictures-No Hearing Aid: M = 25, Min = 20, Max = 32, SD = 2.80).
Perceived attractiveness and perceived intelligence ratings were each analysed using a 2 × 2 × 2 mixed repeated measures ANOVA with participant age (Younger vs. Older) as the between-subjects variable and Picture Age (Younger vs. Older) and Hearing Aid (Hearing Aid vs No Hearing Aid) as the within-subjects variables. For perceived attractiveness, there was a significant effect of Picture Age, F (1, 58) = 110.73, p <.001, η2= .67. That is, pictures of younger adults (M = 2.64, SE = .08) were rated as significantly more attractive than pictures of older adults (M = 1.83, SE = .11). There was also a significant effect of Participant Age for perceived attractiveness, F (1, 58) =10.81, p = .002, η2= .16. Pictures were rated as more attractive by older participants (M = 2.52, SE = .12) than by younger participants (M = 1.97, SE = .12).
For perceived intelligence, there was a significant effect of Picture Age, F (1, 58) = 4.33, p = .042, η2= .07. That is, pictures of younger adults (M = 2.70, SE = .08) were rated as significantly more intelligent than pictures of older adults (M = 2.61, SE = .08). There was also a significant effect of participant group for perceived intelligence, F (1, 58) = 5.49, p = .023, η2= .09. Older participants (M = 2.84, SE= .11) rated people in the pictures as more intelligent than younger participants (M = 2.48, SE = .11). All other main effects and interaction effects for perceived intelligence and perceived attractiveness were not significant (p ≥ .06).
Questionnaires
Descriptive statistics and correlation coefficients for the questionnaires as a function of age group are available in supplementary materials (Table S3). Mann Whitney U tests indicated that self-reported hearing disability and self-reported hearing aid stigma were not significantly different between younger and older participant groups (Hearing Disability: U = 349.00, z = −1.53, p = .126, r = .20; Hearing Aid Stigma, U = 373.00, z = −1.36, p = .174, r = .18). There were significant differences between Participant Age for all other questionnaire variables. Younger Participants had significantly less Hearing Device Exposure (U = 68.00, z = −5.77, p < .001, r = .74) than Older Participants, and significantly higher levels of Ageism, Computer Use, and Ear Bud Use than Older Participants (Ageism: U = 151.50, z = −5.09, p < .001, r = .66; Computer Use: U = 180.00, z = −4.28, p < .001, r = .55; Ear Bud Use: U = 109.00, z = −5.29, p < .001, r = .68).
Due to the skewed distribution of older adults’ responses, Spearman correlation coefficients were calculated to investigate the relationship between each questionnaire and performance on the OA-IAT and YA-IAT, respectively. The only significant correlation was for older adults, for the OA-IAT. Namely, older adults with higher scores on the Hearing Disability measure (i.e. poorer hearing) had lower OA-IAT D scores (i.e. slower response times when images of individuals wearing hearing aids and negative words were paired, r = −.41, p < .05.
Cognitive tasks
As expected, the results from the cognitive tasks indicated that neither processing speed (as measured by the DSST) nor inhibition (as measured by the Simon Task) were predictive of YA-IAT or OA-IAT performance for either age group. Detailed results are provided in supplementary materials.
Discussion
The current study investigated whether the age of a perceiver (younger vs. older) and the age of a hearing aid user (younger vs. older) interact to influence perceptions of individuals who wear hearing aids. For both the YA-IAT and the OA-IAT, younger and older participants’ IAT D scores were significantly greater than zero, with older adults’ D scores significantly greater than younger adults’. This indicates that participants responded faster and more accurately when images of individuals wearing hearing aids and negative words were paired, in comparison to when images of individuals wearing hearing aids and positive words were paired (older more so than younger). This pattern of response times is consistent with studies conducted using disability vs. ability IATs, as well as the hearing aid vs. eyeglasses IAT (Walden and Lesner Citation2018; Wilson and Scior Citation2014; Manzi et al. Citation2022).
Our interpretation of the response time results from the hearing aid-IATs is that older adults are showing strong negative implicit attitudes towards individuals who wear hearing aids (compared to individuals not wearing hearing aids), and that younger adults are showing moderate negative implicit attitudes towards individuals who wear hearing aids (compared to individuals not wearing hearing aids). This interpretation is consistent with standards suggested by the developers of the IAT and how Manzi et al. (Citation2022) interpreted their hearing aid vs. eyeglasses IAT results.
On the other hand, our prediction that there would be an interaction between IAT and Participant Age was not supported. This finding is consistent with evidence of ageism in both younger and older populations (Chopik and Giasson Citation2017), but inconsistent with self-report research indicating that unaided older adults associate hearing aids with ageing more than aided older adults or younger adults (Cienkowski and Pimentel Citation2001). As there is limited implicit research investigating interactions between the age of a perceiver and the age of a hearing aid user on perceptions, we suggest that this interaction continue to be investigated and include a more diverse range of ages (e.g. children, middle-aged).
Although further investigation and replication is required, the conventional interpretation of the IAT results suggests that negative implicit attitudes could potentially be one of many factors contributing to low hearing aid uptake rates currently observed in older adults, and that it may be important to improve perceptions of hearing aid use in order to improve uptake rates for future generations. Alternate interpretations of response time data from the IAT have been proposed, with some researchers acknowledging that the IAT is an attitude measure but that response times can be influenced by both implicit and explicit attitudes, whereas others question the IAT as a measure of attitudes, proposing for example that the IAT measures the familiarity or saliency of stimuli rather than attitudes (e.g. response times may be faster for the negative words-hearing aid grouping due to hearing aids and negative words being less familiar and more salient for some observers; but see Greenwald et al. Citation2005 for evidence against this interpretation). There are also differing views as to whether knowledge of cultural norms is a construct-valid or contaminant component of the IAT (see Uhlmann, Poehlman, and Nosek Citation2012 for a summary). Exploring the many factors that contribute to the ongoing debates regarding how best to interpret and label the construct measured by the IAT was beyond the scope of the present study.
In contrast to the IAT, the explicit measure (photo rating) did not reveal significant hearing aid effects for perceived age, attractiveness, or intelligence. That is, the presence or absence of a hearing aid in a picture was not significantly related to the latter variables. The lack of a hearing aid effect for the picture rating measure is inconsistent with some of the initial hearing aid effect studies conducted in the 70s and 80s, but is consistent with Rauterkus and Palmer (Citation2014) who did not find a hearing aid effect for younger adults. Rauterkus and Palmer (Citation2014) interpreted a lack of a hearing effect to indicate that negative perceptions of hearing are significantly reduced or no longer exist. However, a more recent study (Qian et al. Citation2021) found evidence that the hearing aid effect still exists. They used a picture rating task to measure children and adults’ perceptions of a child who wears hearing aids and found that both participant groups rated a child pictured wearing a hearing aid as less athletic, confident, healthy, and less of a leader, than the same child pictured without a hearing aid. Continuing to explore interactions between the age of an observer, and the age of a hearing aid wearer, including paediatric populations, is therefore an important avenue for future research.
The inconsistency in results between the photo rating measure and implicit IAT measure is, however, consistent with the broader IAT literature. That is, across a variety of IATs, correlations between explicit and implicit attitude measures are typically low and nonsignificant (e.g. Axt, Ebersole, and Nosek Citation2014; Hummert et al. Citation2002). These results have been used to support the theory that the IAT and explicit self-report measures address distinct dimensions of social cognition.
As expected, older participants’ self-reported Hearing Disability was significantly negatively related to OA-IAT performance. That is, older adults with higher scores on the hearing disability measure (i.e. poorer hearing) showed slower response times when older adults wearing hearing aids were paired with negative words in comparison to positive words. Considering the implicit attitudes interpretation of the IAT, this finding would suggest that experiencing age-related hearing loss (without wearing a hearing aid) may positively influence implicit attitudes of older adults who wear hearing aids. Further investigation is needed to determine how hearing disability interacts with the age of a hearing aid user to influence perceptions and behaviour (e.g., hearing aid uptake). For example, future work with a larger sample size could analyse the IAT data separately for adults who score >9 on the HHIE (indicating some hearing disability) relative to those that score ≤8 (indicating no, or very minimal, hearing disability) (Lichtenstein, Bess, and Logan Citation1988).
Results from the Hearing Aid Stigma questionnaire indicated low perceived stigma for both age groups; however, this finding could be influenced by what participants suspected was the most socially acceptable response or the simple yes-no response structure of the questionnaire items resulting in a small response range (0-4). Although ageism was stronger for older than younger participants, the hypotheses that Hearing Aid Stigma and Ageism would not be significantly correlated with the OA-IAT or YA-IAT was supported. This finding is consistent with work that has tested the relationship between explicit ageism measures and the Age-IAT. In the context of the Age-IAT, non-significant correlations have been used to support the argument that the IAT measures a more implicit attitudinal construct than self-report items. In addition, for the current study, the lack of significant correlations was likely due to the minimal variability in participants’ responses to these questionnaires. For example, for the Hearing Aid Stigma items, more than half of younger and older participants had a total score of 1 (indicating low self-reported stigma). Furthermore, in contrast to research using the wheelchair and disability versions of the IAT, we did not find that exposure to hearing aids or general technology (i.e., ear buds/computers) was predictive of performance on the hearing aid IAT. Exploring hearing aid stigma and exposure questionnaire items that have the capacity to produce a greater response range would be important to test in the future.
Limitations and future directions
The current study was conducted online due to COVID-19 protections, and therefore, we were not able to conduct a comprehensive audiological assessment. Participants did, however, complete the HHIE/A, which has been shown to reliably predict the severity of hearing disability (Lichtenstein, Bess, and Logan Citation1988). Future research should examine how behavioural measures of hearing loss severity (e.g., pure tone audiometry) relate to older adults’ perceptions of hearing aid users.
Future research is also needed to investigate whether performance on a hearing aid version of the IAT predicts intentions to wear a hearing aid, hearing aid uptake, and/or particular styles of communication behaviour with individuals who wear hearing aids. Health Psychology research with a focus on physical activity, for example, has demonstrated that performance on a physical activity IAT is associated with intentions to participate in physical activity, as well as physical activity levels measured via self-report and accelerometers (see Schinkoeth and Antoniewicz Citation2017 for a review).
As the photo stimuli for the current study showed humans wearing hearing aids, which suggests that these people experience hearing loss, it is possible that perceptions of either hearing loss or hearing aids could have influenced participants’ responses. Future research should attempt to differentiate attitudes towards hearing loss, individuals who wear hearing aids, and hearing aids alone, as stigma for each of these factors may differ (Hickson et al. Citation2022). Although existing research suggests consistent IAT results regardless of which 14 (out of 64) word stimuli are used, future research could also test whether using different positive and negative words affects the hearing aid IAT results. Finally, as our stimuli used an In-The-Ear style hearing aid, future research could examine older and younger adults’ perceptions of different styles of hearing aids as well as hearables and earbuds. Almufarrij et al. (Citation2019), for example, found that modern Behind-The-Ear devices were rated the most cosmetically appealing (and least visible) in comparison to a variety of direct-to-consumer hearing devices. It would be interesting to test if indirect evaluations of these devices would be consistent with Almufarrij et al.’s (Citation2019) self-report ratings; however, this may be challenging to assess with the IAT method, as the stimuli for the IAT should be clearly visible for observers, which may not be the case for modern Behind-The-Ear devices with slim tubing.
Conclusions
In summary, the photo rating task did not show a significant hearing aid effect for perceived age, attractiveness, or intelligence, indicating neutral explicit attitudes towards aided and unaided, younger and older adults. The IAT task did reveal a significant hearing aid effect, with one interpretation of this result suggesting that younger and older adults may hold negative implicit attitudes towards both older and younger hearing aid users. As the line between hearing aid and earbud is blurring, and it is increasingly common for people to wear earbuds on a regular basis, it will be important to evaluate how perceptions of individuals who wear different styles of hearing technology, as well as hearing aid and hearable uptake rates, may change over time.
Financial disclosures
This study was funded by a research stipend awarded to Jeff Small, PhD from the Faculty of Medicine, University of British Columbia. The authors do not hold conflicts of interest.
Supplemental Material
Download MS Word (30.5 KB)Data availability statement
The data that support the findings of this study are available from the corresponding author, JB, upon reasonable request.
References
- Almufarrij, I., K. J. Munro, P. Dawes, M. A. Stone, and H. Dillon. 2019. “Direct-to-consumer hearing devices: Capabilities, costs, and cosmetics.” Trends in Hearing 23:2331216519858301. https://doi.org/10.1177/2331216519858301
- Axt, J. R., C. R. Ebersole, and B. A. Nosek. 2014. “The rules of implicit evaluation by race, religion, and age.” Psychological Science 25 (9):1804–1815. https://doi.org/10.1177/0956797614543801
- Blood, G. W., I. M. Blood, and J. L. Danhauer. 1977. “The hearing aid “effect.” Hearing Instruments 28 (6):12.
- Chopik, W. J., and H. L. Giasson. 2017. “Age differences in explicit and implicit age attitudes across the life span.” The Gerontologist 57 (suppl_2):S169–S177. https://doi.org/10.1093/geront/gnx058
- Chowdhury, T. I., S. M. S. Ferdous, and J. Quarles. 2019. “VR disability simulation reduces implicit bias towards persons with disabilities.” IEEE Transactions on Visualization and Computer Graphics 27 (6):3079–3090. https://doi.org/10.1109/TVCG.2019.2958332
- Cienkowski, K. M., and V. Pimentel. 2001. “The hearing aid ‘effect’ revisited in young adults.” British Journal of Audiology 35 (5):289–295. https://doi.org/10.1080/00305364.2001.11745247
- Danhauer, J., A. Mulac, and I. Eve. 1985. “Health care providers’ and peers’ impressions of elderly hearing aid wearers.” The American Journal of Otology 6 (2):146–149.
- David, D., and P. Werner. 2016. “Stigma regarding hearing loss and hearing aids: A scoping review.” Stigma and Health 1 (2):59–71. https://doi.org/10.1037/sah0000022
- Ebner, N. C. 2008. “Age of face matters: Age-group differences in ratings for young and old faces.” Behavior Research Methods 40 (1):130–136. https://doi.org/10.3758/BRM.40.1.130 PMID: 18411535
- Franks, I., and B. H. Timmer. 2023. “Reasons for the non-use of hearing aids: perspectives of non-users, past users, and family members.” International Journal of Audiology . https://doi.org/10.1080/14992027.2023.2270703
- Galli, G., B. Lenggenhager, G. Scivoletto, M. Molinari, and M. Pazzaglia. 2015. “Don’t look at my wheelchair! The plasticity of longlasting prejudice.” Medical Education 49 (12):1239–1247. https://doi.org/10.1111/medu.12834
- Greenwald, A. G., and B. A. Nosek. 2001. “Health of the Implicit Association Test at age 3.” Zeitschrift Fur Experimentelle Psychologie: Organ Der Deutschen Gesellschaft Fur Psychologie 48 (2):85–93. https://doi.org/10.1026//0949-3946.48.2.85
- Greenwald, A. G., and C. K. Lai. 2020. “Implicit social cognition.” Annual Review of Psychology 71 (1):419–445. https://doi.org/10.1146/annurev-psych-010419-050837
- Greenwald, A. G., B. A. Nosek, and M. R. Banaji. 2003. “Understanding and using the implicit association test: I. An improved scoring algorithm.” Journal of Personality and Social Psychology 85 (2):197–216. https://doi.org/10.1037/0022-3514.85.2.197
- Greenwald, A. G., B. A. Nosek, M. R. Banaji, and K. C. Klauer. 2005. “Validity of the salience asymmetry interpretation of the Implicit Association Test: Comment on Rothermund and Wentura (2004).” Journal of Experimental Psychology. General 134 (3):420–425. https://doi.org/10.1037/0096-3445.134.3.420
- Greenwald, A. G., D. E. McGhee, and J. L. Schwartz. 1998. “Measuring individual differences in implicit cognition: the implicit association test.” Journal of Personality and Social Psychology 74 (6):1464–1480. https://doi.org/10.1037//0022-3514.74.6.1464
- Hickson, L., K. Ekberg, B. Timmer, N. Scarinci, M. Waite, C. Meyer, and M. Nickbakht., August 2022. “To tell or not to tell: The stigma experiences of adults with hearing loss and their families.” Oral presentation at the International Hearing Aid Research Conference, Tahoe City, California.
- Hummert, M. L., T. A. Garstka, L. T. O'Brien, A. G. Greenwald, and D. S. Mellott. 2002. “Using the implicit association test to measure age differences in implicit social cognitions.” Psychology and Aging 17 (3):482–495. https://doi.org/10.1037//0882-7974.17.3.482
- IAT Corp. 2022. April 6. Take a demo test. Implicit Association Test. https://implicit.harvard.edu/implicit/canada/selectatest.jsp
- Iler, K. L., J. L. Danhauer, and A. Mulac. 1982. “Peer perceptions of geriatrics wearing hearing aids.” The Journal of Speech and Hearing Disorders 47 (4):433–438. https://doi.org/10.1044/jshd.4704.433
- Jenstad, L., and J. Moon. 2011. “Systematic review of barriers and facilitators to hearing aid uptake in older adults.” Audiology Research 1 (1):e25. https://doi.org/10.4081/audiores.2011.e25
- Lichtenstein, M. J., F. H. Bess, and S. A. Logan. 1988. “Diagnostic performance of the hearing handicap inventory for the elderly (screening version) against differing definitions of hearing loss.” Ear and Hearing 9 (4):208–211. doi: https://doi.org/10.1097/00003446-198808000-00006
- Manzi, C., R. Adorni, G. Di Cicco, V. Milano, E. Manunta, F. Montermini, M. Becker, and P. Steca. 2022. “Implicit and explicit attitudes toward hearing aids: The role of media language.” Journal of Language and Social Psychology 41 (2):171–190. https://doi.org/10.1177/0261927X211009292
- McDonnall, M. C., J. L. Cmar, K. Antonelli, and K. M. Markoski. 2019. “Professionals’ implicit attitudes about the competence of people who are blind.” Journal of Visual Impairment & Blindness 113 (4):341–354. https://doi.org/10.1177/0145482X19865391
- Minear, M., and D. C. Park. 2004. “A lifespan database of adult facial stimuli.” Behavior Research Methods, Instruments, & Computers: a Journal of the Psychonomic Society, Inc 36 (4):630–633. https://doi.org/10.3758/bf03206543
- Nasreddine, Z. S., N. A. Phillips, V. Bédirian, S. Charbonneau, V. Whitehead, I. Collin, J. L. Cummings, and H. Chertkow. 2005. “The Montreal Cognitive Assessment, MoCA: A brief screening tool for mild cognitive impairment.” Journal of the American Geriatrics Society 53 (4):695–699. https://doi.org/10.1111/j.1532-5415.2005.53221.x
- Nosek, B. A., F. L. Smyth, J. J. Hansen, T. Devos, N. M. Lindner, K. A. Ranganath, C. T. Smith, K. R. Olson, D. Chugh, A. G. Greenwald, et al. 2007. “Pervasiveness and correlates of implicit attitudes and stereotypes.” European Review of Social Psychology 18 (1):36–88. https://doi.org/10.1080/10463280701489053
- Peirce, J. W., J. R. Gray, S. Simpson, M. R. MacAskill, R. Höchenberger, H. Sogo, E. Kastman, and J. Lindeløv. 2019. “PsychoPy2: Experiments in behavior made easy.” Behavior Research Methods 51 (1):195–203. https://doi.org/10.3758/s13428-018-01193-y
- Qian, Z. J., B. A. Nuyen, C. K. Kandathil, M. T. Truong, M. S. Tribble, S. P. Most, and K. W. Chang. 2021. “Social perceptions of pediatric hearing aids.” The Laryngoscope 131 (7):E2387–E2392. https://doi.org/10.1002/lary.29369
- Rauterkus, E. P., and C. V. Palmer. 2014. “The hearing aid effect in 2013.” Journal of the American Academy of Audiology 25 (9):893–903. https://doi.org/10.3766/jaaa.25.9.10
- Rothermund, K., and D. Wentura. 2004. “Underlying processes in the implicit association test: dissociating salience from associations.” Journal of Experimental Psychology. General 133 (2):139–165. https://doi.org/10.1037/0096-3445.133.2.139
- Sahai, H., and M. I. Ageel. 2000. The Analysis of Variance: Fixed, Random, and Mixed Models. Boston: Birkhäuser.
- Schinkoeth, M., and F. Antoniewicz. 2017. “Automatic evaluations and exercising: Systematic review and implications for future research.” Frontiers in Psychology 8:2103. https://doi.org/10.3389/fpsyg.2017.02103
- Southall, K., J. P. Gagné, and M. B. Jennings. 2010. “Stigma: A negative and a positive influence on help-seeking for adults with acquired hearing loss.” International Journal of Audiology 49 (11):804–814. https://doi.org/10.3109/14992027.2010.498447
- Steffens, M. C. 2004. “Is the Implicit Association Test Immune to Faking?” Experimental Psychology 51 (3):165–179. https://doi.org/10.1027/1618-3169.51.3.165
- Tse, C. S., and J. Altarriba. 2014. “The relationship between language proficiency and attentional control in Cantonese-English bilingual children: evidence from Simon, Simon switching, and working memory tasks.” Frontiers in Psychology 5:954. https://doi.org/10.3389/fpsyg.2014.00954
- Uhlmann, E. L., T. A. Poehlman, and B. A. Nosek. 2012. “Automatic associations: Personal attitudes or cultural knowledge.” In Ideology, Psychology, and Law. New York, NY: Oxford University Press.
- Ventry, I. M., and B. E. Weinstein. 1983. “Identification of elderly people with hearing problems.” American Speech-Language Hearing Association 25 (7):37–42.
- Walden, T. A., and T. A. Lesner. 2018. “Examining implicit and explicit attitudes toward stuttering.” Journal of Fluency Disorders 57:22–36. https://doi.org/10.1016/j.jfludis.2018.06.001
- Wechsler, D. 1981. Adult Intelligence Scale- revised. New York: Psychological Corporation.
- Wheeler, L. R., and A. M. Tharpe. 2020. “Young children’s attitudes toward peers who wear hearing aids.” American Journal of Audiology 29 (2):110–119. https://doi.org/10.1044/2019_AJA-19-00082
- Wilson, M. C., and K. Scior. 2014. “Attitudes towards individuals with disabilities as measured by the Implicit Association Test: A literature review.” Research in Developmental Disabilities 35 (2):294–321. https://doi.org/10.1016/j.ridd.2013.11.003
- World Health Organization. 2018. Addressing the rising prevalence of hearing loss. World Health Organization Press. https://apps.who.int/iris/bitstream/handle/10665/260336/9789241550260-eng.pdf
- Yap, B. W., and C. H. Sim. 2011. “Comparisons of various types of normality tests.” Journal of Statistical Computation and Simulation 81 (12):2141–2155. https://doi.org/10.1080/00949655.2010.520163