
 ?Mathematical formulae have been encoded as MathML and are displayed in this HTML version using MathJax in order to improve their display. Uncheck the box to turn MathJax off. This feature requires Javascript. Click on a formula to zoom.
Abstract
This study examined the impact of two questionnaire characteristics, scale position and questionnaire length, on the prevalence of random responders in the TIMSS 2015 eighth-grade student questionnaire. While there was no support for an absolute effect of questionnaire length, we did find a positive effect for scale position, with an increase of 5% in random responding over the course of the questionnaire (in both the shorter and the longer version). However, scale character turned out to be an unexpected but more important determinant. Scales about students’ confidence in mathematics or science showed an increase of 9% in random responding, which is double the impact of scale position. Potential mechanisms underlying the confidence case and general implications of the results for questionnaire design are discussed.
Survey answers can be distorted by construct-irrelevant factors that influence response behavior. A potential measurement validity problem arises here as the corresponding scale scores might no longer accurately reflect knowledge, abilities, or opinions related to the survey content (e.g., Cronbach, Citation1950; Messick, Citation1984). A prominent contextual factor that tends to trigger such invalid response behavior is a low-stakes-low-effort context. This context characterizes most international large-scale educational assessments such as IEA’s Trends in International Mathematics and Science Study (TIMSS) or OECD’s Programme for International Student Assessment (PISA). For students participating in these types of assessments, there are no personal consequences linked to their responses on the assessment, and hence, students might not always respond accurately or thoughtfully, but instead shift to responding with the lowest effort (e.g., Curran, Citation2016; Eklöf, Citation2010).
In the current study, we will specifically focus on random responding, which is one type of response behavior that is considered a typical expression of this low-stakes-low-effort context where students provide “responses without meaningful reference to the test questions” (Berry et al., Citation1992, p. 340). Specifically, using TIMSS 2015 as a case study, we will investigate the prevalence of random responders among the students across the different scales of the TIMSS eighth-grade student questionnaire and in the different participating countries. Profiting from the large-scale of the TIMSS study and the natural variation in questionnaire version among countries, the potential impact of two construct irrelevant external factors, scale position and questionnaire length, on random responding will be explored.
Questionnaire characteristics in context: Scale position × questionnaire length
Scale position
One of the most common risk factors that has been hypothesized to influence response quality is item position. In the context of low-stakes assessments in the personality and survey literature, invalid response behavior appears to become more frequent near the end of the questionnaire, regardless of the specific content of the items considered (Bowling et al., Citation2021; Galesic & Bosnjak, Citation2009). With respect to random responding, rapid-guessing research provides an example of the specific impact of item position on this type of behavior. The underlying idea is that when responses are given too fast, students have not been able to accurately reflect on the given questions and the “answers given during rapid-guessing are essentially random” (Wise & Kong, Citation2005, p.167). Consequently, their responses are no longer reflective of their true knowledge or abilities. For achievement tests, rapid guessing studies have shown that items located closer to the end of the assessment tend to receive more random responses overall (e.g., Wise et al., Citation2009).
Although most research has focused on item-level position effects, every extra scale added to a questionnaire can be seen as an additional group of items that need to be answered. Hence, a position effect would naturally extend to the scale level as well. For example, in a small-scale study with university students, Merritt (Citation2012) included one additional scale on affective commitment to a questionnaire, either at the beginning or the end. It was found that placing the scale at the end of the questionnaire resulted in more invalid responding. Similarly, when looking at two blocks of items of differing contents (i.e., numeracy and literacy) in an educational achievement test, Goldhammer et al. (Citation2017) found, for both blocks, that when presented in the first versus second part of the assessment, more invalid response behavior was observed in the latter position. As students progress through the questionnaire, they can be prone to experience, for example, boredom, disinterest, inattentiveness, or fatigue, and as a consequence, provide responses that are no longer accurate or thoughtful.
Hypothesis 1. Scales at a later position in the questionnaire display a higher prevalence of random responders compared to scales at an earlier position.
Questionnaire length
Based on the notion of similar underlying mechanisms, a second potential risk factor that has been put forward is questionnaire length (e.g., Meade & Craig, Citation2012). However, the literature shows mixed results with respect to the relation between questionnaire length and response quality. Herzog and Bachman (Citation1981) used two types of questionnaires in their study, a short 45-minute version and a long 2-h version, and found higher levels of overly uniform responding in the longer questionnaire. In a similar fashion, longer internet surveys were characterized by lower completion rates (e.g., Deutskens et al., Citation2004; Galesic & Bosnjak, Citation2009). In contrast, Boe et al. (Citation2002) found that the ‘persistence to respond’ to the TIMSS 1995 student questionnaire, as measured by the percentage of missing responses across the entire questionnaire, was not significantly related to the length of the administered questionnaire. Furthermore, in a set of small-scale studies with university students, Gibson and Bowling (Citation2020) showed that the influence of questionnaire length for personality assessments is dependent on the context of questionnaire administration and on the operationalization or detection method for invalid response behavior. Even though the literature is not unanimously in agreement, we would still expect that a longer questionnaire length coincides with more random responding overall, even in the TIMSS student questionnaire: “among the few documented problems detected by the national monitors were students complaining about the length of the Student Questionnaire” (Martin et al., p.6.19).
Hypothesis 2. Longer questionnaires display a higher prevalence of random responders compared to shorter questionnaires.
Position × length
The final external factor that we will take into consideration is the interplay between scale position and questionnaire length. Wise et al. (Citation2009) for example wondered whether adjustments to questionnaire length might be sufficient to counteract the observed position effects. Yet current literature shows that it is hard to pinpoint a generic criterion for the optimal length of a questionnaire as this would among other things depend on the amount of invalid response behavior that is considered acceptable, as well as on more pragmatic contextual factors (e.g., the context of administration) (Bowling et al., Citation2021). In addition, invalid response behavior appears related to questionnaire length or the number of questions overall. For example, Deutskens et al. (Citation2004) not only found that fewer respondents are finishing an internet survey as it gets longer, but that the respondents would finish less of the longer questionnaire percent-wise. Hence, respondents’ subjective perception of questionnaire length and the pace at which they proceed through the questionnaire might actively moderate potential position effects. A longer questionnaire might drain a respondent’s resources at a faster pace by sheer negative anticipation for what’s still waiting ahead. Note that this would imply a synergistic interaction between scale position and questionnaire length.
Hypothesis 3. In longer questionnaires, scales at a later position in the questionnaire display an even higher prevalence of random responders compared to scales at an earlier position, than in a shorter questionnaire.
The current study
When studying the impact of scale position and questionnaire length on random response behavior, an ideal setup would be a large-scale experimental design. With such a design we would be able to manipulate the two external content-irrelevant factors under controlled scale-content conditions, randomize thousands of high school students across the experiment, and administer the resulting questionnaire versions under low-stakes conditions. Yet, such an extensive experiment might not be a realistic endeavor. As illustrated in the previous subsection, studies in the literature are mostly based on (i) personality questionnaires administered to relatively small convenient samples of university students in typical Western countries, (ii) on internet surveys with somewhat larger but still nonrandom samples of participants, or (iii) on achievement tests in combination with response-time data (cf. rapid guessing). Simply extrapolating the evidence base from these types of study designs and contexts to random responding on low-stakes questionnaires for high school students in large-scale educational assessments in a more international context seems not warranted. Thus, more specific tailored research is needed to answer our research questions.
Here, we will be using the eighth-grade student questionnaire of the Trends in International Mathematics and Science Study (TIMSS) 2015 as a specific case study. Profiting from the large-scale of TIMSS, the study has large representative random samples of eighth-grade students in each of the participating countries. This large-scale sample feature brings along extra generalization support and potential systematic country variation that can be of interest to educational stakeholders. Furthermore, the TIMSS 2015 student questionnaire provides natural variation in scale position and questionnaire length across countries as two versions of the questionnaire were administered. The specific version that was administered in a country depended on the structure of the science curriculum program taught by that country. The student questionnaire under the separated science program is much longer than under the integrated science program (i.e., respectively 19 and 10 scales beyond basic demographics/background information). The order of the scales in each version remains constant across administrations and the first 6 scales and the last scale of both versions were similar for all students. Furthermore, most scales had a similar setup with respect to question format and answer alternatives, with some being replicates if it were not for subject domain differences (e.g., confidence in biology or confidence in chemistry). All these features allow for studying random response behavior as a function of the two content-irrelevant factors of interest: scale position and questionnaire length.
Note that there are no response times available for the student questionnaire (so far, these have typically only been available for the achievement tests part of the international large-scale assessments), and hence popular rapid guessing methodology to identify random responders is not an option. Self-report data or convincing psychological effort-related proxies are also lacking. Instead, we will rely on an operationalization of random response behavior by van Laar and Braeken (Citation2022) that is directly based on the questionnaire responses given at scale level. This operationalization uses a mixture item response theory (IRT) approach (for a review, see Sen & Cohen, Citation2019) to explicitly model the possibility of two underlying yet unobserved groups in the population, students engaging in regular response behavior versus students engaging in invalid random response behavior across the items of a scale.
Method
The data that will be used comes from the Trends in International Mathematics and Science Study 2015 cycle. TIMSS is an international large-scale educational assessment used to monitor mathematics and science achievement among representative samples of fourth- and eighth-grade students across different countries. Besides the achievement measures, TIMSS also collects information about the home, school, and classroom context for learning. As mentioned before, in the current study we focus on the non-achievement part of the assessment, with a specific focus on the student questionnaire. Besides some basic demographics and background information, the main focus of the student questionnaire lies with students’ attitudes toward learning mathematics and science (Mullis & Martin, Citation2013).
Assessment duration
For the eighth grade, the achievement test of TIMSS consisted of two sections (i.e., focus on mathematics or science). For each of these sections the testing time was set at 45 min with a 30-minute break in between (e.g., Mullis & Martin, Citation2013). Only after a second break, the student questionnaire was administered as a third section. The student questionnaire was administered to every student that took part in the TIMSS 2015 achievement test. The testing time for the student questionnaire was set at 30 min. The total testing time for an eighth-grade student in the TIMSS 2015 assessment (i.e., all 3 sections) is then 120 min in total plus the time for the two breaks (Mullis & Martin, Citation2013). Students were not allowed to leave the room or start with a new section even if they had already completed the task within the set time frame (Martin et al., Citation2016). Hence, there is no reward for rushing through the assessment as students had to remain seated in class and everyone also gets the same break time.
Student questionnaire length
For the eighth grade, there are two versions of the student questionnaire. The version that is administered depends on the science curriculum program within a country. One version is for countries teaching science as a single or general subject (i.e., integrated science program), while the other version is for countries teaching science as separate subjects (i.e., separated science program). This distinction between the science programs also comes with natural variation in questionnaire length as implied by the different number of survey scales within the specific versions of the questionnaire. The separated science program has the longer questionnaire (i.e., 19 scales) with an additional 9 scales compared to the student questionnaire for the integrated science program (i.e., 10 scales).
Student questionnaire scales
The student questionnaires contain survey scales related to the following domains: school climate for learning, school safety, and student engagement and attitudes toward mathematics or science (Martin et al., Citation2016) (for information on the specific scales see ). The three scales affected by the structure of the science program are the “Students Like Learning Science”, “Students’ View on Engaging Teaching in Science Lessons” and “Students Confident in Science” scales. For countries with an integrated science program, each of these scales only appears once, while for countries with a separated science program each of these scales is available for each science domain separately (i.e., in order of appearance: Biology, Earth Science, Chemistry, and Physics). The science scales in both student questionnaires do have the same structure. For the items in the separated student questionnaire, it is just the word ‘science’ that is replaced by the name of the specific science domain (e.g., ‘I enjoy learning science’ vs ‘I enjoy learning chemistry’).
Table 1. Overview of scales in the TIMSS 2015 student questionnaire.
The set of scales contains between 7 and 10 items for each scale, for which a student needed to indicate to what extent s/he agrees with the given statement or indicate how often a specific situation has occurred to them on a 4-point Likert scale, ranging from 1 (agree a lot or at least once a week) to 4 (disagree a lot or never).
Scale position
Scale position is defined by the order in which the survey scales appear in the student questionnaire. Starting at position zero is the first substantive scale (i.e., students’ sense of school belonging) that followed after 14 more general questions about students’ background. After this first scale, the other survey scales followed in succession in the questionnaire. An overview of the survey scales and their position in each version of the student questionnaire can be found in .
TIMSS sample: countries
All 40 regular participating countries that administered the eighth-grade TIMSS assessment in 2015 or 2016 have been included in the analyses. Note that some countries used the opportunity to administer the TIMSS assessment to the ninth grade instead of the regular eighth grade for better comparability with curricula (i.e., Botswana and South Africa), for better comparability of results with other countries (i.e., Norway) or to better match the TIMSS age criteria (i.e., England and New Zealand) (e.g., Martin et al., Citation2016). Of the included countries, 29 teach an integrated science program, while the other 11 countries teach a separated science programFootnote1. In what follows, we will refer to the countries by the ISO country codes as used in the TIMSS data files (see also footnote 1).
Prevalence of random responders
A mixture item response theory model framework (Mislevy & Verhelst, Citation1990; Sen & Cohen, Citation2019; Yamamoto, Citation1989) was adopted to operationalize and define the target outcome variable of interest PREV(RR), the prevalence of random responders on a particular survey scale. The approach by van Laar and Braeken (Citation2022) assumes that there are two distinct, yet unobserved latent groups of responders in the population expressing different response behavior on a survey scale: regular or nonrandom responders and random responders (see ).
Figure 1. Mixture IRT model Framework to Define and Operationalize Random Responders in terms of Independence and Uniformity of Item Responses.Note. Symbols follow standard path diagram conventions, with squares representing observed variables (i.e., item responses); circles, latent variables (i.e., a trait to be measured by the scale of items); arrows indicating dependence relations; vertical lines, response category thresholds. Reprinted under the terms of CC-BY-NC from “Random responders in the TIMSS 2015 student questionnaire: A threat to validity?” by S. van Laar & Braeken, Citation2022, Journal of Educational Measurement.
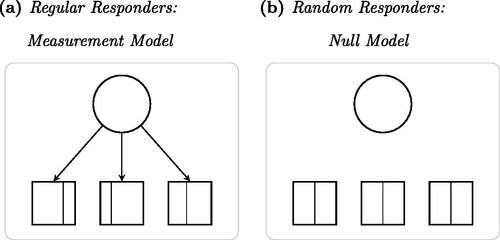
The regular responders are expected to respond consistently according to their own opinions and beliefs related to the questionnaire content of the items on the scale, in line with a traditional latent variable measurement model (see , the ‘circle’ is the common cause of the ‘squares’) such as the graded response model (Samejima, Citation1969). In contrast, the random responders are expected to provide responses that do not reflect their opinions and beliefs, but are more haphazard, in line with a null model implying independent item responses that have an equal chance of falling in either of the possible response categories (see , the ‘squares’ are mutually disconnected, nor influenced by the ‘circle’; all squares are divided into uniformly equal category parts).
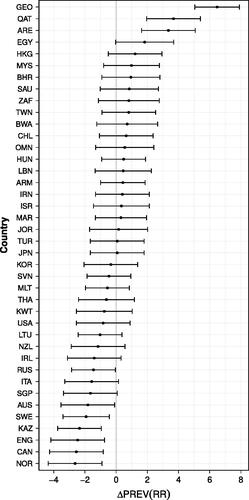
Figure 2. Differences in Prevalence of Random Responders across Countries.Note. The vertical gray line represents the prevalence of random responders for an average country on an average scale under the baseline model (
. The black horizontal lines are 95% confidence intervals of the country-specific deviations in prevalence (ΔPREV(RR)) to that average.
Under the mixture IRT model, the likelihood of a person p’s item response pattern (see EquationEquation 1
(1)
(1) ) is written as a weighted sum of the two mentioned model expressions: (i) the joint probability of the observed item response pattern given the person’s latent trait value under the graded response model multiplied by
the prior probability for a person to be a member of the regular responder group plus (ii) the joint probability of the observed item response pattern under the null model multiplied by
the prior probability for a person to be a member of the random responder group.
(1)
(1)
Although seemingly much more complex, this mixture model in fact has only one additional parameterFootnote2 when compared to the regular measurement model. This parameter can be interpreted as a model-based estimate of the prevalence of random responders on the survey scale for the item response data the mixture model is applied to.
Thus, this mixture IRT model was estimated for each of the scale-country combinations in the current study. The resulting estimates for the mixture weight will be used as an estimate of the prevalence of random responders on the survey scale for that country, and hence is the actual outcome variable PREV(RR) for further analyses targeting our core research questions. If the mixture model for a specific country-scale combination failed either of two quality checks, the corresponding outcome was set to missing. First, the measurement model for the regular responders in the mixture was inspected to ensure that it reflected a clean unidimensional model (i.e., compatible with the assumed common trait for the survey scale). This criterion was not met when two or more standardized item discrimination parameters (i.e., factor loadings) were below .40. Secondly, a classification entropy of at least .70 was required to ensure that the mixture model was able to provide a good enough distinction between the two latent groups of responders. To further assess model adequacy we gathered model comparison evidence using BIC and BIC weights (Nylund et al., Citation2007; Wagenmakers & Farrell, Citation2004) contrasting the null model with the graded response model and the mixture IRT model.
Statistical analysis
A cross-classified linear mixed model approach was adopted to investigate how the prevalence of random responders on a survey scale varied as a function of the scale’s position in the questionnaire and the length of the student questionnaire it is part of. The study design has a cross-classified cluster structure as multiple prevalence estimates are observed within each country (i.e., across scales), but also for each survey scale multiple prevalence estimates are observed (i.e., across countries). As a consequence, the outcome variable in the model is the random responder prevalence for a given country c on a given scale s, reflecting the countries-by-scales cross-classification. A series of five models was fitted to investigate the main research questions. As a baseline model we used a varying-intercepts model (
) capturing variation in the prevalence of random responders across countries and scales, accounting for the heterogeneity and dependence structure implied by the cross-classified study design:
(2)
(2)
The general intercept β0 reflects the average expected prevalence of random responders for an average country on an average scale. The country-varying (random) intercept and scale-varying (random) intercept
allow for a systematic deviation in the prevalence for a specific country c or specific scale s, respectively. The residual
allows for unexpected deviations in prevalence for a specific country-scale combination not accommodated by both country and scale main effects in the model.
Our core research questions would imply that when adding scale position and questionnaire length as predictors to this model, variation in both features would be related to the systematic variation in the prevalence of random responders across scales (i.e., ). Hence, the four models building on the presented baseline model will incrementally add both predictors (and their interaction) to the equation. The percentage of systematic variation in the prevalence of random responders among the survey scales that is accounted for by the predictors (i.e.,
) will be used as a general effect size measure for each model.
Statistical software
The mixture IRT models were estimated using Mplus Version 8.2 (Muthén & Muthén, 1998–Citation2017) through the MplusAutomation package for R version 0.7-3 (Hallquist & Wiley, Citation2018) (for an example of Mplus syntax see Appendix A). We used full-information maximum likelihood estimation with robust standard errors and the expectation-maximization acceleration algorithm with a standard of 400 random starts, 100 final stage optimizations, and 10 initial stage iterations. Mixture model estimates accounted for the TIMSS sampling design through the total student weights. The cross-classified mixed models were estimated using the lme4 package for R version 1.1-27 (Bates et al., Citation2015). As recommended by Snijders and Bosker (Citation2012) we used residual maximum likelihood estimation for the model parameters, but maximum likelihood estimation for model comparison inference by means of likelihood ratio tests. All analysis scripts were run under R version 4.0.0 (R Core Team, Citation2020).
Results
Descriptives
Data. Given that 29 countries teach an integrated science program and 11 countries teach a separated science program the study started with 499 country-scale combinations. However, prevalence estimates are not available for all combinations. For 7 combinations this was related to data collection procedures (i.e., the scale was not administered or the data is not available for public use), while 35 combinations did not fulfill the mixture model quality checks (for an overview see ). Together, this results in an effective sample size of 457 country-scale combinations for further analyses. Across all 457 combinations, the null model is never supported (BIC weight = 0 for all, average BIC = 145747) and the model comparison evidence is close to unanimously in favor of the mixture IRT model (average BIC = 90608; BIC weight = 1 for 435 combinations). The the regular graded response model (average BIC = 91855) was only favored in 13 combinations (all representing the ‘Student bullying’ scale with prevalence estimates below 1%). On average 93% (range: 70–100%) and 89% (range: 47–100%) of the scales have an effective prevalence estimate for countries with an integrated science and a separated science program structure, respectively. For survey scales shared by both science programs, prevalence estimates are available for 95% (75–100%) of the countries; for scales unique to the integrated science and separated science programs, this comes down to 90% (69–100%) and 85% (73–100%) of the corresponding countries, respectively. In sum, we have a solid empirical basis for further analyses.
Table 2. Overview of the number of excluded scales: Data collection procedures and/or lack of scale quality.
Baseline model 
The estimated prevalence of random responders on an average scale ranged from 6.3% to 15.4% () across countries. The estimated prevalence for an average country ranged from 1.9% to 20.2% (
) across scales. The variation in prevalence (
) was primarily due to systematic differences between scales (
, 67% of the total variance) and only to a lesser extent to systematic differences between countries (
, 10% of the total variance).
The systematic variation in the prevalence of random responders and how it relates to scale position and questionnaire length will be discussed in the next subsection, but first the systematic variation across countries will be briefly addressed. The expected prevalence of random responders for an average country on an average scale was estimated to be about . Yet on average, Georgia, Qatar, and Armenia showed higher levels of random responders across scales, while Russia, Australia, Sweden, Kazakhstan, England, Canada, and Norway tend to show lower levels (see ).
It was expected that survey scales at a later position would display higher prevalence rates. The model results (see ) indicated that the expected difference in prevalence rate as a function of differences in scale position was positive, yet not significantly different from zero (). The longer questionnaire was expected to display higher prevalence rates, yet no empirical support was found for this hypothesis (
). Considering both scale position and questionnaire length jointly as predictors in the model, led to similar results (
), and no support for the hypothesized synergistic interaction was found either (
).
Table 3. Cross-classified mixed models of the prevalence of random responders as a function of scale position and questionnaire length.
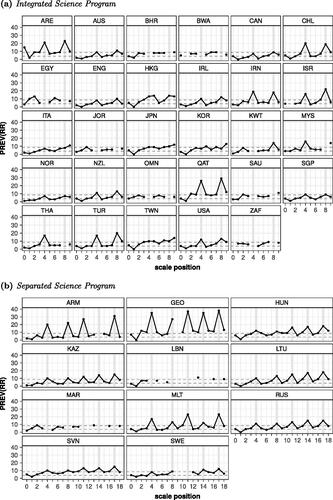
Overall these results were not in line with expectations. However, when visualizing the data, an unexpected but impactful factor for the prevalence of random responders appears (see ). The black lines in show the country trends of the prevalence of random responders across scales in the student questionnaire. What becomes visible is that the prevalence rates show a systematic occurrence of several spikes throughout the survey in each of the countries. Two spikes occur for the integrated science program, and three more spikes (i.e., 5 in total) occur in the longer questionnaire of the separated science program. The locations of these spikes in prevalence are not randomly distributed but coincide with the locations of the confidence scales in the questionnaire. In the integrated science program the spike in prevalence occurs for both confidence scales (i.e., mathematics and science), and in the separated science program for all five confidence scales (i.e., mathematics, biology, earth science, chemistry, and physics). Given the clear impact of the confidence scales on the prevalence patterns, it makes sense to take this factor into consideration and to revisit our hypotheses adjusting for this unexpected confounder.
Figure 3. Observed Prevalence of Random Responders per Country across Scales by Science Program .Note. The solid black line represents the observed prevalence of random responders across scales. The dashed grey lines represent the average prevalence on the first and the last scale across countries in the corresponding questionnaire. The spikes in prevalence are related to the confidence scales; within the integrated science questionnaire located at position 4 and 8 and within the separated science questionnaire located at position 4, 8, 11, 14, and 17 (i.e., indicated by the grey vertical bars).
Hypotheses revisited with confidence in mind
To account for the spikes in prevalence, we added a binary predictor variable differentiating between non-confidence (i.e., confidence = 0) and confidence (i.e., confidence = 1) scales to the model. As also showed that the degree of irregularity for the confidence scales varied across countries, we allowed for a country-varying (random) coefficient for confidence with mean and variance
and potentially correlated with the country-varying intercept
. Model results are summarized in .
Table 4. Revisited with confidence in mind: Cross-classified mixed models of the prevalence of random responders as a function of scale position and questionnaire length.
The prevalence of random responders on an average non-confidence scale for an average country was estimated to be , whereas the corresponding prevalence for an average confidence scale was expected to be
higher (
). Hence, there is clear statistical support for a systematic spike in the prevalence of random responders on the survey scales measuring confidence. When compared to the variation in prevalence across countries for non-confidence scales
, the corresponding variation across countries for the difference between confidence and non-confidence scales is more sizeable
. The latter result reflects the differences in the height of the spikes in the different countries in , whereas the baseline prevalence trends are more similar in nature. There was no clear pattern between country differences in prevalence heights for non-confidence scales and country differences in prevalence spike heights for confidence scales (i.e.,
).
The addition of the new binary predictor effectively detrends the prevalence patterns across the student questionnaire for the unexpected spike pattern due to the confidence scales, allowing us to revisit the original hypotheses adjusting for that systematic distortion. As effect size measure will be used, the difference between the model’s
and the reference
under
the baseline model augmented with the new binary confidence predictor. Hence, this measure will quantify the unique contribution of scale position and questionnaire length to systematic variation across scales in the prevalence of random responders beyond what is accounted for by the confidence spike pattern.
Accounting for the confidence spikes, a scale located five positions later in the questionnaire is expected to have about 1% higher prevalence of random responders than the earlier scale (); a result supporting Hypothesis 1. Yet, no statistically significantly higher prevalence was found in countries teaching the separated science program when compared to those with the integrated science program (
), and hence no empirical support was found for Hypothesis 2 that the prevalence of random responders would be a function of questionnaire length. When looking jointly at scale position and questionnaire length, there was support found for an interaction (
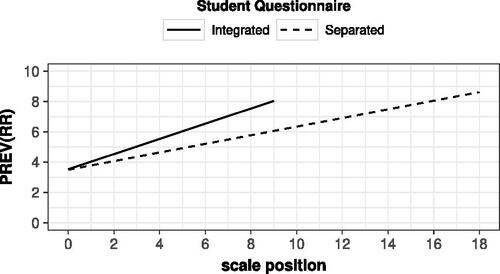
), yet not one of the hypothesized synergistic type. illustrates that in contrast to expectations the differences in prevalence between scales at subsequent positions are estimated to be larger in the shorter questionnaire than in the longer questionnaire. Notice that regardless of the length of the questionnaire, the prevalence estimate for an average survey scale at the first and last position in the respective questionnaire is estimated to be about 3.5% and 8.5%, respectively.
Figure 4. Prevalence of random responders as a function of scale position and questionnaire length in TIMSS 2015 under the cross-classified mixed model .Note. The TIMSS 2015 student questionnaire consisted of 10 survey scales for countries with an integrated science program, whereas it consisted of 19 survey scales for countries with a separated science program. For the model parameters of model
, see .
Discussion
The aim of the present study was to investigate the impact of two questionnaire characteristics, scale position and questionnaire length, on the prevalence of random responders in the TIMSS 2015 eighth-grade student questionnaire. Although random responders still provide responses to the items of a questionnaire scale, their responses can be seen as a type of non-response, as they would not lead to valid inferences on their actual attitudes or beliefs that were intended to be measured. It has been suggested that as students progress through a questionnaire they will experience for example boredom, disinterest, inattentiveness, or fatigue and consequently engage in random responding. Accordingly, a higher prevalence of random responders was hypothesized for scales at a later position in the questionnaire and for the longer version of the two questionnaires, and an even higher prevalence for later scales in the longer questionnaire (i.e., a synergistic interaction between scale position and questionnaire length).
Questionnaire length
We found no clear difference in the prevalence of random responders between the longer student questionnaire administered in countries with a separated science program and the shorter student questionnaire administered in countries with an integrated science program. In a similar fashion, Boe et al. (Citation2002) also didn’t find an effect of questionnaire length when they looked at student response omission rates (labeled ‘task persistence’) in the TIMSS 1995 student questionnaire. A skeptical interpretation could attribute this finding to the difference in countries between the two questionnaire versions, but it has also been suggested that most educational and psychological questionnaires are just not long enough to find an effect on response quality to begin with (e.g., Bowling et al., Citation2022). In broader survey situations where there is a larger time and length difference, questionnaire length does seem to have an effect (e.g., Herzog & Bachman, Citation1981). Yet the mixed results in the literature with respect to questionnaire length suggest that actual effects will also depend on (i) the content or context of the specific questionnaire under consideration (e.g., Gibson & Bowling, Citation2020; Rolstad et al., Citation2011) and (ii) on the subjectively perceived length of the questionnaire instead of its actual length (Helgeson et al., Citation2002). Although there had been some complaints reported by the students about the length of the student questionnaire (Martin et al., Citation2016), the current null finding with respect to questionnaire length does seem to suggest that the differences in test burden and testing time for the two versions of the TIMSS 2015 student questionnaires were kept within seemingly reasonable boundaries.
Scale position
We found support for a scale position effect with a significantly higher prevalence of random responders for scales at a later position in the questionnaire compared to scales at an earlier position. Over the course of both questionnaires, the prevalence of random responders increased by 5%, from 3.5% on an average scale at the beginning to 8.5% at the end of the student questionnaire. The effect of scale position actually being stronger within the shorter version of the student questionnaire contrasted with the hypothesized synergism which would have implied the opposite trend. Galesic (Citation2006) suggests that again students’ relative perception of the questionnaire plays a role. Hence, students might consider scale position being considered relative to the perceived length of the questionnaire. Relatively speaking, with every additional scale in the shorter questionnaire more of the questionnaire has passed percent-wise (i.e., the progress signified by 1 scale is 10% in the shorter questionnaire compared to 5% in the longer questionnaire). This might have potentially influenced the students’ subjective perception of how much they already had completed and how much was still left and influenced how they would engage with further scales in the questionnaireFootnote3.
The case of the confidence scales
The most striking result with respect to the prevalence of random responders across the student questionnaire were the spikes in prevalence among all confidence scales (i.e., mathematics and science subject domains) with on average an extra 9% prevalence compared to other scales. This difference due to the specific scale character is double the size of the above-discussed 5% prevalence difference due to the maximal scale position difference. The implication of this finding is that random responder prevalence is not only depending on the ‘endurance’ of the students throughout the questionnaire. So what is so special about the confidence scales that they elicit more random response behavior? Focusing on the characteristics of the confidence scales might provide some indications of what is going on.
First, the confidence scales are mixed-worded scales. It has been argued that reversed-worded items are more difficult to process (e.g., Marsh, Citation1986; Swain et al., Citation2008). Although the confidence scales are not the only mixed-worded scales in the student questionnaire, they do have the largest amount of reversed-worded items (e.g, 4 out of 9 reversed-worded items for confidence in mathematics compared to 2 out 9 items for the like-learning scales) which could contribute to a larger impact (e.g., Schmitt & Stuits, Citation1985).
A second characteristic to consider is the type of items in the confidence scales. Because some of the items are related to self-concept (e.g., Michaelides et al., Citation2019), one could argue that items are more comparative in nature as opposed to more absolute/factual. Important here is that perceptions students have about themselves are always made in comparison to some standard, either internally (i.e., own performance in one subject with own performance in another subject) or externally (own performance with the performance of other students) (e.g., Marsh & Hau, Citation2004). Examples of items administered in the student questionnaire are “mathematics is harder for me than any other subject” or “mathematics is more difficult for me than for many of my classmates”. Items that require comparisons, with additional changing or ambiguous standards and definitions of self, might just be more difficult to answer.
Both speculative explanations touch upon extra cognitive processing demands and perceived ambiguity or difficulty of the items in the confidence scales. This would be in line with the study by Baer et al. (Citation1997) where the core reasons given by participants for random responding were difficulties in understanding items and difficulties in deciding on the response, in contrast to for instance lapses of concentration or boredom. Yet, these more abstract item characteristics are at the same time intertwined with the concrete scale contents ‘confidence in a school subject’. On the upside, the fact that the confidence spikes generalized across different participating countries in TIMSS 2015 implies some generality of the underlying reasons.
Although TIMSS is low-stakes in all participating countries and there are solid standardized procedures for (back)translation of the different scales and administration of the questionnaire as a whole, this does of course not cancel out any further interplay with national context, sociocultural aspects, language connotations, and differences in motivation and implicit communication surrounding TIMSS. Such contextual differences are reflected in the observed variability across countries in the average prevalence of random responders. Also when looking at the Confidence scales, the spikes in prevalence are for instance more outspoken in countries from the Middle East region. Further research would need to dig into whether these scales are indeed eliciting more random responding or whether these questionnaire scales are being completely differently interpreted or approached by students in those regions than elsewhereFootnote4.
The current study exploited the natural variation in scale position, questionnaire length, and scale characteristics found in the TIMSS 2015 student questionnaire. Yet, to be able to clearly separate the influence of item characteristics and contents, an experimental study would be called for in which item formulation of the questionnaire scales is systematically varied, independently of scale contents. However, to implement such an experiment at a similar large-scale and level of generality as TIMSS 2015 might perhaps prove to be unrealistic. Complementary, we should also not dismiss the value of a more qualitative follow-up. Being classified as a random responder by the mixture IRT model does not imply that the student has deliberately responded randomly, but merely that the pattern of responses given is more random-like than it is consistent with the scale. Cognitive interviews and related techniques might provide insight into students’ understanding and interpretation of the items in the confidence scales, into their processes to arrive at a response, but also into their feelings toward the scale contents in the questionnaire (e.g., Karabenick et al., Citation2007). Such research could potentially also shed light on other potential risk factors that have been put forward by Meade and Craig (Citation2012) with respect to the general quality of responses (e.g., respondent interest, social contact, and environmental distraction).
Conclusion
In sum, we conclude that one can indeed expect more students to engage in random responding on scales toward the end of the questionnaire in a large-scale educational assessment such as TIMSS. This seems likely related to more of a subjective relative evaluation for each individual, as in “Aren’t we there yet?”, than to an objective physical criterion in terms of questionnaire length. Yet, when considering such response behavior, characteristics (item formulation and/or contents) of the questionnaire scales seem to be more crucial than expected. This implies that researchers and questionnaire designers want to better ensure that their target population is eager and willing to fully engage with the questions asked to increase response validity. The target population’s subjective experience with the questionnaire can influence the quality of their responses given. We hope that the study’s findings can contribute to convincing the organizations behind the international large-scale assessments in education of the value of investing in more extensive cognitive techniques and test panels. In general, an increased involvement of the target student population could benefit the design of the questionnaire scales.
Disclosure statement
No potential conflict of interest was reported by the author(s).
Additional information
Funding
Notes
1 Integrated Science Program: Australia, AUS; Bahrain, BHR; Botswana, BWA; Canada, CAN; Chile, CHL; Chinese Taipei, TWN; Egypt, EGY; England, ENG, Hong Kong SAR, HKG; Iran, Islamic Rep. of, IRN; Ireland, IRL; Israel, ISR; Italy, ITA; Japan, JPN; Jordan, JOR; Korea, Rep. of, KOR; Kuwait, KWT; Malaysia, MYS; New Zealand, NZL; Norway, NOR; Oman, OMN; Qatar, QAT; Saudi Arabia, SAU; Singapore, SGP; South Africa, ZAF; Thailand, THA; Turkey, TUR; United Arab Emirates, ARE; United States, USA.
Separated Science Program: Armenia, ARM; Georgia, GEO; Hungary, HUN; Kazakhstan, KAZ; Lebanon, LBN; Lithuania, LTU; Malta, MLT; Morocco, MAR; Russian Federation, RUS; Slovenia, SVN; Sweden, SWE.
2 The part of the model accommodating the possibility of random responders in the population has no unknown parameters as item response probabilities are known and assumed to be uniformly equal across categories and items, such that only the mixture weights and
remain as extra model parameters, which reduces to one given that
3 Note that students are only familiar with the version of the student questionnaire administered to them, they are not able to compare the length with the other version and as such have no baseline but their own perception.
4 Note that among the 35 of 499 scale-country combinations not meeting the quality criteria for the application of the mixture IRT to random responder detection, 27 combinations involved confidence scales, of which 18 did not meet the standardized loadings criterion, implying weakness of the unidimensional measurement model for these cases.
References
- Baer, R. A., Ballenger, J., Berry, D. T. R., & Wetter, M. W. (1997). Detection of random responding on the MMPI–A. Journal of Personality Assessment, 68(1), 139–151. https://doi.org/10.1207/s15327752jpa6801_11
- Bates, D., Mächler, M., Bolker, B., & Walker, S. (2015). Fitting linear mixed-effects models using lme4. Journal of Statistical Software, 67(1), 1–48. https://doi.org/10.18637/jss.v067.i01
- Berry, D. T. R., Wetter, M. W., Baer, R. A., Larsen, L., Clark, C., & Monroe, K. (1992). MMPI-2 random responding indices: Validation using a self-report methodology. Psychological Assessment, 4(3), 340–345. https://doi.org/10.1037/1040-3590.4.3.340
- Boe, E., May, H., & Boruch, R. (2002). Student task persistence in the third international mathematics and science study: A major source of achievement differences at the national, classroom, and student levels (Research Report No. 2002-TIMSS1). University of Pennsylvania, Center for Research in Evaluation in Social Policy.
- Bowling, N. A., Gibson, A. M., & DeSimone, J. A. (2022). Stop with the questions already! Does data quality suffer for scales positioned near the end of a lengthy questionnaire? Journal of Business and Psychology, 37(5), 1099–1116. Advance online publication. https://doi.org/10.1007/s10869-021-09787-8
- Bowling, N. A., Gibson, A. M., Houpt, J. W., & Brower, C. K. (2021). Will the questions ever end? Person-level increases in careless responding during questionnaire completion. Organizational Research Methods, 24(4), 718–738. https://doi.org/10.1177/1094428120947794
- Cronbach, L. J. (1950). Further evidence on response sets and test design. Educational and Psychological Measurement, 10(1), 3–31. https://doi.org/10.1177/001316445001000101
- Curran, P. G. (2016). Methods for the detection of carelessly invalid responses in survey data. Journal of Experimental Social Psychology, 66, 4–19. https://doi.org/10.1016/j.jesp.2015.07.006
- Deutskens, E., de Ruyter, K., Wetzels, M., & Oosterveld, P. (2004). Response rate and response quality of internet-based surveys: An experimental study. Marketing Letters, 15(1), 21–36. https://doi.org/10.1023/B:MARK.0000021968.86465.00
- Eklöf, H. (2010). Skill and will: Test-taking motivation and assessment quality. Assessment in Education: Principles, Policy & Practice, 17(4), 345–356. https://doi.org/10.1080/0969594X.2010.516569
- Galesic, M. (2006). Dropouts on the web: Effects of interest and burden experienced during an online survey. Journal of Official Statistics, 22(2):313–328.
- Galesic, M., & Bosnjak, M. (2009). Effects of questionnaire length on participation and indicators of response quality in a web survey. Public Opinion Quarterly, 73(2), 349–360. https://doi.org/10.1093/poq/nfp031
- Gibson, A. M., & Bowling, N. A. (2020). The effects of questionnaire length and behavioral consequences on careless responding. European Journal of Psychological Assessment, 36(2), 410–420. https://doi.org/10.1027/1015-5759/a000526
- Goldhammer, F., Martens, T., & Lüdtke, O. (2017). Conditioning factors of test-taking engagement in PIAAC: An exploratory IRT modelling approach considering person and item characteristics. Large-Scale Assessments in Education, 5(1), Article 18. https://doi.org/10.1186/s40536-017-0051-9
- Hallquist, M. N., & Wiley, J. F. (2018). MplusAutomation: An R package for facilitating large-scale latent variable analyses in Mplus. Structural Equation Modeling : a Multidisciplinary Journal, 25(4), 621–638. https://doi.org/10.1080/10705511.2017.1402334
- Helgeson, J. G., Voss, K. E., & Terpening, W. D. (2002). Determinants of mail-survey response: Survey design factors and respondent factors. Psychology and Marketing, 19(3), 303–328. https://doi.org/10.1002/mar.1054
- Herzog, A. R., & Bachman, J. G. (1981). Effects of questionnaire length on response quality. Public Opinion Quarterly, 45(4), 549–559. https://doi.org/10.1086/268687
- Karabenick, S. A., Woolley, M. E., Friedel, J. M., Ammon, B. V., Blazevski, J., Bonney, C. R., De Groot, E., Gilbert, M. C., Musu, L., Kempler, T. M., & Kelly, K. L. (2007). Cognitive processing of self-report items in educational research: Do they think what we mean? Educational Psychologist, 42(3), 139–151. https://doi.org/10.1080/00461520701416231
- Marsh, H. W. (1986). Negative item bias in ratings scales for preadolescent children: A cognitive-developmental phenomenon. Developmental Psychology, 22(1), 37–49. https://doi.org/10.1037/0012-1649.22.1.37
- Marsh, H. W., & Hau, K.-T. (2004). Explaining paradoxical relations between academic self-concepts and achievements: Cross-cultural generalizability of the internal/external frame of reference predictions across 26 countries. Journal of Educational Psychology, 96(1), 56–67. https://doi.org/10.1037/0022-0663.96.1.56
- Martin, M. O., Mullis, I. V. S., & Hooper, M. (2016). Methods and procedures in TIMSS 2015. TIMSS & PIRLS International Study Center, Boston College.
- Meade, A. W., & Craig, S. B. (2012). Identifying careless responses in survey data. Psychological Methods, 17(3), 437–455. https://doi.org/10.1037/a0028085
- Merritt, S. M. (2012). The two-factor solution to Allen and Meyer’s (1990) affective commitment scale: Effects of negatively worded items. Journal of Business and Psychology, 27(4), 421–436. https://doi.org/10.1007/s10869-011-9252-3
- Messick, S. (1984). The psychology of educational measurement. Journal of Educational Measurement, 21(3), 215–237. https://doi.org/10.1111/j.1745-3984.1984.tb01030.x
- Michaelides, M. P., Brown, G. T. L., Eklöf, H., & Papanastasiou, E. C. (2019). Motivational profiles in TIMSS mathematics: Exploring student clusters across countries and time. Springer International Publishing.
- Mislevy, R. J., & Verhelst, N. (1990). Modeling item responses when different subjects employ different solution strategies. Psychometrika, 55(2), 195–215. https://doi.org/10.1007/BF02295283
- Mullis, I. V. S., & Martin, M. O. (2013). TIMSS 2015 Assessment Frameworks. TIMSS & PIRLS International Study Center, Boston College.
- Muthén, L. K., & Muthén, B. O. (1998–2017). Mplus user’s guide (8th ed.).
- Nylund, K. L., Asparouhov, T., & Muthén, B. O. (2007). Deciding on the number of classes in latent class analysis and growth mixture modeling: A Monte Carlo simulation study. Structural Equation Modeling: A Multidisciplinary Journal, 14(4), 535–569. https://doi.org/10.1080/10705510701575396
- R Core Team (2020). R: A language and environment for statistical computing.
- Rolstad, S., Adler, J., & Rydén, A. (2011). Response burden and questionnaire length: Is shorter better? A review and meta-analysis. Value in Health : The Journal of the International Society for Pharmacoeconomics and Outcomes Research, 14(8), 1101–1108. https://doi.org/10.1016/j.jval.2011.06.003
- Samejima, F. (1969). Estimation of latent ability using a response pattern of graded scores. Psychometrika, 34(S1), 1–97. https://doi.org/10.1007/BF03372160
- Schmitt, N., & Stuits, D. M. (1985). Factors defined by negatively keyed items: The result of careless respondents? Applied Psychological Measurement, 9(4), 367–373. https://doi.org/10.1177/014662168500900405
- Sen, S., & Cohen, A. S. (2019). Applications of mixture IRT models: A literature review. Measurement: Interdisciplinary Research and Perspectives, 17(4), 177–191.
- Snijders, T., & Bosker, R. (2012). Multilevel analysis: An introduction to basic and advanced multilevel modeling. SAGE Publications, Inc.
- Swain, S. D., Weathers, D., & Niedrich, R. W. (2008). Assessing three sources of misresponse to reversed likert items. Journal of Marketing Research, 45(1), 116–131. https://doi.org/10.1509/jmkr.45.1.116
- van Laar, S., & Braeken, J. (2022). Random responders in the TIMSS 2015 student questionnaire: A threat to validity? Journal of Educational Measurement, 59(4), 470–501. https://doi.org/10.1111/jedm.12317
- Wagenmakers, E.-J., & Farrell, S. (2004). AIC model selection using Akaike weights. Psychonomic Bulletin & Review, 11(1), 192–196. https://doi.org/10.3758/bf03206482
- Wise, S. L., & Kong, X. (2005). Response time effort: A new measure of examinee motivation in computer-based tests. Applied Measurement in Education, 18(2), 163–183. https://doi.org/10.1207/s15324818ame1802_2
- Wise, S. L., Pastor, D. A., & Kong, X. J. (2009). Correlates of rapid-guessing behavior in low-stakes testing: Implications for test development and measurement practice. Applied Measurement in Education, 22(2), 185–205. https://doi.org/10.1080/08957340902754650
- Yamamoto, K. (1989). Hybrid model of IRT and latent class models. RR-89-41.
Appendix A
Mplus syntax of mixture IRT model for the ‘students value mathematics’ scale in Norway.
TITLE:Norway_SQM20;DATA:file = "NOR_SQM20.dat";VARIABLE:names = IDSCHOOL IDSTUD TOTWGTBSBM20A BSBM20B BSBM20C BSBM20DBSBM20E BSBM20F BSBM20G BSBM20H BSBM20I;missing = .;usevariables = BSBM20A BSBM20B BSBM20C BSBM20DBSBM20E BSBM20F BSBM20G BSBM20H BSBM20I;categorical = BSBM20A BSBM20B BSBM20C BSBM20DBSBM20E BSBM20F BSBM20G BSBM20H BSBM20I;idvariable = IDSTUD;weight = TOTWGT;cluster = IDSCHOOL;classes = c(2);ANALYSIS:type = mixture complex;algorithm = INTEGRATION EMA;estimator = MLR;process = 3;starts = 400 100;MODEL:%overall%F BY BSBM20A-BSBM20I*;F@1;[F@0];%c#1%F BY BSBM20A-BSBM20I*;F@1;[F@0];[BSBM20A$1-BSBM20I$1];[BSBM20A$2-BSBM20I$2];[BSBM20A$3-BSBM20I$3];%c#2%F BY BSBM20A-BSBM20I@0;F@0;[F@0];[[email protected]];[BSBM20A$2-BSBM20I$2@0];[[email protected]];OUTPUT:stdyx;SAVEDATA:file = cpr_NOR_SQM20.dat;format = free;save = cprobabilities;
Note. The item category threshold parameters in Class 2 (i.e., random responder class) are set on a logistic scale and correspond to cumulative response category probabilities of 25%, 50%, and 75% (i.e., 1/(1 + exp(threshold))). A more detailed description of the model can be found in van Laar and Braeken (Citation2022).