
 ?Mathematical formulae have been encoded as MathML and are displayed in this HTML version using MathJax in order to improve their display. Uncheck the box to turn MathJax off. This feature requires Javascript. Click on a formula to zoom.
ABSTRACT
The integration of chemical looping combustion with fluid catalytic cracking (CLC-FCC) is an innovative concept that serves as a cost-effective method for CO2 capture in refineries. This approach has the potential to reduce refinery CO2 emissions by 25–35%, offering a promising solution. As in the conventional FCC unit, it is common for CLC-FCC regenerators to be exposed to an on-off process while they are being maintained and cleaned. The novelty of this research lies in its specific focus on a less-explored phase (start-up) of CLC-FCC regenerators, the application of advanced CFD modeling, and the comprehensive analysis of operational parameters that influence the system’s performance. To validate the CFD simulations of the different drag models for solid-gas granular, bed density profiles under steady-state conditions, collected from industrial processes, were used. For the flow period based on the start-up process of the drag models, the fluidization gas inlet geometry of the regenerator, flow regime (laminar and turbulent), and superficial gas velocity were comprehensively investigated to reveal their effects on hydrodynamic characteristics. The results show that Gidaspow and Syamlal-O’Brien drag models of the solid-gas multiphase granular flow exhibited a better fit with industrial data. The Syamlal-O’Brien and Gidaspow models closely align with industrial data under steady-state conditions, displaying similar bed densities in the dense phase region (230–310 kg/m3 for Syamlal-O’Brien and 235–300 kg/m3 for Gidaspow). During the initial stage (less than 0.2 seconds), both laminar and turbulent models yield comparable bed density profiles, approximately 510 kg/m3 in the dense phase. However, as the process progresses, the dense phase density decreases to about 250–350 kg/m3 at around 0.5 seconds, with laminar flow models showing a slightly better fit with industrial data. Notably, at 0.5 seconds of fluidization time, inlet geometries having better gas distribution achieve a highly diluted phase with bed densities of 10–20 kg/m3. Reaching a steady state, the bed density decreases from around 400 kg/m3 to 260–300 kg/m3, expanding into a higher section of the regenerator where it aligns well with industrial data. The increase in superficial gas velocity would result in the clarification of the difference and well mixing of the solid-gas multiphase flow.
Introduction
Fluidisation reactors have high heat transfer capacity and brilliant mixing behaviors of the solid-gas flows (Chew, Lamarche, and Cocco Citation2022). The use of these reactors can therefore be found in many industries, including petrochemicals, mining, and pharmaceuticals (Alobaid et al. Citation2022). Fluid Catalytic Cracking (FCC), as an illustration, is a critical unit for converting vacuum gas oil or heavy petroleum residues to valued products such as light cycle oil, gasoline, and light petroleum gas (Erdoğan Citation2023). An FCC unit typically consists of two interconnected reactor configurations; a fluidized bed reactor called “regenerator” and a riser reactor also called “catalytic cracking riser reactor” (Jones and Pujadó Citation2006). The preheated petroleum feedstock mixes with hot catalysts and steam and is then cracked at a temperature of 480–600 C in the FCC riser reactor. Cokes (mainly carbon) are deposited over the catalyst surface and decrease the activity of the catalyst during this cracking reaction. Following cracking reactions, the cracked products and coke-deposited catalysts are separated in cyclones. The coke-deposited catalyst is then transferred to the regenerator, in which air combust the coke (Golgiyaz et al. Citation2022) in conventional FCC regenerator and oxygen carriers combust the coke in the advanced CLC-FCC regenerator (Güleç et al. Citation2021). The regeneration process is the key process for the FCC units (Amblard et al. Citation2017). The regeneration process of catalysts in a regenerator is a type of solid-gas multiphase flow. Whether an FCC regenerator can regenerate effectively depends on how well the catalytic materials are distributed and mixed with the oxygen agent (air in conventional FCC regenerators, oxygen carriers in CLC-FCC regenerators).
Computational fluid dynamics (CFD) offers valuable insights relating to the characteristics of the fluid domain such as velocity, pressure, temperature, turbulence, and particle volume fractions indicating the characteristics of the fluid domain. Thus, CFD has been increasingly useful for designing, analyzing, and optimizing fluidized bed reactors. The hydrodynamics of turbulent fluidized bed reactors have been numerically studied extensively (Tu, Wang, and Ocone Citation2022), in contrast, few studies have applied CFD to the hydrodynamics of FCC regenerators (Yang et al. Citation2021), coke combustion (Yang et al. Citation2021), and heat transfer (Singh and Gbordzoe Citation2017) in the FCC regenerator could be predicted by utilizing various CFD models or commercial package software. In these studies, regenerator bed density and the volume fraction of the FCC particles (catalyst) are considered to illustrate the hydrodynamic behaviors of the solid-gas multiphase flows in the FCC regenerator. Besides, the steady-state period is usually considered in the flow simulations when modeling solid-gas multiphase flow in FCC regenerators. This flow period surely varies depending on the geometric model and the size of the FCC regenerator. However, both conventional FCC and CLC-FCC regenerators are expected to be shut down and restarted to perform maintenance and cleaning. The characteristics of solid-gas multiphase flows during start-up play a crucial role in determining the behavior of flows at steady-state in FCC regenerators. Therefore, the solid-gas granular flow is a type of multiphase flow and its hydrodynamics in the CLC-FCC regenerators during start-up should be clarified. There has not been a study investigating the hydrodynamic characteristics of the start-up period in FCC regenerators.
This study therefore specifically addresses the start-up period hydrodynamics in CLC-FCC regenerators, which is particularly innovative as most existing studies focus on steady-state conditions. To achieve this, the study employs advanced CFD modeling using ANSYS – Fluent software, which enables a detailed and accurate representation of the solid-gas multiphase granular flow, thus significantly enhancing the understanding of the complex physical phenomena during the start-up phase. The objectives of this research are multi-faceted: firstly, to investigate the impact of varying fluidization gas inlet geometries and superficial gas velocities on the hydrodynamics; secondly, to assess the performance of different drag models in simulating these dynamics in CLC-FCC regenerators. Through this, the study aims to deliver critical insights that could inform the design and optimization of CLC-FCC systems, thereby contributing to more effective CO2 capture and emissions reduction strategies in industrial processes.
CFD methodology
Solid models were first generated to model the solid-gas multiphase granular flow in a CLC-FCC regenerator (Güleç et al. Citation2021) using Computational Fluid Dynamics (CFD). In these regenerators, the geometry of inlet surfaces, in which fluid enters the fluid domain through these surfaces, has a key role since the geometry affects the hydrodynamic characteristics of the flow in the entrance section of the regenerators. For this reason, four different inlet surface configurations were designed and integrated with the regenerator geometry. shows the CLC-FCC regenerator and the different inlet designs, respectively. The designed regenerator of FCC unit comprises three sections having different diameters and heights. The lower section has a diameter of 210 mm and a height of 792 mm. The diameters of middle section and upper section are 270 and 290 mm, respectively. The height of the middle section of the CLC-FCC regenerator is 350 mm while the height of the upper section is 586 mm. When looking at the inlet geometries, gas flows into the fluid domain through a surface with a diameter of 210 mm in Design-1, 105 mm in Design-2, 23 surfaces with a diameter of 30 mm in Design-3, and 137 surfaces with a diameter of 10 mm in Design-4. The gas inlet surface of the CLC-FCC regenerator, which features various inlet designs, is referred to as the “velocity inlet” boundary condition. Meanwhile, the upper section of the regenerator, with a diameter of 290 mm, is designated as the “pressure outlet” boundary condition. The details of the CFD models are presented in . For the remaining surfaces, the “wall” boundary condition is applied. The tetrahedral mesh was generated and used in the simulations. To conduct mesh sensitivity analysis, four different mesh numbers were determined and simulated for the CLC-FCC regenerator with the Design-1 inlet section. The mesh numbers are 155,000 (M1), 215000 (M2), 300000 (M3), and 415,000 (M4). The inlet domain of the CLC-FCC regenerators plays a key role in the fluid domain because multiphase granular flows especially most of the interaction between solid and gas phases flow occur in this section. In the inlet region, therefore, dense mesh is created to obtain more sensitivity solutions. The maximum inlet edge and face sizing of the mesh in all solid models is 2 mm. M1, M2, M3, and M4 have maximum element sizes of 35, 27, 21, and 17 mm, respectively. The maximum skewness number, which is an important parameter of mesh quality, is kept at 0.8, which is acceptable (Fluent Citation2009). Meshes are refined throughout the entire flow domain. 18 of span angle is determined for the mesh curvature. Coarse and medium options are selected as the relevance center and mesh smoothing characteristics.
Figure 1. An illustration showing the configuration of a regenerator used in CFD simulations (Chang et al. Citation2013, Citation2016; Gao et al. Citation2009a).
Table 1. Numerical parameters determined in the study.
CFD simulations were performed using ANSYS FLUENT which is a commercial CFD software. ANSYS Fluent based on Finite Volume Method and can simulate single or multiphase fluid flows. It is also able to visualize characteristics of the fluid domain such as velocity, pressure, temperature, shear stress, and volume fraction. This study includes a series of CFD simulations of a three-dimensional multiphase flow based on the Eulerian-Eulerian model with the kinetic theory of granular flow. Solid-gas multiphase granular flow analyses are performed by solving the governing and transport equations given in .
Table 2. Governing equations and constitutive relations.
In the CFD models, “no slip” and “partial slip” were used for the gas and solid-phase walls boundary conditions. Coefficients of restitution and specularity were 0.95 and 0.6. The governing and transport equations were solved with 0.0005 s time step size in which the numbers of iterations per step is 20. The convergence criteria were 0.001. The SIMPLE algorithm was used to discretize the flow domain variables. In the spatial discretization process, the first-order upwind scheme was chosen. Parallel processing was carried out on 8 processors for each analysis. The value of the maximum solid volume fraction was 0.63. Particles identified as a solid material in the models have a density of 1560 kg/m3 and a diameter of 65 μm. The continuity and governing equations for gas (carrier gas – CO2) and solid (oxygen carrier modified FCC catalyst) phases (subscript q can be solid (s) or gas (g)) are presented in .
Results and discussions
Mesh sensitivity study
To determine the convenient mesh number, sensitivity analyses of the mesh were conducted using four different mesh quantities: 155,000 (M1), 215,000 (M2), 300,000 (M3), and 415,000 (M4) elements using Geometry-1. Particle volume fraction with time-averaged through radial distribution at different heights (250 mm and 500 mm) are shown in shows. The results of the mesh sensitivity analyses are presented for four different mesh quantities under steady state conditions at 1.0 m/s of superficial gas velocity. also shows particle volume fraction profiles for four different meshes at 1.0 m/s of superficial gas velocity under steady state conditions (8 s).
Figure 2. Radial distribution of particle volume fraction with time-averaged for four different mesh quantities (y = 250 mm and y = 500 mm, superficial gas velocity = 1 m/s).
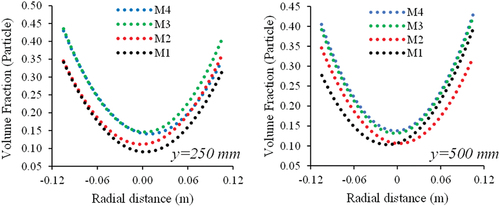
Figure 3. Contours of volume fraction of particles for a) mesh-3 from 0.1s to 5.0s and b) four different meshes at 8 s (steady state) at 1.0 m/s.
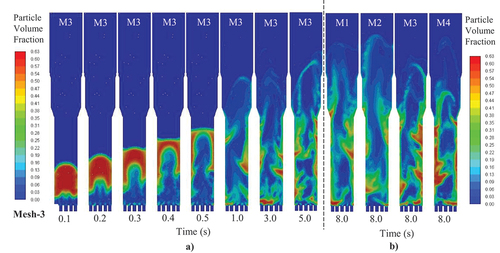
At 250 mm and 500 mm of CLC-FCC regenerator height, the radial volume fraction distributions for the particles (catalysts modified by oxygen carriers) of the finest and medium meshes (M4 and M3) show remarkably similar trends. Furthermore, the particle volume fractions show that at the early stage of fluidization (0–0.5 s), the fluidization flow (CO2 flow) expands the solid volume through the vertical direction and the gas flow splits the bed into two sides while itself passing through the central zone of the bed . At the steady state conditions (8 s), Mesh-3 and Mesh-4 demonstrate similar particle volume fraction profiles as observed in the similar time-averaged particle volume fractions in . For the solid-gas hydrodynamics in the CLC-FCC regenerator reactor, illustrate that M3 (300000 cells, a medium mesh) provides judiciously mesh-independent CFD results. Consequently, the M3 mesh number (300000 cells) was used for the rest of the simulations presented here.
Drag models and validation
The selection of an appropriate drag force model is significantly important for accurately simulating the gas and solid hydrodynamic interactions in the CLC-FCC regenerator reactor, given the broad range of available models (Li et al. Citation2009). To predict the hydrodynamics of solid-gas interactions, the most used drag force models i.e. Gidaspow (Tsuo and Gidaspow Citation1990), Syamlal-O’Brien (Syamlal and O’brien Citation1989) and Schiller-Naumann (Schiller Citation1933) were employed for the regenerator reactor of CLC-FCC unit. demonstrate the axial bed density profiles through bed height (h/H) and instantaneous solid oxygen carriers modified FCC catalysts particles volume fraction profiles, respectively, at the fluidization time lower than 1.0 s and steady state (S.S.). The results were validated with the industrial scale bed density profiles of the regenerator, which are categorized into three parts: a dense phase having a bed density ~285 kg/m3 at h/H of 0.13, a dilute phase having a bed density decreases to ~ 145 and ~60 kg/m3 at ratios of h/H of 0.30 and 0.43, and a highly dilute phase having a bed density ~12 kg/m3 at the h/H of 0.92 (Chang et al. Citation2016; Güleç et al. Citation2021).
Figure 4. Comparison of axial bed density profiles of a) syamlal-O’Brien, b) gidaspow, and c) schiller-naumann at the early stage of fluidisation (0.1–2.0 s) and steady state (S.S.). (I.D. represent the industrial data).
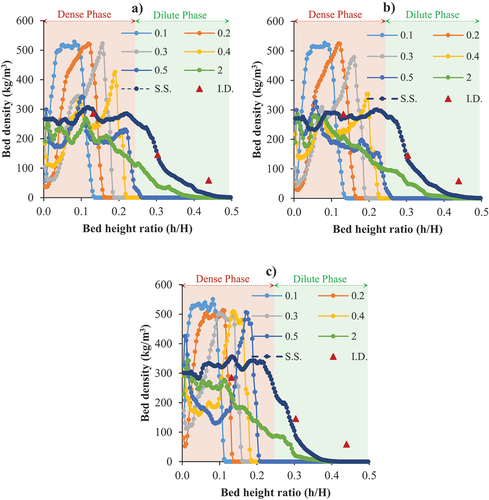
Figure 5. Contours of volume fraction of particles; a) syamlal-O’Brien, b) gidaspow, and c) schiller-nauman drag models at the early stage of fluidisation.
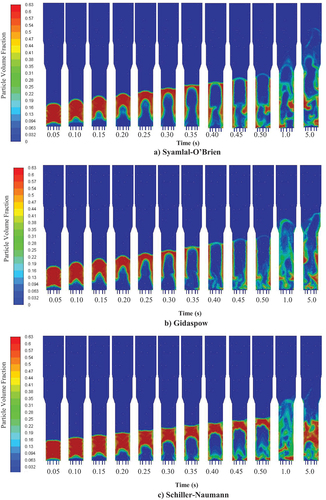
Regardless of drag force models, at the early stage of the fluidization (0–0.5 s), the solid FCC catalysts modified by oxygen carriers are in the dense phase and have a high bed density (500–550 kg/m3). The solid bed expands while the bed density decreases with increasing fluidization time i.e. bed density of 350–400 kg/m3 at the ratio of h/H of 0.2 at 0.5 s. The bed density profiles at 2.0 s show that the CLC-FCC regenerator reactor starts building dense and dilute phases throughout the bed height. When the unit reaches a steady state, the bed profile also shows two well-defined phases; dense phase, and dilute phase, but the highly dilute phase above 0.45 of h/H is not clear unlike it was provided in the industrial data (Chang et al. Citation2016).
Despite the failure of the Schiller-Naumann drag model , Syamlal-O’Brien and Gidaspow models demonstrate close fit with industrial bed density profile under steady-state conditions. For normalized bed heights of 0–0.25, both models give comparable results as bed density profiles, particularly in the dense phase region are 230–310 kg/m3 for Syamlal-O’Brien and 235–300 kg/m3 for Gidaspow. There is a diluted phase with a normalized bed height, h/H, between 0.25 and 0.50 within the middle section of the CLC-FCC regenerator. Both Syamlal-O’Brien and Gidaspow models indicate that bed density is gradually decreasing in this region from approximately 285 kg/m3 to a low level. These models also show better prediction for the solid-gas hydrodynamics in a circulating fluidized bed (Almuttahar and Taghipour Citation2008), and FCC regenerator (Zimmermann and Taghipour Citation2005).
Although the bed density in the second part of the dilute phase and highly dilute phase (specifically, in the region of h/H > 0.35) was underestimated when compared to the industrial data, both the Gidaspow and Syamlal-O’Brien drag force models remain applicable and can be considered validated models for predicting the hydrodynamics in the dense phase of a CLC-FCC regenerator. It may be possible to modify these models to make better predictions in highly dilute regions. For the rest of the hydrodynamic investigation of solid-gas interaction in a CLC-FCC regenerator reactor, the Syamlal-O’Brien drag force model was therefore employed.
Flow regime study
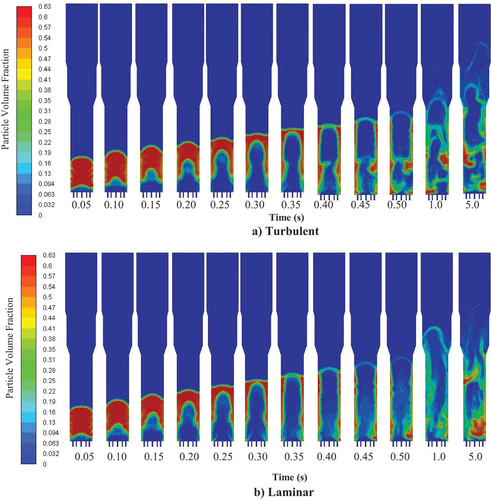
Since CFD analyses of turbulent flows consider eddies spinning within vortex regions, turbulence modeling requires more computation time and data storage. Hence, it is necessary to determine to what extent consideration of turbulence during CFD analysis affects hydrodynamics, to avoid adding modeling costs. An illustration of the contrast between laminar and turbulent flow profiles at 1 m/s of superficial gas velocity for Geometry-3 is shown in . At the early stage of the process (less than 0.2s), both laminar and turbulent models provide similar bed density profiles of ~510 kg/m3 in dense phase. However, with increasing the simulation time, the dense phase gradually expands, which results in decreasing the bed density and expanding the bed to the dilute phase. The bed density in the dense phase was observed around 250–350 kg/m3 at around 0.5 s and compared to industrial data, laminar flow tests show better fit with the industrial data.
Figure 6. The axial bed density profiles were estimated via a) laminar and b) turbulent flow regimes under geometry-3 and 1.0 m/s of superficial gas velocity at 0.1–0.5 s and steady-state.
According to , there are no significant differences between instantaneous particle volume fractions in these two flow regimes (turbulent and laminar) based on the axial bed density profiles . Therefore, both flow models can be used to predict solid hydrodynamics of oxygen carriers modified FCC catalysts in the dense phase of the regenerator of the CLC-FCC unit. The only difference is that more solid catalysts modified with oxygen carriers are transported to the upper parts of the solid bed in laminar flow, in the turbulence approach, since the flow’s internal losses are modeled, including fluid internal energy losses. Comparable results were reported by Gao et al. (Gao et al. Citation2009a) and Chang et al. (Chang et al. Citation2016). as the dense phase located at the bottom of the bubbling/turbulent CLC-FCC regenerator displayed low Reynolds numbers, leading to minimal turbulence in the flow regimes. In the high-density riser of the circulating-fluidized bed, both flow models yielded comparable axial solid velocities. However, it was observed that the laminar flow model exhibited superior performance in accurately reproducing the experimental data (Almuttahar and Taghipour Citation2008). The particle volume fraction profiles in the CLC-FCC regenerator exhibited no significant differences . As the restitution coefficient significantly influences the hydrodynamics rather than flow models and kinetic theories (Gao et al. Citation2009a), this factor must be considered while analyzing the data.
Figure 7. Contours of volume fraction of particles for a) turbulent flow model and b) laminar flow model at the early stage of fluidisation.
Fluidisation gas inlet geometry
For four different geometries of gas inlet, the radial distributions of particles at 250, 500, and 750 mm heights obtained time-averaged are shown in . illustrates the bed density profiles and contours of the volume fraction of particles for different geometries at Mesh-3 in the time range of 0.1–5.0 s. The G1, G3, and G4 geometries show similar radial distributions based on their time-averaged volume fractions as shown in . Conversely, G2 shows a different particle volume fraction due to the dead volume near the fluidized bed reactor inlet. At higher positions within the reactor, lower particle volume fractions are observed, suggesting the existence of dense and dilute phases in the lower and upper regions of the fluidized bed, respectively. The single-central inlet geometry (G2) results in a significant catalyst accumulation at the bottom of the CLC-FCC regenerator compared to G1, G3, and G4. Particles tend to accumulate closer to the wall (at distances of 0.05–0.1 m), while the lowest concentration of particles was observed near the center (−0.05–0.05 m) for G1, G3, and G4.
Figure 8. Radial particle volume fraction distribution with time-averaged through different inlet geometries (G1, G2, G3, and G4) at different height positions within the reactor (y = 250 mm, y = 500 mm, and y = 750 mm 0 at 1.0 m/s of superficial gas velocity.
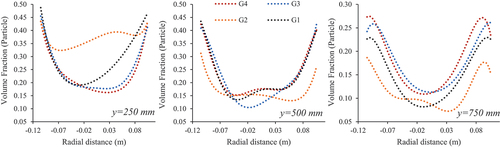
Figure 9. Bed density and contours of volume fraction of particles for a) geometry-1 (G1), b) Geometry-2 (G2), c) Geometry-3 (G3), and d) Geometry-4(G4) at mesh-3 for 10 s.
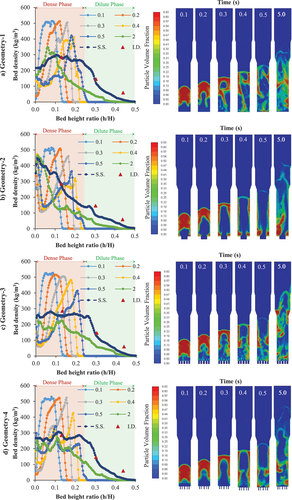
It is anticipated that the solid particles will move fast in the central part of the regenerator due to the fluidization gas, regardless of the inlet configuration for the fluidization gas. This will result in the solid volume expanding and ascending through the central part (as shown in ). The catalyst particles are split by the fluidization gas from the center to the walls , forming a dense gas phase near the walls and a dilute solid phase in the center. In circulating FCC regenerator reactors, this is one of the characteristics of the flow regimes (Almuttahar and Taghipour Citation2008). The formation, movement, and splitting of bubbles cause these flow patterns (Gao et al. Citation2009b). A further characteristic of the solid particles near the wall is that they tend to descend. There was also a demonstration that particles accelerate to the center of the regenerator and fall close to the wall, generating a core-annular flow (Chang et al. Citation2016). Unlike the general trends, the particle volume fraction profiles differ significantly for each inlet geometry. G1, G3 and G4 exhibit similar profiles, while G2 shows a much higher particle volume fraction at the bottom of the CLC-FCC regenerator reactor in which the gas flow entrances through a narrowed inlet surface, which causes a dead volume near the entrance and solid particles accumulate on. In addition, at 0.5 s of fluidization time, G1 and G4 show a highly diluted phase, which is 10–20 kg/m3 of bed density, but not others. Better mixing occurs with a distributed flow regime through the regenerator enabling efficient mixing and contact with solid gas (). A better mixing and distributed flow regime enable high mass and heat transfer rates, homogeneous mixing, high reaction rates, and low pressure drop (Güleç et al. Citation2021).
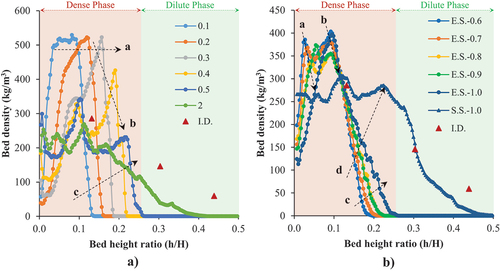
Superficial gas velocity
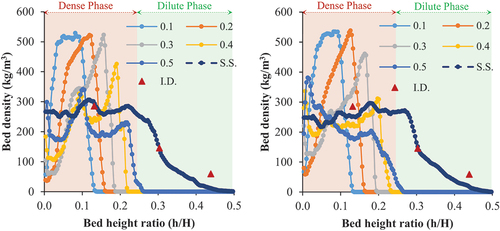
demonstrates bed density profiles at the early stage (0.1 s to 2.0 s) of the CLC-FCC regenerator operating under 1.0 m/s of superficial gas velocity and bed density profiles under various superficial velocities from 0.6 to 1.0 m/s at an early stage (E.S., from 0.1 s to 0.5 s) and steady state (S.S., averaged between 5.0 s and 10.0 s). The increase in fluidization time expands the catalyst bed throughout the reactor height (path-a) and then decreases the bed densities from ~500 kg/m3 to ~ 250–300 kg/m3 (path-b). At the later stage of the fluidization, the catalyst bed expands to the higher location in the reactor and provides a characteristic profile in the CLC-FCC regenerator as a “dense phase” and a “dilute phase” at the bottom and middle section (path c), respectively. The bed density profiles are unaffected by the superficial gas velocity during the earlier stage (ES) of fluidization, as illustrated in . The increase in superficial gas velocities expands the bed density to higher points within the CLC-FCC regenerator. When the fluidization reaches the steady state condition, the bed density decreases from about 400 kg/m3 to 260–300 kg/m3 (path-a and -b in ) and the catalyst bed expand to higher section (path-c and -d in ), where the bed density profiles demonstrate similar trends with the industrial data and expand to the dilute phase.
Figure 10. a) The bed density profiles at the early state (0.1s to 2.0s) of the CLC-FCC regenerator operating under 1.0 m/s of superficial velocity and b) The average bed density profiles of various superficial gas velocities (0.6–1.0 m/s) at early state (E.S., average bed density profiles from 0.05 s to 0.5 s) and steady state (S.S., average bed density profiles from 5.0 s to 10.0 s).
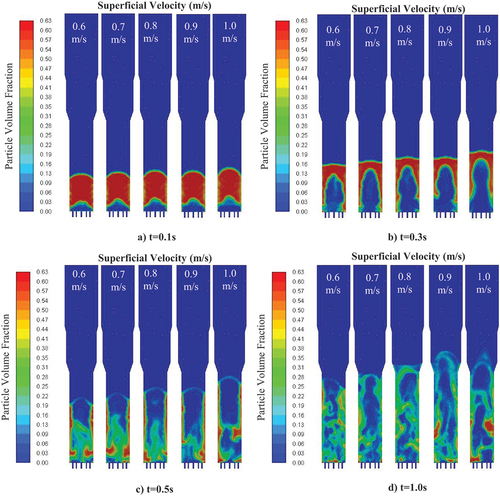
shows the contours of particle volume fraction which confirm a variation in 06–1.0 m/s of superficial gas velocities. However, irrespective of these superficial gas velocity differences, the catalysts are separated by the fluidization gas from the reactor’s center to its walls. This flow regime enhances fluidization and enhances solid-gas interactions by establishing a dense gas phase near the wall and a less concentrated solid phase in the center. As shown in , an increase in superficial gas velocity increases the mixing of the solid-gas phases, and turbulence and augments the gas phase’s entrainment capacity, much like in conventional CLC-FCC regenerator reactors (Azarnivand, Behjat, and Safekordi Citation2018; Chang et al. Citation2013).
Figure 11. Contours of particles volume fraction at initial stages of the fluidisation; a) 0.1s, b) 0.3s, c) 0.5s, and d) 1.0s.
General discussion
It is important to address the distinction between conventional FCC regenerators and the emerging CLC-FCC regenerators. While conventional FCC regenerators are widely utilized in many refineries, the CLC-FCC regenerator, which aims to capture CO2 emissions from coke combustion, is still in the developmental stages. This integration introduces some primary differences in the regenerator design: first; the modification of FCC catalysts with metal oxides serving as oxygen carriers, second; the alteration in the regenerator’s size to accommodate these metal oxides, and third; the change in the fluidization gas from air to CO2. Addressing these changes in the regenerator is significantly important to understanding the role of CLC-FCC in CO2 capture from FCC units, which is crucial for achieving net-zero emissions in refineries. Although successful at the laboratory scale (Güleç, Meredith, and Snape Citation2023), the absence of pilot-scale implementations of the CLC-FCC concept has impeded its industrial-scale application. Thus, this study, along with previous research (Güleç et al. Citation2021), aims to deepen the understanding of the operational parallels and distinctions of CLC-FCC regenerators with conventional FCC regenerators.
In this context, this study has uncovered that different gas inlet surface designs markedly influence gas and modified catalyst distribution within the regenerator throughout the start-up operations. For instance, designs like G1 (a full surface inlet with a 210 mm diameter) and G4 (137 surfaces with a 10 mm diameter) demonstrated superior distribution capabilities compared to others, such as G2. This enhanced distribution leads to a highly diluted phase of 10–20 kg/m3 at the top of the regenerator within 0.5 s. Furthermore, an increase in superficial gas velocity enhances the mixing of the solid-gas multiphase flow, thereby elucidating the differences between laminar and turbulent models. These insights are pivotal for the optimization of CLC-FCC regenerator design, suggesting that the selection of appropriate gas inlet designs and operational parameters can improve hydrodynamic behavior, enhancing the regenerator’s performance during the start-up phase.
Conclusions
This study has presented CFD simulations on the hydrodynamic characteristics of the solid-gas multiphase granular flow in the CLC-FCC regenerator, where the coke-deposited catalysts are regenerated by metal oxides, during the start-up period of the unit. The study examined the impact of fluidization gas inlet geometry, superficial gas velocity, and different flow regimes (turbulent and laminar) on the gas-solid (CO2 as gas, and oxygen carriers modified FCC catalysts as solid) hydrodynamics in the CLC-FCC regenerator. In agreement with the industrial data at the steady state conditions, Syamlal-O’Brien and Gidaspow drag models exhibited better predictions for the hydrodynamic behavior of the multiphase solid-gas flow in the CLC-FCC regenerator. The Symlal-O’Brien drag model demonstrates a bed density of 350–400 kg/m3 at a h/H ratio of 0.2 after 0.5 s, with the inception of dense and dilute phases occurring within 2 s in the CLC-FCC regenerator reactor. Additionally, the gas distributor geometry plays a significant role in providing a more uniform distribution of the particle volume fractions. Surface designs for gas inlet surfaces such as G1 (a full surface inlet surface with 210 mm diameter), G3 (23 surfaces with 30 mm diameter), and G4 (137 surfaces with 10 mm diameter) provided better gas and catalyst distribution than G2 (a half surface inlet surface with 105 mm diameter) and a highly dilute phase of 10–20 kg/m3 can be obtained at the top of the regenerator within 0.5 s in case of utilizing G1 and G4. Although no significant difference was observed between laminar and turbulent models at low values of superficial gas velocity, an increase in superficial gas velocity resulted in clarification of the difference and well mixing of the solid-gas multiphase flow. The findings of this study provide valuable insights into the hydrodynamic behavior of solid-gas multiphase granular flow in CLC-FCC regenerators during the start-up period and could be useful for the design and optimization of these systems.
A key direction for future work should involve the incorporation of combustion reactions into the developed CFD models. This addition is crucial for a more comprehensive understanding of combustion efficiency and CO2 capture efficiency within the CLC-FCC systems. Additionally, there is a compelling need to investigate an advanced configuration of the CLC-FCC concept, particularly focusing on interconnected three fluidized bed reactor configurations. These configurations, comprising the air reactor, regenerator, and riser reactor, present a complex yet potentially more efficient system for particle fluidization and energy conversion. By operating and studying these interconnected systems, the intricacies of particle dynamics and fluidization between the reactors can be demonstrated. This investigation will not only enhance the understanding of the CLC-FCC process but also contribute to optimizing the design and operation of these systems for improved efficiency and reduced environmental impact.
Authorship contribution
Ahmet Erdoğan: Conceptualization, Formal analysis, Methodology, Investigation, Validation, Visualization, Project administration, Writing – original draft, Writing – review & editing. Fatih Güleç: Conceptualization, Methodology, Formal analysis, Funding acquisition, Project administration, Writing – review & editing.
Acknowledgements
This work was supported by the Engineering and Physical Sciences Research Council (EPSRC) [EP/S036113/1], Connected Everything II: Accelerating Digital Manufacturing Research Collaboration and Innovation. The authors also gratefully acknowledge the financial support provided by the University of Nottingham, Faculty Pro-Vice-Chancellor Research Acceleration Fund (Fatih Güleç).
Disclosure statement
The authors declare that they have no known competing financial interests or personal relationships that could have appeared to influence the work reported in this paper.
Additional information
Funding
Notes on contributors
Ahmet Erdoğan
Dr Ahmet Erdoğan is a visiting academic at the University of Nottingham and an Assistant Professor in the Department of Mechanical Engineering at İnönü University. He obtained his Ph.D. in Mechanical Engineering from İnönü University in 2017. His areas of interest include Computational Fluid Dynamics, Refrigeration and Air Conditioning, and CO2 capture.
Fatih Güleç
Dr Fatih Gulec is an Assistant Professor in the Department of Chemical and Environmental Engineering at the University of Nottingham with expertise in energy and industrial decarbonisation. Dr gulec’s research encompasses (i) the synthesis and characterisation of advanced nanocomposites and their applications in chemical/calcium looping technologies, CO2 capture, negative emissions, energy storage and catalytic reactions and (ii) process integration/intensification based on waste/biomass-to-energy via thermal conversion.
References
- Almuttahar, A., and F. Taghipour. 2008. Computational fluid dynamics of high density circulating fluidized bed riser: Study of modeling parameters. Powder Technology 185 (1):11–23. doi:10.1016/j.powtec.2007.09.010.
- Alobaid, F., N. Almohammed, M. M. Farid, J. May, P. Rößger, A. Richter, and B. Epple. 2022. Progress in cfd simulations of fluidized beds for chemical and energy process engineering. Progress in Energy and Combustion Science 91:100930. doi:10.1016/j.pecs.2021.100930.
- Alzate Hernández, J. D. 2016. CFD simulation of an industrial FCC regenerator. MSc diss., Universidad Nacional De Colombia-Sede Medellin.
- Amblard, B., R. Singh, E. Gbordzoe, and L. Raynal. 2017. Cfd modeling of the coke combustion in an industrial fcc regenerator. Chemical Engineering Science 170:731–742. doi:10.1016/j.ces.2016.12.055.
- Azarnivand, A., Y. Behjat, and A. A. Safekordi. 2018. Cfd simulation of gas–solid flow patterns in a downscaled combustor-style fcc regenerator. Particuology 39:96–108. doi:10.1016/j.partic.2017.10.009.
- Chang, J., G. Wang, X. Lan, J. Gao, and K. Zhang. 2013. Computational investigation of a turbulent fluidized-bed fcc regenerator. Industrial & Engineering Chemistry Research 52 (11):4000–4010. doi:10.1021/ie3013659.
- Chang, J., J. Zhao, K. Zhang, and J. Gao. 2016. Hydrodynamic modeling of an industrial turbulent fluidized bed reactor with fcc particles. Powder Technology 304:134–142. doi:10.1016/j.powtec.2016.04.048.
- Chew, J. W., W. C. Q. Lamarche, and R. A. Cocco. 2022. 100 years of scaling up fluidized bed and circulating fluidized bed reactors. Powder Technology 409:117813. doi:10.1016/j.powtec.2022.117813.
- Erdoğan, A. 2023. A three-dimensional cfd study on multiphase flow in an fcc regenerator integrated with oxy-combustion. Journal of Applied Fluid Mechanics 17 (2):398–409.
- Fluent, A. 2009. Ansys fluent 12.0 user’s guide. Ansys Inc 15317:1–2498.
- Gao, J., X. Lan, Y. Fan, J. Chang, G. Wang, C. Lu, and C. Xu. 2009a. Cfd modeling and validation of the turbulent fluidized bed of fcc particles. AIChE journal 55 (7):1680–1694. doi:10.1002/aic.11824.
- Gao, J., X. Lan, Y. Fan, J. Chang, G. Wang, C. Lu, and C. Xu. 2009b. Hydrodynamics of gas–solid fluidized bed of disparately sized binary particles. Chemical Engineering Science 64 (20):4302–4316. doi:10.1016/j.ces.2009.07.003.
- Golgiyaz, S., M. F. Talu, M. Daşkın, and C. Onat. 2022. Estimation of excess air coefficient on coal combustion processes via gauss model and artificial neural network. Alexandria Engineering Journal 61 (2):1079–1089. doi:10.1016/j.aej.2021.06.022.
- Güleç, F., A. Erdogan, P. T. Clough, and E. Lester. 2021. Investigation of the hydrodynamics in the regenerator of fluid catalytic cracking unit integrated by chemical looping combustion. Fuel Processing Technology 223:106998. doi:10.1016/j.fuproc.2021.106998.
- Güleç, F., W. Meredith, and C. E. Snape. 2023. CO2 capture from fluid catalytic crackers via chemical looping combustion: Regeneration of coked catalysts with oxygen carriers. Journal of the Energy Institute 107:101187. doi:10.1016/j.joei.2023.101187.
- Li, P., X. Lan, C. Xu, G. Wang, C. Lu, and J. Gao. 2009. Drag models for simulating gas–solid flow in the turbulent fluidization of fcc particles. Particuology 7 (4):269–277. doi:10.1016/j.partic.2009.03.010.
- Schiller, L. N. A. 1933. A drag coefficient correlation. Zeit Ver Deutsch Ing 77:318–320.
- Singh, R., and E. Gbordzoe. 2017. Modeling fcc spent catalyst regeneration with computational fluid dynamics. Powder Technology 316:560–568. doi:10.1016/j.powtec.2016.10.058.
- Syamlal, M., and T. J. O’Brien. 1989. Computer simulation of bubbles in a fluidized bed. AichE Symp. Ser 85 (270): 22–31. Publ by AIChE.
- Treese, S. A., D. S. Jones, and P. R. Pujadó. 2006. Handbook of petroleum processing. Switzerland: Springer. https://link.springer.com/referencework/10.1007/978-3-319-05545-9#about-this-book.
- Tsuo, Y. P., and D. Gidaspow. 1990. Computation of flow patterns in circulating fluidized beds. AIChE journal 36 (6):885–896. doi:10.1002/aic.690360610.
- Tu, Q., H. Wang, and R. Ocone. 2022. Application of three-dimensional full-loop cfd simulation in circulating fluidized bed combustion reactors–a review. Powder Technology 399:117181. doi:10.1016/j.powtec.2022.117181.
- Wang, X., B. Jin, Y. Zhang, W. Zhong, and S. Yin. 2011. Multiphase computational fluid dynamics (cfd) modeling of chemical looping combustion using a cuo/al2o3 oxygen carrier: Effect of operating conditions on coal gas combustion. Energy & Fuels 25 (8):3815–3824. doi:10.1021/ef200403w.
- Yang, Z., Y. Zhang, T. Liu, and A. Oloruntoba. 2021. Mp-pic simulation of the effects of spent catalyst distribution and horizontal baffle in an industrial fcc regenerator. Part ii: Effects on regenerator performance. Chemical Engineering Journal 421:129694. doi:10.1016/j.cej.2021.129694.
- Yang, Z., Y. Zhang, A. Oloruntoba, and J. Yue. 2021. Mp-pic simulation of the effects of spent catalyst distribution and horizontal baffle in an industrial fcc regenerator. Part i: Effects on hydrodynamics. Chemical Engineering Journal 412:128634. doi:10.1016/j.cej.2021.128634.
- Zimmermann, S., and F. Taghipour. 2005. Cfd modeling of the hydrodynamics and reaction kinetics of fcc fluidized-bed reactors. Industrial & Engineering Chemistry Research 44 (26):9818–9827.