
Abstract
Objectives
Schizophrenia is a chronic, debilitating mental disorder whose pathophysiology is complex and not fully understood. Numerous studies suggest mitochondrial dysfunction may contribute to the development of schizophrenia. While mitochondrial ribosomes (mitoribosomes) are essential for proper mitochondrial functioning, their gene expression levels have not been studied yet in schizophrenia.
Methods
We performed a systematic meta-analysis of the expression of 81 mitoribosomes subunits encoding genes, integrating ten brain samples datasets of patients with schizophrenia compared to healthy controls (overall 422 samples, 211 schizophrenia, and 211 controls). We also performed a meta-analysis of their expression in blood, integrating two blood sample datasets (overall 90 samples, 53 schizophrenia, and 37 controls).
Results
Multiple mitoribosomes subunits were significantly downregulated in brain samples (18 genes) and in blood samples (11 genes) of individuals with schizophrenia, where two showed significant downregulation in both brain and blood, MRPL4 and MRPS7.
Conclusions
Our results support the accumulating evidence of impaired mitochondrial activity in schizophrenia. While further research is needed to validate mitoribosomes’ role as biomarkers, this direction has the potential to promote patients’ stratification and personalised treatment for schizophrenia.
Introduction
Schizophrenia is a debilitating mental illness that afflicts approximately 0.7% of the world population (Jongsma et al. Citation2019) and is characterised by various abnormal cognitive, affective, and motor behavioural symptoms. While the genetic component is estimated at around 80% (Smoller et al. Citation2019), the previous genome-wide association study (GWAS) pointed to about 290 variants associated with schizophrenia, each of which poses only a small risk (Trubetskoy et al. Citation2022). Moreover, a pronounced portion of the many small-effect identified variants resides within regulatory sequences, thus affecting gene expression rather than protein structure (Fromer et al. Citation2014). Therefore, to improve the understanding of the biological basis of schizophrenia, it is essential to study its gene expression patterns systematically.
The brain consumes about ten times more oxygen and glucose than other tissues and has exceptionally high energy demands. Adenosine triphosphate (ATP), the energy coin of the cell, is primarily produced by oxidative phosphorylation in the mitochondria (Hüttemann et al. Citation2008). Mitochondria are dynamic, structurally complex organelles that can fuse, divide, and move around the cell (Youle and van der Bliek Citation2012; Ahmad et al. Citation2013). Aside from supplying cellular energy, mitochondria also play a role in the modulation of synaptic activity (Li et al. Citation2004; Miller and Sheetz Citation2004; Szabadkai and Duchen Citation2008; Sheng and Cai Citation2012), production of reactive oxygen species (Chang and Reynolds Citation2006) as well as controlling the cell cycle and growth for excitatory cells, such as neurons and muscles. Therefore, it is unsurprising that multiple studies have identified an association between mitochondrial abnormalities and schizophrenia (reviewed in Roberts [Citation2021]).
In the striatum of patients with schizophrenia, mitochondrial number and volume were found to be reduced (Kung and Roberts Citation1999; Uranova et al. Citation2001; Ni and Chung Citation2020). Further studies (Mulcrone et al. Citation1995; Whatley et al. Citation1996; Prince et al. Citation1999; Citation2000; Maurer et al. Citation2001; Washizuka et al. Citation2009; Bergman and Ben-Shachar Citation2016) suggest that mitochondrial dysfunction contributes to the pathophysiology of schizophrenia. Several schizophrenia cohorts have shown down-regulation of mitochondrial gene expression (for example, Altar et al. Citation2005; Glausier et al. Citation2020; Katz Shroitman et al. Citation2023; Segev et al. Citation2023). As reviewed by Hjelm et al. (Citation2015), 57 mitochondrial genes were found to be associated with schizophrenia in at least two independent studies. Twenty-one of the genes were associated by genome-wide association or copy-number variation studies, and twenty-two showed altered expression in schizophrenia, all down-regulated (listed in in Hjelm et al. [Citation2015]).
Table 1. Characteristics of individual studies included in the meta-analysis.
Mitochondria originated from an α-proteobacterial ancestor by endosymbiosis and contain their DNA, as well as mitochondrial ribosomes (mitoribosomes), protein complexes responsible for the translation of mRNA encoded by the mitochondrial DNA. Mitoribosomes, like cytoplasmic ribosomes, are composed of small and large sub-units. The mitoribosome subunits are encoded by genes called Mitochondrial Ribosomal Proteins (MRPs), Small (MRPS), and Large (MRPL). The MRPs are encoded in the nuclear DNA and assembled by cytoplasmic ribosomes before being implanted into the mitochondria. Mitoribosomes specialise in synthesising polypeptides, which are essential for oxidative phosphorylation and ATP production (De Silva et al. Citation2015).
MRPs were associated with brain-related disorders (Gopisetty and Thangarajan Citation2016). For example, differential expression of MRPs genes was detected in the hypothalamus of mice following Chronic Social Defeat Stress. Mitoribosome subunits genes were also explicitly associated with schizophrenia: MRPL genes located in 22q11 were associated with schizophrenia in a copy-number variation study (Szatkiewicz et al. Citation2014). Further support for a possible role of MRPL genes located in 22q11 provides the established association between 22q11 deletions, such as DiGeorge syndrome, and schizophrenia (Rizvi et al. Citation2018).
Despite the evidence for their potential role in schizophrenia, to our knowledge, no studies that explored MRPL and MRPS genes’ expression in schizophrenia have been published. We performed a systematic meta-analysis of mitoribosomes subunits gene expression in brain and blood samples of individuals with schizophrenia vs. healthy controls.
Methods
Identification and selection of eligible gene expression datasets for meta-analysis
Publicly available gene expression datasets were searched in three public repositories: NCBI Gene Expression Omnibus (GEO) (http://www.ncbi.nlm.nih.gov/geo/), the Stanley Medical Research Institute (SMRI) Array Collection (http://www.stanleyresearch.org/brain-research/array-collection/) and the CommonMind Consortium (CMC) (Khadimallah et al. Citation2022). The following keywords and combinations were used: schizophrenia, Brodmann area 10, Brodmann area 22/STG, cerebellum, Parietal cortex, striatum, gene expression, and human brain samples. presents the complete workflow of eligible dataset selection, following the Preferred Reporting Items for Systematic Reviews and Meta-Analysis (PRISMA) 2009 guidelines (Liberati et al. Citation2009).
Figure 1. The flow of information through the different stages of the selection of gene expression datasets for meta-analysis.
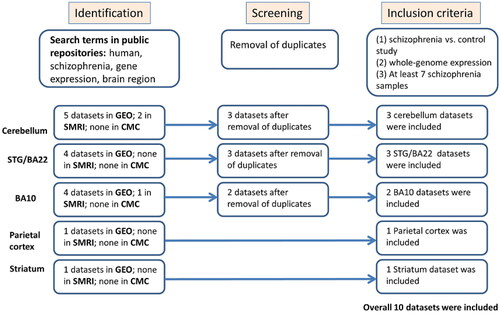
The following information was extracted from each identified study: sample type, platform, number of cases and controls, Pubmed ID, and the preprocessed gene expression data (). The overall number of samples included is 211 brain samples of individuals with schizophrenia and 212 brain samples of healthy controls. Inclusion criteria were set and strictly followed for dataset selection: human schizophrenia versus control study of post-mortem Brodmann area 10, Brodmann area 22/STG, cerebellum, parietal cortex or striatum samples, a minimum of 7 samples of individuals with schizophrenia, comparable conditions, and availability of gene expression preprocessed data. The complete datasets characteristics are described in the supplemental information.
Gene expression meta-analysis
For a given gene, a meta-analysis that integrates its expression in the gene expression datasets was applied as follows. Effect size (Hedges’ g [Hedges Citation1981]), the standardised difference between the expression in the disease vs. control samples, was calculated separately for each dataset. The direction of the effect size was positive if the expression in the disease group was higher than in the control group. Hedges’ g and confidence interval values were calculated for each of the datasets using the function “metacont” from the “meta” package in R, a general package for meta-analysis, version 4.9–2 (Schwarzer Citation2007). The summary measure of the datasets with its confidence interval was calculated by the same function, using the random effects model (Fleiss Citation1993).
Estimation of the effect of potential confounding factors
In order to explore a potential association between differential expression and antipsychotic medications, we performed correlation analyses between gene expression patterns and Fluphenazine equivalent dosage, available for the Stanley#6 dataset (http://www.stanleyresearch.org/brain-research/array-collection/). Pearson Correlation between the lifetime quantity of Fluphenazine or equivalent antipsychotic (in mg) and gene expression was calculated along the individuals with schizophrenia.
Additional potential confounding factors are the brain samples’ pH and post-mortem interval (PMI), which show significant differences between patients and controls in several datasets (), and were also shown to potentially affect gene expression (Birdsill et al. Citation2011; Park et al. Citation2021). In order to account for the potential effects of pH, PMI, and the age of the patients, a linear model was fitted to each gene by a stepwise procedure (Pope and Webster Citation1972), using the MATLAB function “stepwiselm” with default parameters. Age, PMI, and pH were included as covariates. The model was then refitted using only the selected variables, including diagnosis. Finally, for each gene, the diagnosis coefficient was statistically tested for being nonzero, implying an effect for schizophrenia beyond any other effect of the covariates. This produced a t-statistic and a corresponding p-value.
Results
Multiple mitoribosome subunit genes are downregulated in both brain and blood samples of individuals with schizophrenia
We have performed a systematic meta-analysis of 50 MRPL genes and 31 MRPS genes’ expression in 422 brain samples (211 schizophrenia vs. 211 healthy controls), integrating ten gene expression datasets (). Eighteen MRPL and MRPS genes were significantly downregulated in schizophrenia (). Moreover, 35 of the genes (43%) show a tendency for down-regulation (Table 1S; Random effects Hedges value < −0.15). Only four genes were found to have a tendency for up-regulation (Random effects Hedges value > 0.15), where none had significant differential expression (Supplemental Table 1S).
Table 2. Brain samples statistically significant MRPL and MRPS gene expression meta-analysis results.
We next explored whether mitoribosome subunit genes are differentially expressed not only in the brain samples, but also in blood samples of patients with schizophrenia and thus might serve as biomarkers. We performed a meta-analysis of MRPL and MRPS genes’ expression using two publicly available peripheral blood gene expression datasets (; overall 90 samples, 53 schizophrenia, and 37 controls): (1) van Beveren et al. Citation2012 data (van Beveren et al. Citation2012) of Peripheral Blood Mononuclear Cells (PBMCs) samples of 41 patients with schizophrenia and 29 controls; (2) Bousman et al. Citation2010 data (Bousman et al. Citation2010) of whole blood samples of 12 patients with schizophrenia and eight controls (downloaded from Gene Expression Omnibus (GEO) (http://www.ncbi.nlm.nih.gov/geo/); see supplementary information for detailed datasets information). Eleven MRPL and five MRPS genes were significantly downregulated in schizophrenia (). Moreover, 38 of the genes (52%) show a tendency for down-regulation (Supplemental Table 2S; Random effects Hedges value < −0.15). Nine genes were found to have a tendency for up-regulation (Random effects Hedges value > 0.15), where none had significant differential expression (Supplemental Table 2S).
Table 3. Blood samples statistically significant MRPL and MRPS gene expression meta-analysis results.
Two of the genes were found to be significantly down-regulated in both brain and blood, MRPL4 and MRPS7 (, ), while 18 genes showed a tendency for down-regulation (Random effects Hedges value < −0.15) in both brain and blood.
Figure 2. Meta-analysis of MRPL4 and MRPS7 differential expression in ten brain samples and two blood samples of individuals with schizophrenia vs. healthy controls. (A) Brain samples MRPL4 meta-analysis. A forest plot was generated using the function “forest” from the “meta” package in R, version 4.9–2 (General Package for Meta-Analysis) (Schwarzer Citation2007). Each square represents the standardised difference (Hedges’ g [Hedges Citation1981]) between schizophrenia and control for a specific dataset, with the area of the square reflecting the weight (determined by the sample size) given to that dataset in the meta-analysis. Each horizontal line represents the 95% confidence interval for the mean difference in that study. The vertical line shows the point of zero difference. The standardised difference is positive (negative) if the expression is higher (lower) in schizophrenia vs. the control group. The vertical dashed red line points at the centre of the diamond, which represents the overall difference across both studies, and its width represents a 95% confidence interval. (B) Blood samples MRPL4 meta-analysis. (C) Brain samples MRPS7 meta-analysis. (D) Blood samples MRPS7 meta-analysis.
![Figure 2. Meta-analysis of MRPL4 and MRPS7 differential expression in ten brain samples and two blood samples of individuals with schizophrenia vs. healthy controls. (A) Brain samples MRPL4 meta-analysis. A forest plot was generated using the function “forest” from the “meta” package in R, version 4.9–2 (General Package for Meta-Analysis) (Schwarzer Citation2007). Each square represents the standardised difference (Hedges’ g [Hedges Citation1981]) between schizophrenia and control for a specific dataset, with the area of the square reflecting the weight (determined by the sample size) given to that dataset in the meta-analysis. Each horizontal line represents the 95% confidence interval for the mean difference in that study. The vertical line shows the point of zero difference. The standardised difference is positive (negative) if the expression is higher (lower) in schizophrenia vs. the control group. The vertical dashed red line points at the centre of the diamond, which represents the overall difference across both studies, and its width represents a 95% confidence interval. (B) Blood samples MRPL4 meta-analysis. (C) Brain samples MRPS7 meta-analysis. (D) Blood samples MRPS7 meta-analysis.](/cms/asset/58f0a243-ece5-4af2-bbef-9049ddfe815a/iwbp_a_2211653_f0002_c.jpg)
When we repeated the meta-analysis for females and males separately, the downregulation was more prominent in males (Supplemental Table 3S). Sixteen MRPL and MRPS genes were found to be significantly differentially expressed in male patients compared to healthy male controls, all downregulated, while only two genes were found in female patients. Interestingly, in the female patients, one of the genes was found to be upregulated, MRPL35, and one downregulated, MRPL54, when compared to healthy female controls.
Examination of the effect of potential confounding factors
A possible confounding factor for differential expression between patients with schizophrenia and controls is the antipsychotic therapy given to the patients. In order to examine an association between MRPs expression and antipsychotic treatment, we performed correlation analysis of lifetime Fluphenazine or equivalent antipsychotics available for the BA10 Iwamoto et al. (Citation2004) and Stanley#6 datasets, and four out of the 18 MRPs genes that were found to be significantly downregulated in our meta-analysis. No significant correlation was detected in both datasets (). Thus, the correlation analysis suggests that MRPs down-regulation is not associated with antipsychotic treatment dose.
Additional potential confounding factors are the brain samples’ pH and PMI and the patient’s age. We fitted a linear model to account for their potential effects, including them as covariates (see Methods). The results are listed in Supplemental Table 4S. To summarise the linear regression analysis for each of the genes, the mean t-statistic values were calculated. A clear tendency for downregulation for most of the 18 MRPs genes found to be down-regulated in our meta-analysis was shown after accounting for pH, PMI, and age effects (Supplemental Table 4S; mean t-statistic < −0.5 for 14 of the 18 genes).
Discussion
In this study, we have conducted a systematic meta-analysis of multiple mitoribosome subunit genes expression in schizophrenia. We included ten gene expression datasets from five different brain regions known to be involved in the pathophysiology of schizophrenia – cerebellum (Andreasen and Pierson Citation2008; Yeganeh-Doost et al. Citation2011) STG/BA22 (Goldstein et al. Citation2009; Kunii et al. Citation2011; Orlov et al. Citation2018) BA10 (Pomarol-Clotet et al. Citation2010; Sekiguchi et al. Citation2019; Uranova et al. Citation2021) Parietal cortex (Zhou et al. Citation2007; Chieffi et al. Citation2018; Hahn et al. Citation2018) and Striatum (Simpson et al. Citation2010; Sorg et al. Citation2013). Overall, 422 brain samples (211 schizophrenia and 211 healthy controls) were analysed for the differential expression of 50 MRPL and 31 MRPS genes. We detected significant down-regulation of 18 MRPL and MRPS genes in schizophrenia; none showed up-regulation. In addition, 11 of the genes were significantly downregulated in blood samples of individuals with schizophrenia.
Despite the evidence for their potential role in schizophrenia, to our knowledge, no studies that explored MRPL and MRPS genes’ expression in schizophrenia have been published. Given their crucial role in oxidative phosphorylation that facilitates ATP production aerobically, our results suggest they might play a role in mitochondrial dysfunction observed in schizophrenia. As a result of mitochondrial dysfunction, dopamine synthesis, release, and metabolism may be altered, contributing to schizophrenia (Xu and Yang Citation2022). The interaction between dopamine metabolism abnormalities and mitochondrial defects (Jones et al. Citation2000; Xu et al. Citation2010) may have implications for schizophrenia treatment, as most drugs used today target dopamine D2 receptors (Amato et al. Citation2020). Interventions targeting both systems may have a synergistic effect and be more effective in treating schizophrenia. In addition, the blood samples’ differential expression suggests a potential role for mitoribosome genes as biomarkers in schizophrenia. Interestingly, a study of 138 early psychosis patients vs. 134 healthy controls pointed at potential blood biomarkers of mitochondrial dysfunction, which were associated with worse psychopathological status and neurocognitive performance (Khadimallah et al. Citation2022). Further validation of biomarkers for mitochondrial dysfunction has the potential to lead to patients’ stratification and possibly targeted therapy, such as mitoQ, a mitochondria-targeted antioxidant (Khadimallah et al. Citation2022). However, this direction necessitates further study.
This study has several limitations, just as there are to other post-mortem studies. Results may not reflect the disease’s mechanism and expression levels when first diagnosed or during its progression, as they were measured at the time of death. However, replicating our results in blood samples of patients with schizophrenia and previous studies that detected markers of mitochondrial dysfunction in early psychosis patients (for example, (Khadimallah et al. Citation2022)) suggests that the signal also exists in living individuals with schizophrenia. The fact that the downregulation signal was much more prominent in men (Supplemental Table 3S) might indicate that it characterises males more than females. However, it should be noted that the number of female samples included in the meta-analysis was much lower than that of men (60%, 147 females vs. 246 men; ). Thus, the different signals may also result from the females’ smaller sample size, which might have limited the ability to reach statistical significance.
We note that in most of the brain and blood datasets, when analysed separately, MRPL4 and MRPS7 differential expression did not reach statistical significance (95% confidence interval intersects zero in ). This observation is in accordance with the notion that multiple genes are involved in the pathophysiology of schizophrenia, in multiple regions, each with a small contribution (Trubetskoy et al. Citation2022; Owen Citation2023), and only when a meta-analysis is performed can statistical significance be achieved. This, together with the fact that the overall number of blood samples included in our meta-analysis is modest (90 samples, 53 schizophrenia, and 37 controls), suggests further study is needed to validate the potential role of MRPL4 and MRPS7 as blood biomarkers. Additionally, antipsychotics may influence gene expression. However, our correlation analysis suggests that the antipsychotic treatment dose is not responsible for the downregulation we observed. Linear regression analysis suggests that changes in pH, PMI, or the age of the patients do not explain the downregulation we detect in MRPs expression. Moreover, integrating ten datasets that were measured on separate populations using different platforms increased the generalisability and validity of the results. Another limitation, common to all gene expression studies, is that gene expression does not always correlate with actual protein levels, which limits the ability to reach definitive conclusions regarding the biological meaning of our results.
In conclusion, this meta-analysis revealed the down-regulation of multiple mitoribosome genes in both brain and blood samples from patients with schizophrenia vs. healthy controls. Our results support the accumulating evidence of impaired mitochondria activity in the pathophysiology of schizophrenia. While further research is needed to validate their role as biomarkers for mitochondrial dysfunction in schizophrenia, this direction has the potential to lead to patient stratification and pave the way to personalised treatment for schizophrenia.
Supplemental Material
Download MS Word (142.3 KB)Acknowledgements
None.
Statement of interest
None to declare.
References
- Ahmad T, Aggarwal K, Pattnaik B, Mukherjee S, Sethi T, Tiwari BK, Kumar M, Micheal A, Mabalirajan U, Ghosh B, et al. 2013. Computational classification of mitochondrial shapes reflects stress and redox state. Cell Death Dis. 4(1):e461–e461.
- Altar CA, Jurata LW, Charles V, Lemire A, Liu P, Bukhman Y, Young TA, Bullard J, Yokoe H, Webster MJ, et al. 2005. Deficient hippocampal neuron expression of proteasome, ubiquitin, and mitochondrial genes in multiple schizophrenia cohorts. Biol Psychiatry. 58(2):85–96.
- Amato D, Canneva F, Cumming P, Maschauer S, Groos D, Dahlmanns JK, Grömer TW, Chiofalo L, Dahlmanns M, Zheng F, et al. 2020. A dopaminergic mechanism of antipsychotic drug efficacy, failure, and failure reversal: the role of the dopamine transporter. Mol Psychiatry. 25(9):2101–2118.
- Andreasen NC, Pierson R. 2008. The role of the cerebellum in schizophrenia. Biol Psychiatry. 64(2):81–88.
- Barnes MR, Huxley-Jones J, Maycox PR, Lennon M, Thornber A, Kelly F, Bates S, Taylor A, Reid J, Jones N, et al. 2011. Transcription and pathway analysis of the superior temporal cortex and anterior prefrontal cortex in schizophrenia. J Neurosci Res. 89(8):1218–1227.
- Bergman O, Ben-Shachar D. 2016. Mitochondrial oxidative phosphorylation system (OXPHOS) deficits in schizophrenia. Can J Psychiatry. 61(8):457–469.
- van Beveren NJM, Buitendijk GHS, Swagemakers S, Krab LC, Röder C, de Haan L, van der Spek P, Elgersma Y. 2012. Marked reduction of AKT1 expression and deregulation of AKT1-associated pathways in peripheral blood mononuclear cells of schizophrenia patients. PLoS One. 7(2):e32618.
- Birdsill AC, Walker DG, Lue L, Sue LI, Beach TG. 2011. Postmortem interval effect on RNA and gene expression in human brain tissue. Cell Tissue Bank. 12(4):311–318.
- Bousman CA, Chana G, Glatt SJ, Chandler SD, Lucero GR, Tatro E, May T, Lohr JB, Kremen WS, Tsuang MT, et al. 2010. Preliminary evidence of ubiquitin proteasome system dysregulation in schizophrenia and bipolar disorder: convergent pathway analysis findings from two independent samples. Am J Med Genet. 153B(2):494–502.
- Chang DTW, Reynolds IJ. 2006. Mitochondrial trafficking and morphology in healthy and injured neurons. Prog Neurobiol. 80(5):241–268.
- Chen C, Cheng L, Grennan K, Pibiri F, Zhang C, Badner JA, Kelsoe JR, Greenwood TA, Nievergelt CM, Barrett TB, et al. 2013. Two gene co-expression modules differentiate psychotics and controls. Mol Psychiatry. 18(12):1308–1314.
- Chieffi S, Ilardi CR, Iavarone A. 2018. Parietal lobe dysfunction in schizophrenia: a review. CPSR. 14(2):71–83.
- De Silva D, Tu Y-T, Amunts A, Fontanesi F, Barrientos A. 2015. Mitochondrial ribosome assembly in health and disease. Cell Cycle. 14(14):2226–2250.
- Fleiss JL. 1993. The statistical basis of meta-analysis. Stat Methods Med Res. 2(2):121–145.
- Fromer M, Pocklington AJ, Kavanagh DH, Williams HJ, Dwyer S, Gormley P, Georgieva L, Rees E, Palta P, Ruderfer DM, et al. 2014. De novo mutations in schizophrenia implicate synaptic networks. Nature. 506(7487):179–184.
- Glausier JR, Enwright JF, Lewis DA. 2020. Diagnosis- and cell type-specific mitochondrial functional pathway signatures in schizophrenia and bipolar disorder. Am J Psychiatry. 177(12):1140–1150.
- Goldstein KE, Hazlett EA, New AS, Haznedar MM, Newmark RE, Zelmanova Y, Passarelli V, Weinstein SR, Canfield EL, Meyerson DA, et al. 2009. Smaller superior temporal gyrus volume specificity in schizotypal personality disorder. Schizophr Res. 112(1-3):14–23.
- Gopisetty G, Thangarajan R. 2016. Mammalian mitochondrial ribosomal small subunit (MRPS) genes: a putative role in human disease. Gene. 589(1):27–35.
- Hahn B, Robinson BM, Leonard CJ, Luck SJ, Gold JM. 2018. Posterior parietal cortex dysfunction is central to working memory storage and broad cognitive deficits in schizophrenia. J Neurosci. 38(39):8378–8387.
- Hedges LV. 1981. Distribution theory for glass’s estimator of effect size and related estimators. J Educ Stat. 6(2):107–128.
- Hjelm BE, Rollins B, Mamdani F, Lauterborn JC, Kirov G, Lynch G, Gall CM, Sequeira A, Vawter MP. 2015. Evidence of mitochondrial dysfunction within the complex genetic etiology of schizophrenia. Mol Neuropsychiatry. 1(4):201–219.
- Hüttemann M, Lee I, Pecinova A, Pecina P, Przyklenk K, Doan JW. 2008. Regulation of oxidative phosphorylation, the mitochondrial membrane potential, and their role in human disease. J Bioenerg Biomembr. 40(5):445–456.
- Iwamoto K, Kakiuchi C, Bundo M, Ikeda K, Kato T. 2004. Molecular characterization of bipolar disorder by comparing gene expression profiles of postmortem brains of major mental disorders. Mol Psychiatry. 9(4):406–416.
- Jones DC, Gunasekar PG, Borowitz JL, Isom GE. 2000. Dopamine-induced apoptosis is mediated by oxidative stress and is enhanced by cyanide in differentiated PC12 cells. J Neurochem. 74(6):2296–2304.
- Jongsma HE, Turner C, Kirkbride JB, Jones PB. 2019. International incidence of psychotic disorders, 2002-17: a systematic review and meta-analysis. Lancet Public Health. 4(5):e229–e244.
- Katz Shroitman N, Yitzhaky A, Ben Shachar D, Gurwitz D, Hertzberg L. 2023. Meta-analysis of brain samples of individuals with schizophrenia detects down-regulation of multiple ATP synthase encoding genes in both females and males. J Psychiatr Res. 158:350–359.
- Khadimallah I, Jenni R, Cabungcal J-H, Cleusix M, Fournier M, Beard E, Klauser P, Knebel J-F, Murray MM, Retsa C, et al. 2022. Mitochondrial, exosomal miR137-COX6A2 and gamma synchrony as biomarkers of parvalbumin interneurons, psychopathology, and neurocognition in schizophrenia. Mol Psychiatry. 27(2):1192–1204.
- Kung L, Roberts RC. 1999. Mitochondrial pathology in human schizophrenic striatum: a postmortem ultrastructural study. Synapse. 31(1):67–75.
- Kunii Y, Yabe H, Wada A, Yang Q, Nishiura K, Niwa S-I. 2011. Altered DARPP-32 expression in the superior temporal gyrus in schizophrenia. Prog Neuropsychopharmacol Biol Psychiatry. 35(4):1139–1143.
- Lanz TA, Reinhart V, Sheehan MJ, Rizzo SJS, Bove SE, James LC, Volfson D, Lewis DA, Kleiman RJ. 2019. Postmortem transcriptional profiling reveals widespread increase in inflammation in schizophrenia: a comparison of prefrontal cortex, striatum, and hippocampus among matched tetrads of controls with subjects diagnosed with schizophrenia, bipolar or major depressive disorder. Transl Psychiatry. 9(1):1–13.
- Li Z, Okamoto K-I, Hayashi Y, Sheng M. 2004. The importance of dendritic mitochondria in the morphogenesis and plasticity of spines and synapses. Cell. 119(6):873–887.
- Liberati A, Altman DG, Tetzlaff J, Mulrow C, Gøtzsche PC, Ioannidis JPA, Clarke M, Devereaux PJ, Kleijnen J, Moher D. 2009. The PRISMA statement for reporting systematic reviews and meta-analyses of studies that evaluate health care interventions: explanation and elaboration. J Clin Epidemiol. 62(10):e1–e34.
- Maurer I, Zierz S, Möller H-J. 2001. Evidence for a mitochondrial oxidative phosphorylation defect in brains from patients with schizophrenia. Schizophr Res. 48(1):125–136.
- Maycox PR, Kelly F, Taylor A, Bates S, Reid J, Logendra R, Barnes MR, Larminie C, Jones N, Lennon M, et al. 2009. Analysis of gene expression in two large schizophrenia cohorts identifies multiple changes associated with nerve terminal function. Mol Psychiatry. 14(12):1083–1094.
- Miller KE, Sheetz MP. 2004. Axonal mitochondrial transport and potential are correlated. J Cell Sci. 117(Pt 13):2791–2804.
- Mulcrone J, Whatley SA, Ferrier IN, Marchbanks RM. 1995. A study of altered gene expression in frontal cortex from schizophrenic patients using differential screening. Schizophr Res. 14(3):203–213.
- Ni P, Chung S. 2020. Mitochondrial dysfunction in schizophrenia. BioEssays. 42(6):1900202.
- Orlov ND, Giampietro V, O’Daly O, Lam S-L, Barker GJ, Rubia K, McGuire P, Shergill SS, Allen P. 2018. Real-time fMRI neurofeedback to down-regulate superior temporal gyrus activity in patients with schizophrenia and auditory hallucinations: a proof-of-concept study. Transl Psychiatry. 8(1):1–10.
- Owen MJ. 2023. Genomic insights into schizophrenia. R Soc Open Sci. 10(2):230125.
- Park H-J, Choi I, Leem K-H. 2021. Decreased brain pH and pathophysiology in schizophrenia. IJMS. 22(16):8358.
- Paz RD, Andreasen NC, Daoud SZ, Conley R, Roberts R, Bustillo J, Perrone-Bizzozero NI. 2006. Increased expression of activity-dependent genes in cerebellar glutamatergic neurons of patients with schizophrenia. Am J Psychiatry. 163(10):1829–1831.
- Pietersen CY, Mauney SA, Kim SS, Lim MP, Rooney RJ, Goldstein JM, Petryshen TL, Seidman LJ, Shenton ME, McCarley RW, et al. 2014. Molecular profiles of pyramidal neurons in the superior temporal cortex in schizophrenia. J Neurogenet. 28(1-2):53–69.
- Pietersen CY, Mauney SA, Kim SS, Passeri E, Lim MP, Rooney RJ, Goldstein JM, Petreyshen TL, Seidman LJ, Shenton ME, et al. 2014. Molecular profiles of parvalbumin-immunoreactive neurons in the superior temporal cortex in schizophrenia. J Neurogenet. 28(1–2):70–85.
- Pomarol-Clotet E, Canales-Rodríguez EJ, Salvador R, Sarró S, Gomar JJ, Vila F, Ortiz-Gil J, Iturria-Medina Y, Capdevila A, McKenna PJ. 2010. Medial prefrontal cortex pathology in schizophrenia as revealed by convergent findings from multimodal imaging. Mol Psychiatry. 15(8):823–830.
- Pope PT, Webster JT. 1972. The use of an F-statistic in stepwise regression procedures. Technometrics. 14(2):327–340.
- Prince JA, Blennow K, Gottfries CG, Karlsson I, Oreland L. 1999. Mitochondrial function is differentially altered in the basal ganglia of chronic schizophrenics. Neuropsychopharmacology. 21(3):372–379.
- Prince JA, Harro J, Blennow K, Gottfries CG, Oreland L. 2000. Putamen mitochondrial energy metabolism is highly correlated to emotional and intellectual impairment in schizophrenics. Neuropsychopharmacology. 22(3):284–292.
- Rizvi S, Khan AM, Saeed H, Aribara AM, Carrington A, Griffiths A, Mohit A. 2018. Schizophrenia in DiGeorge syndrome: a unique case report. Cureus. 10(8):e3142.
- Roberts RC. 2021. Mitochondrial dysfunction in schizophrenia: with a focus on postmortem studies. Mitochondrion. 56:91–101.
- Schwarzer G. 2007. Meta: An R package for meta-analysis. R News. 7(3):40–45.
- Segev S, Yitzhaky A, Ben Shachar D, Hertzberg L. 2023. VDAC genes down-regulation in brain samples of individuals with schizophrenia is revealed by a systematic meta-analysis. Neurosci Res. https://doi.org/10.1016/j.neures.2023.01.012
- Sekiguchi H, Pavey G, Dean B. 2019. Altered levels of dopamine transporter in the frontal pole and dorsal striatum in schizophrenia. NPJ Schizophr. 5(1):20.
- Sheng Z-H, Cai Q. 2012. Mitochondrial transport in neurons: impact on synaptic homeostasis and neurodegeneration. Nat Rev Neurosci. 13(2):77–93.
- Simpson EH, Kellendonk C, Kandel E. 2010. A possible role for the striatum in the pathogenesis of the cognitive symptoms of schizophrenia. Neuron. 65(5):585–596.
- Smoller JW, Andreassen OA, Edenberg HJ, Faraone SV, Glatt SJ, Kendler KS. 2019. Psychiatric genetics and the structure of psychopathology. Mol Psychiatry. 24(3):409–420.
- Sorg C, Manoliu A, Neufang S, Myers N, Peters H, Schwerthöffer D, Scherr M, Mühlau M, Zimmer C, Drzezga A, et al. 2013. Increased intrinsic brain activity in the striatum reflects symptom dimensions in schizophrenia. Schizophr Bull. 39(2):387–395.
- Szabadkai G, Duchen MR. 2008. Mitochondria: the hub of cellular Ca2+ signaling. Physiology (Bethesda). 23(2):84–94.
- Szatkiewicz JP, O’Dushlaine C, Chen G, Chambert K, Moran JL, Neale BM, Fromer M, Ruderfer D, Akterin S, Bergen SE, et al. 2014. Copy number variation in schizophrenia in Sweden. Mol Psychiatry. 19(7):762–773.
- Trubetskoy V, Pardiñas AF, Qi T, Panagiotaropoulou G, Awasthi S, Bigdeli TB, Bryois J, Chen C-Y, Dennison CA, Hall LS, et al. 2022. Mapping genomic loci implicates genes and synaptic biology in schizophrenia. Nature. 604(7906):502–508.
- Uranova N, Orlovskaya D, Vikhreva O, Zimina I, Kolomeets N, Vostrikov V, Rachmanova V. 2001. Electron microscopy of oligodendroglia in severe mental illness. Brain Res Bull. 55(5):597–610.
- Uranova NA, Vikhreva OV, Rakhmanova VI. 2021. Abnormal microglial reactivity in gray matter of the prefrontal cortex in schizophrenia. Asian J Psychiatr. 63:102752.
- Washizuka S, Iwamoto K, Kakiuchi C, Bundo M, Kato T. 2009. Expression of mitochondrial complex I subunit gene NDUFV2 in the lymphoblastoid cells derived from patients with bipolar disorder and schizophrenia. Neurosci Res. 63(3):199–204.
- Whatley SA, Curti D, Marchbanks RM. 1996. Mitochondrial involvement in schizophrenia and other functional psychoses. Neurochem Res. 21(9):995–1004.
- Xu H, Yang F. 2022. The interplay of dopamine metabolism abnormalities and mitochondrial defects in the pathogenesis of schizophrenia. Transl Psychiatry. 12(1):464.
- Xu H, Yang H-J, McConomy B, Browning R, Li X-M. 2010. Behavioral and neurobiological changes in C57BL/6 mouse exposed to cuprizone: effects of antipsychotics. Front Behav Neurosci. 4:8.
- Yeganeh-Doost P, Gruber O, Falkai P, Schmitt A. 2011. The role of the cerebellum in schizophrenia: from cognition to molecular pathways. Clinics. 66(Suppl 1):71–77.
- Youle RJ, van der Bliek AM. 2012. Mitochondrial fission, fusion, and stress. Science. 337(6098):1062–1065.
- Zhou S-Y, Suzuki M, Takahashi T, Hagino H, Kawasaki Y, Matsui M, Seto H, Kurachi M. 2007. Parietal lobe volume deficits in schizophrenia spectrum disorders. Schizophr Res. 89(1–3):35–48.