
ABSTRACT
Objective:
To assess the epidemiological characteristics and prognostic factors of acute leukemia (AL) in children and adolescents, and make comparisons between pediatric and adult patients.
Methods:
This retrospective cohort study enrolled AL patients from the Surveillance, Epidemiology, and End Results (SEER) 1975–2016. OS in children and adolescents and adults with AL was compared and analyzed separately by age and AL subtype.
Results:
Totally 61,694 AL patients were identified, with 45,411 (73.6%) adults and 16,283 (26.4%) children and adolescents. From 2000 to 2016, the incidence rates of AL [annual percent changes (APC) = 1.2, 95%CI = 0.9–1.6, P < 0.05] and acute lymphoblastic leukemia (ALL) (APC = 1.5, 95%CI = 1.1–1.8, P < 0.05) in children and adolescents were significantly increasing. For adults, AL (APC = 0.9, 95%CI = 0.3–1.5, P < 0.05), ALL (APC = 2.5, 95%CI = 2.0–3.1, P < 0.05) and acute myeloid leukemia (AML) (APC = 0.9, 95%CI = 0.4–1.5, P < 0.05) had significantly elevated incidence rates. Overall survival (OS) in children and adolescents with AL was significantly higher than that in adults with AL (log-rank P < 0.0001). OS in children and adolescents and adults with ALL, AML and AUL decreased with age (all log-rank P < 0.0001). Older age, male sex and black race were risk factors for the survival of children and adolescents and adults with ALL, AML and AUL.
Conclusion:
From 2000 to 2016, the incidence rates of AL in children and adolescents and adults were increasing. Children and adolescents with AL had significantly better OS than adults with AL, and OS declined with age in both children and adolescents and adults with ALL, AML and AUL.
Introduction
Acute leukemia (AL) is a clonal hematopoietic stem cell disorder characterized by the rapid growth of immature white blood cells in peripheral blood and/or bone marrow [Citation1], constituting approximately 40% of all childhood cancers [Citation2]. The incidence of AL and patient survival are heterogeneous by different histological subtypes and ages. Acute lymphoblastic leukemia (ALL) is the most common malignancy prevalent in children and adolescents and accounting for three-fourths of all newly diagnosed patients with AL [Citation3,Citation4]. Its incidence is approximately 3–4 cases per 100,000 children below 15 years of age in the U.S.A., and boys have higher rates than girls [Citation2,Citation5]. ALL also accounts for about 15–20% of all adult AL, and its incidence increases with age [Citation6]. In recent years, the efficacy of treatment against ALL has significantly improved, and the 5-year survival rate can reach >80% [Citation7,Citation8]. However, there is a large number of children and adolescents with ALL who continue to relapse after receiving standard treatment and are associated with a low survival rate after relapse [Citation8,Citation9]. Acute myeloid leukemia (AML) is the most common AL in adults, with an incidence of over 20,000 cases per year in the United States alone [Citation10], with an increasing incidence with advanced age: 25.1% of new AML cases were among adults aged 65–74 years and 33.7% among those aged 75 and older. The 5-year survival for patients with AML is a dismal 28.3%, with an estimated 10,920 deaths from AML in 2019 [Citation11]. Besides, AML represents only 15% to 20% of childhood leukemias [Citation12]. Despite advances in therapy over the past decades, overall survival (OS) for children and adolescents with AML has not exceeded 70% [Citation13,Citation14]. It is important to study the epidemiological characteristics and prognostic factors of AL in different ages, so as to identify subpopulations with an increased risk of death and be able to personalize treatment options.
Recently, Zhong et al. [Citation15] illustrated that the survival rate of ALL decreased with increased age, and patients with secondary ALL had poorer OS than de novo patients aged 18–75 years after chemotherapy. Adolescents and young adults with AML were shown to have worse early mortality rate and OS compared with pediatric patients with AML [Citation12]. The epidemiology, clinical characteristics and prognostic factors of AML with and without acute promyelocytic leukemia (APL) were compared in a retrospective study by Kamath et al [Citation16]. Many studies have reported the incidence and survival of children and adolescents with various subtypes of AL, but few studies have reported the epidemiological characteristics of each type of AL in children and adolescents and the epidemiological differences between children and adolescents and adults in recent years. To be noted, different types of AL do not behave the same in children and adolescents and adults, largely because they have many biological differences, in terms of subtypes and associated gene rearrangements. The specific differences between children and adolescents and adults with AL subtypes remain unclear. In order to fill this research gap, and enhance the understanding of AL subtypes in children and adolescents and adults, and improve the prognosis of AL patients in a targeted manner, this study intended to assess the epidemiological characteristics and influencing factors of different AL subtypes in children and adolescents under the age of 20 years as well as in adults, based on the Surveillance, Epidemiology, and End Results (SEER) database.
Methods
Data source and study population
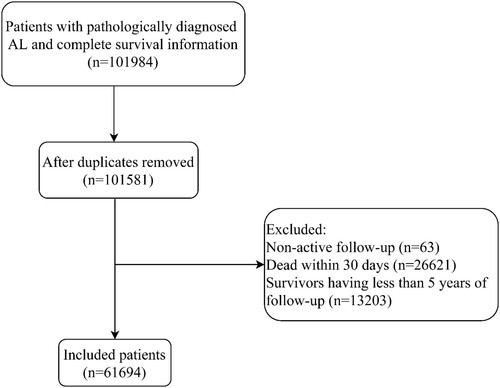
Data on AL patients in this retrospective cohort study were obtained from the SEER Program [SEER 18 Regs Custom Data (with additional treatment fields), Nov 2018 Sub (1975–2016 varying)]. Information on cancer diagnosis, treatment and survival provided by the SEER database covers approximately 30% of the U.S. population [Citation17,Citation18]. Since data from the SEER database are de-identified and publicly available, the approval of the institutional review board was exempt for this study. Patients with primary AL were enrolled between 1975 and 2016. The subtypes of AL were classified according to histology (https://seer.cancer.gov/iccc/iccc-iarc-2017.html). Inclusion criteria: (1) patients diagnosed as primary AL in line with the International Classification of Diseases for Oncology, Third Revision (ICD-O-3) [acute undifferentiated leukemia (AUL): 9801; ALL: 9811–9818, 9826, 9827, 9835–9837; AML: 9840, 9861, 9865, 9866 (APL), 9867, 9869–9874, 9891, 9895–9898, 9910, 9911, 9920, 9930, 9931]; (2) patients with complete pathological information and survival data; (3) patients of known age. Exclusion criteria: patients with reported diagnosis source from autopsy or death certificate or only clinically diagnosed; (4) patients undergoing non-active follow-up; (5) patients who died within 30 days and survivors with less than 5 years of follow-up. The selection process for patients is outlined in .
Figure 1. Flow chart of participant selection.
Data extraction
Outcomes were OS, 1-year OS, 5-year OS, cancer-specific survival (CSS), 1-year CSS, and 5-year CSS. OS was defined as the time interval between AL diagnosis and death caused by any reason. CSS was defined as the time interval between AL diagnosis and death caused by AL. CSS was included to assess survival until death due to AL (different subtypes). Data on age at diagnosis (0–9, 10–19, 20–29, 30–39, 40–49, 50–59, 60–69, >69 years), sex, race (white, black, other, unknown), insurance (uninsured, insured, any Medicaid, unknown), histological type (ALL, AML, AUL), first primary malignancy (no, yes), chemotherapy (no/unknown, yes), radiation (no, yes), and surgery (no, yes, unknown) were collected. Participants under 20 years of age were regarded as children and adolescents, and those aged 20 years and over were defined as adults. Whether a patient received chemotherapy was determined based on the chemotherapy code as shown below: 0 indicated that the patient did not receive chemotherapy or whether the patient received chemotherapy was unknown; 1 indicated that the patient received chemotherapy. Surgical treatment was defined as follows: we defined 00 as not undergoing surgery, 99 and 126 as unknown, and the rest as undergoing surgery (Supplementary File 1).
Statistical analysis
Measurement data with skewed distribution were described by median and quartile [M (Q1, Q3)], and the Kruskal–Wallis test was used for comparison between groups (children and adolescents and adults); enumeration data were expressed as the number of cases and constituent ratio [n (%)], and the Chi-square test was adopted for between-group comparison. Missing values were treated as unknown values. Annual percent changes (APCs) of the incidence rates of AL stratified by histological type were calculated for children and adolescents and adults. OS in children and adolescents and adults with AL was compared and analyzed separately by age and AL subtype. Multivariate Cox regression analysis was performed to explore prognostic factors for OS, 1-year OS, 5-year OS, CSS, 1-year CSS, and 5-year CSS in children and adolescents and adults with different AL subtypes, through adjusting for variables that were significantly different in univariate difference analysis. For analysis of CSS, 1-year CSS and 5-year CSS, all AL were the first primary malignancy. Hazard ratios (HRs) served as effect sizes with 95% confidence intervals (CIs). Kaplan-Meier survival curves were plotted and compared using the log-rank test. Based on histological type and first primary malignancy, children and adolescents with AL were stratified for analysis, and the mortality rate from 2000 to 2016 was calculated. All statistical tests were 2-sided, and P < 0.05 denoted statistical significance. SAS 9.4 (SAS Institute, Cary, NC, U.S.A.) was utilized for statistical analysis.
Results
Patient characteristics
A total of 61,694 patients with AL were identified in the SEER database from 1975 to 2016, with 45,411 (73.6%) adults and 16,283 (26.4%) children and adolescents. The flow chart of participant selection is shown in . The median age of these eligible patients was 52 years; 34,099 (55.27%) patients were males, 50,319 (81.56) were whites, 53,145 (86.14%) had the first primary malignancy. Besides, 20,990 (34.02) patients had ALL, 39,150 (63.46%) had AML. The majority of patients received chemotherapy (85.72%) and surgery (77.66%); 99.84% did not undergo radiotherapy. The median survival time was 18.00 (Q1, Q3: 7.00, 93.00) months. presents the characteristics of the included AL patients. In the comparisons between pediatric and adult patients, significant differences were found in age, sex, race, insurance, histological type, first primary malignancy, chemotherapy, and surgery (all P < 0.001). The OS of pediatric patients were significantly higher than that of adult patients (72.32% vs 15.49%, P < 0.001).
Table 1. Characteristics of the included AL patients.
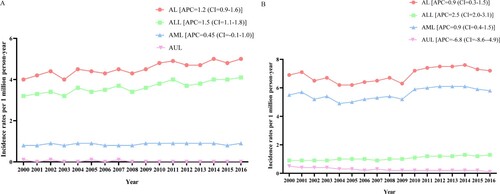
Incidence rates of AL in children and adolescents and adults stratified by histological type
According to (A), from 2000 to 2016, the incidence rate of AL in children and adolescents was significantly on the rise as a whole (APC = 1.2, 95%CI = 0.9 to 1.6, P < 0.05). The incidence rate of ALL (APC = 1.5, 95%CI = 1.1 to 1.8, P < 0.05) was significantly increased, AML (APC = 0.45, 95%CI = 0.1 to 1.0, P = 0.1) had a stable incidence, and the incidence rate of ALL was greater than that of AML and AUL in children and adolescents. As regards adults, AL (APC = 0.9, 95%CI = 0.3 to 1.5, P < 0.05), ALL (APC = 2.5, 95%CI = 2.0 to 3.1, P < 0.05) and AML (APC = 0.9, 95%CI = 0.4 to 1.5, P < 0.05) had significantly elevated incidence rates, while AUL (APC = −6.8, 95%CI = −8.6 to −4.9, P < 0.05) had a significantly declined incidence rate from 2000 to 2016, and the incidence rate of AML was greater than that of ALL and AUL ((B)).
Figure 2. Incidence rate of AL, ALL, AML and AUL in children and adolescents and adults. (A) incidence in children and adolescents; (B) incidence in adults. AL, acute leukemia; ALL, acute lymphoblastic leukemia; AML, acute myeloid leukemia; AUL, acute undifferentiated leukemia; APC, annual percent changes.
OS of children and adolescents and adults with AL
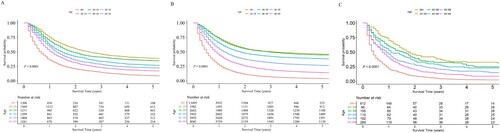
shows that OS in children and adolescents with AL was significantly higher than that in adults with AL (log-rank P < 0.0001). Children and adolescents with ALL, AML and AUL aged 0–9 years had significantly better OS than those aged 10–19 years (all log-rank P < 0.05) ((A,B)). OS in adults with ALL, AML and AUL decreased with age (all log-rank P < 0.0001) ((A,B)).
Figure 3. OS of children and adolescents and adults with AL. OS, overall survival; AL, acute leukemia.
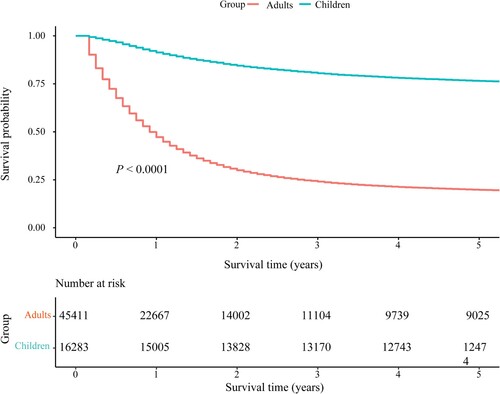
Figure 4. OS of children and adolescents. (A) OS of children and adolescents with ALL at different ages; (B) OS of children and adolescents with AML at different ages; (C) OS of children and adolescents with AUL at different ages. OS, overall survival; ALL, acute lymphoblastic leukemia; AML, acute myeloid leukemia; AUL, acute undifferentiated leukemia.
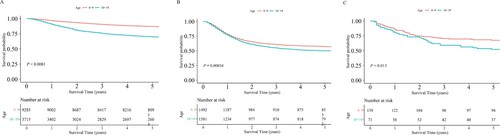
Figure 5. OS of adults. (A) OS of adults with ALL at different ages; (B) OS of adults with AML at different ages; (C) OS of adults with AUL at different ages. OS, overall survival; ALL, acute lymphoblastic leukemia; AML, acute myeloid leukemia; AUL, acute undifferentiated leukemia.
Prognostic factors for OS in children and adolescents with ALL
For children and adolescents with ALL, age of 10–19 years was associated with significantly lower OS (HR = 2.456, 95%CI = 2.281–2.645, P < 0.001), 1-year OS (HR = 2.708, 95%CI = 2.323–3.158, P < 0.001) and 5-year OS (HR = 2.614, 95%CI = 2.406–2.839, P < 0.001) than age of 0–9 years. Boys had significantly worse OS (HR = 1.210, 95%CI = 1.123–1.305, P < 0.001) and 5-year OS (HR = 1.197, 95%CI = 1.100–1.303, P < 0.001) than girls. OS (HR = 1.416, 95%CI = 1.262–1.589, P < 0.001), 1-year OS (HR = 1.493, 95%CI = 1.192–1.870, P < 0.001) and 5-year OS (HR = 1.440, 95%CI = 1.268–1.635, P < 0.001) were significantly decreased in blacks versus whites. Children and adolescents insured had significantly higher OS (HR = 0.493, 95%CI = 0.337–0.720, P < 0.001) and 5-year OS (HR = 0.547, 95%CI = 0.363–0.822, P = 0.004) than those uninsured. ALL as the first primary malignancy was correlated with significantly better OS (HR = 0.488, 95%CI = 0.313–0.760, P = 0.001), 1-year OS (HR = 0.273, 95%CI = 0.148–0.502, P < 0.001) and 5-year OS (HR = 0.468, 95%CI = 0.293–0.747, P = 0.001). Children and adolescents receiving chemotherapy had significantly greater 1-year OS (HR = 0.471, 95%CI = 0.311–0.713, P < 0.001) than those not receiving chemotherapy or with unknown chemotherapy status. Surgical treatment was linked to significantly elevated OS (HR = 0.489, 95%CI = 0.358–0.669, P < 0.001), 1-year OS (HR = 0.341, 95%CI = 0.223–0.522, P < 0.001) and 5-year OS (HR = 0.484, 95%CI = 0.353–0.663, P < 0.001) in contrast to non-surgical treatment ().
Table 2. Prognostic factors for OS in children and adolescents with ALL.
Prognostic factors for OS in children and adolescents with AML
Among children and adolescents with AML, age of 10–19 years was associated with significantly lower OS (HR = 1.167, 95%CI = 1.054–1.293, P = 0.003) and 5-year OS (HR = 1.175, 95%CI = 1.057–1.306, P = 0.003) than age of 0–9 years. Black race had significantly decreased OS (HR = 1.283, 95%CI = 1.115–1.476, P < 0.001), 1-year OS (HR = 1.234, 95%CI = 1.009–1.510, P = 0.041) and 5-year OS (HR = 1.255, 95%CI = 1.086–1.451, P = 0.002) than white race. AML as the first primary malignancy was correlated with significantly better OS (HR = 0.384, 95%CI = 0.313–0.470, P < 0.001), 1-year OS (HR = 0.287, 95%CI = 0.224–0.367, P < 0.001) and 5-year OS (HR = 0.383, 95%CI = 0.311–0.471, P < 0.001). The 1-year OS of patients with chemotherapy treatment was significantly better than that of those without chemotherapy or with unknown chemotherapy status (HR = 0.684, 95%CI = 0.489–0.957, P = 0.027) ().
Table 3. Prognostic factors for OS in children and adolescents with AML.
Prognostic factors for OS in children and adolescents with AUL
Regarding children and adolescents with AUL, age of 10–19 years was associated with significantly worse OS (HR = 1.660, 95%CI = 1.086–2.538, P = 0.019) than age of 0–9 years ().
Table 4. Prognostic factors for OS in children and adolescents with AUL.
Prognostic factors for OS in adults with ALL
As to adults with ALL, those aged ≥30 years had significantly worse OS, 1-year OS and 5-year OS than those aged 20–29 years (all P < 0.05). OS (HR = 1.094, 95%CI = 1.041–1.150, P < 0.001) and 5-year OS (HR = 1.091, 95%CI = 1.036–1.149, P < 0.001) were significantly reduced in males versus females. OS (HR = 1.339, 95%CI = 1.232–1.455, P < 0.001), 1-year OS (HR = 1.374, 95%CI = 1.229–1.537, P < 0.001) and 5-year OS (HR = 1.351, 95%CI = 1.240–1.472, P < 0.001) in blacks were significantly lower than those in whites. Adults insured exhibited significantly better OS (HR = 0.731, 95%CI = 0.617–0.866, P < 0.001), 1-year OS (HR = 0.752, 95%CI = 0.597–0.947, P = 0.016) and 5-year OS (HR = 0.742, 95%CI = 0.625–0.881, P < 0.001) than those uninsured. ALL as the first primary malignancy was related to significantly better OS (HR = 0.851, 95%CI = 0.787–0.919, P < 0.001), 1-year OS (HR = 0.840, 95%CI = 0.760–0.929, P < 0.001) and 5-year OS (HR = 0.837, 95%CI = 0.773–0.906, P < 0.001). Adults with chemotherapy had significantly reduced OS (HR = 1.205, 95%CI = 1.100–1.319, P < 0.001) and 5-year OS (HR = 1.272, 95%CI = 1.155–1.401, P < 0.001) than those without chemotherapy or with unknown chemotherapy status. Surgical treatment was associated with a significant increase in OS (HR = 0.817, 95%CI = 0.712–0.939, P = 0.004), 1-year OS (HR = 0.771, 95%CI = 0.645–0.920, P = 0.004) and 5-year OS (HR = 0.812, 95%CI = 0.706–0.933, P = 0.003) relative to non-surgical treatment ().
Table 5. Prognostic factors for OS in adults with ALL.
Prognostic factors for OS in adults with AML
For adults with AML, those aged ≥30 years showed significantly worse OS, 1-year OS and 5-year OS than those aged 20–29 years (all P < 0.05). Male sex was associated with significantly lower OS (HR = 1.072, 95%CI = 1.048–1.096, P < 0.001), 1-year OS (HR = 1.031, 95%CI = 1.003–1.061, P = 0.031) and 5-year OS (HR = 1.062, 95%CI = 1.038–1.087, P < 0.001), compared with female sex. OS (HR = 1.116, 95%CI = 1.074–1.160, P < 0.001), 1-year OS (HR = 1.091, 95%CI = 1.039–1.145, P < 0.001) and 5-year OS (HR = 1.117, 95%CI = 1.073–1.162, P < 0.001) were significantly lower in blacks versus whites. Patients with any Medicaid had significantly decreased OS (HR = 1.152, 95%CI = 1.020–1.301, P = 0.023) and 5-year OS (HR = 1.144, 95%CI = 1.011–1.293, P = 0.032) than those uninsured. AML as the first primary malignancy was correlated with significantly better OS (HR = 0.843, 95%CI = 0.820–0.867, P < 0.001), 1-year OS (HR = 0.836, 95%CI = 0.809–0.864, P < 0.001) and 5-year OS (HR = 0.841, 95%CI = 0.818–0.866, P < 0.001). Adults with chemotherapy had significantly higher OS (HR = 0.727, 95%CI = 0.707–0.749, P < 0.001), 1-year OS (HR = 0.652, 95%CI = 0.631–0.675, P < 0.001) and 5-year OS (HR = 0.726, 95%CI = 0.705–0.748, P < 0.001) than those without chemotherapy or with unknown chemotherapy status ().
Table 6. Prognostic factors for OS in adults with AML.
Prognostic factors for OS in adults with AUL
Concerning adults with AUL, those aged ≥40 years had significantly reduced OS, 1-year OS and 5-year OS than those aged 20–29 years; age of 30–39 years was also associated with significantly worse OS than age of 20–29 years (all P < 0.05). Adults with chemotherapy had significantly better 1-year OS (HR = 0.804, 95%CI = 0.694–0.932, P = 0.004) than those without chemotherapy or with unknown chemotherapy status ().
Table 7. Prognostic factors for OS in adults with AUL.
Prognostic factors for CSS in children and adolescents with ALL
For children and adolescents with ALL, age of 10–19 years was associated with significantly lower CSS (HR = 2.478, 95%CI = 2.286–2.686, P < 0.001), 1-year CSS (HR = 2.283, 95%CI = 2.123–2.457, P < 0.001) and 5-year CSS (HR = 2.484, 95%CI = 2.293–2.691, P < 0.001) than age of 0–9 years. Males had significantly worse CSS (HR = 1.186, 95%CI = 1.093–1.288, P < 0.001), 1-year CSS (HR = 1.164, 95%CI = 1.079–1.255, P < 0.001) and 5-year CSS (HR = 1.186, 95%CI = 1.093–1.287, P < 0.001) than females. CSS (HR = 1.412, 95%CI = 1.242–1.605, P < 0.001), 1-year CSS (HR = 1.362, 95%CI = 1.216–1.525, P < 0.001) and 5-year CSS (HR = 1.415, 95%CI = 1.246–1.607, P < 0.001) were significantly decreased in blacks versus whites. Patients insured had significantly higher CSS (HR = 0.507, 95%CI = 0.347–0.742, P < 0.001), 1-year CSS (HR = 0.555, 95%CI = 0.398–0.775, P < 0.001) and 5-year CSS (HR = 0.508, 95%CI = 0.345–0.747, P < 0.001) than those uninsured. Surgery was associated with significantly better CSS (HR = 0.518, 95%CI = 0.364–0.735, P < 0.001), 1-year CSS (HR = 0.554, 95%CI = 0.407–0.753, P < 0.001) and 5-year CSS (HR = 0.527, 95%CI = 0.369–0.751, P < 0.001) than the absence of surgery ().
Table 8. Prognostic factors for CSS in children and adolescents with ALL.
Prognostic factors for CSS in children and adolescents with AML
Among children and adolescents with AML, age of 10–19 years was associated with significantly worse CSS (HR = 1.170, 95%CI = 1.046–1.309, P = 0.006), 1-year CSS (HR = 1.146, 95%CI = 1.035–1.268, P = 0.009) and 5-year CSS (HR = 1.172, 95%CI = 1.048–1.311, P = 0.005) than age of 0–9 years. Black patients exhibited significantly declined CSS (HR = 1.210, 95%CI = 1.033–1.418, P = 0.018), 1-year CSS (HR = 1.178, 95%CI = 1.023–1.357, P = 0.023) and 5-year CSS (HR = 1.212, 95%CI = 1.035–1.419, P = 0.017) in contrast to white patients ().
Table 9. Prognostic factors for CSS in children and adolescents with AML.
Prognostic factors for CSS in children and adolescents with AUL
Children and adolescents with AUL aged 10–19 years had significantly decreased CSS (HR = 1.170, 95%CI = 1.046–1.309, P = 0.006), 1-year CSS (HR = 1.146, 95%CI = 1.035–1.268, P = 0.009) and 5-year CSS (HR = 1.172, 95%CI = 1.048–1.311, P = 0.005) than those aged 0–9 years ().
Table 10. Prognostic factors for CSS in children and adolescents with AUL.
Prognostic factors for CSS in adults with ALL
As regards adults with ALL, those aged ≥30 years had significantly worse CSS, 1-year CSS and 5-year CSS than those aged 20–29 years (all P < 0.05). CSS (HR = 1.241, 95%CI = 1.123–1.372, P < 0.001), 1-year CSS (HR = 1.222, 95%CI = 1.124–1.329, P < 0.001) and 5-year CSS (HR = 1.255, 95%CI = 1.137–1.386, P < 0.001) in blacks were significantly lower than those in whites. Adults insured exhibited significantly better CSS (HR = 0.744, 95%CI = 0.621–0.892, P = 0.001), 1-year CSS (HR = 0.779, 95%CI = 0.670–0.906, P = 0.001) and 5-year CSS (HR = 0.738, 95%CI = 0.616–0.884, P < 0.001) than those uninsured. Chemotherapy was associated with significantly lower CSS (HR = 1.439, 95%CI = 1.256–1.648, P < 0.001), 1-year CSS (HR = 1.236, 95%CI = 1.097–1.394, P < 0.001) and 5-year CSS (HR = 1.442, 95%CI = 1.260–1.650, P < 0.001) than non-chemotherapy or unknown chemotherapy status ().
Table 11. Prognostic factors for CSS in adults with ALL.
Prognostic factors for CSS in adults with AML
In adults with AML, age ≥40 years was associated with significantly reduced CSS, 1-year CSS and 5-year CSS than those aged 20–29 years (all P < 0.05). Males exhibited worse CSS (HR = 1.043, 95%CI = 1.014–1.073, P = 0.003), 1-year CSS (HR = 1.036, 95%CI = 1.010–1.062, P = 0.006) and 5-year CSS (HR = 1.046, 95%CI = 1.017–1.076, P = 0.002) compared with females. CSS (HR = 1.086, 95%CI = 1.035–1.141, P < 0.001), 1-year CSS (HR = 1.083, 95%CI = 1.038–1.131, P < 0.001) and 5-year CSS (HR = 1.091, 95%CI = 1.040–1.146, P < 0.001) in blacks were significantly lower than those in whites. Adults insured exhibited significantly better CSS (HR = 0.828, 95%CI = 0.726–0.944, P = 0.005), 1-year CSS (HR = 0.858, 95%CI = 0.763–0.966, P = 0.011) and 5-year CSS (HR = 0.832, 95%CI = 0.729–0.950, P = 0.007) than those uninsured. The CSS (HR = 0.900, 95%CI = 0.864–0.937, P < 0.001), 1-year CSS (HR = 0.839, 95%CI = 0.809–0.870, P < 0.001) and 5-year CSS (HR = 0.893, 95%CI = 0.858–0.930, P < 0.001) of patients with chemotherapy treatment were significantly better than those of patients without chemotherapy or with unknown chemotherapy status ().
Table 12. Prognostic factors for CSS in adults with AML.
Prognostic factors for CSS in adults with AUL
With respect to adults with AUL, age ≥50 years was associated with significantly worse CSS, 1-year CSS and 5-year CSS than those aged 20–29 years; age of 40–49 years was also associated with significantly reduced OS than age of 20–29 years (all P < 0.05) ().
Table 13. Prognostic factors for CSS in adults with AUL.
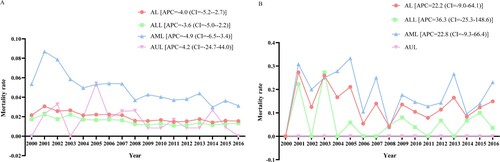
Mortality rate of children and adolescents with AL stratified by histological type and first primary malignancy
From 2000 to 2016, for children and adolescents with AL as the first primary malignancy, the mortality rate of AL (APC = −4.0, 95%CI = −5.2 to −2.7), ALL (APC = −3.6, 95%CI = −5.0 to −2.2) and AML (APC = −4.9, 95%CI = −6.5 to −3.4) patients was decreasing, while the mortality rate of AUL patients (APC = 4.2, 95%CI = −24.7 to 44.0) was increasing as a whole ((A)). For children and adolescents whose AL was not the first primary malignancy, overall, the mortality rate of AL (APC = 22.2, 95%CI = −9.0 to 64.1), ALL (APC = 36.3, 95%CI = −25.3 to 148.6) and AML (APC = 22.8, 95%CI = −9.3 to 66.4) patients was on the rise ((B)).
Figure 6. Mortality rate of children and adolescents with AL, ALL, AML and AUL. (A) Mortality when AL was the first primary malignancy; (B) mortality when AL was not the first primary malignancy. AL, acute leukemia; ALL, acute lymphoblastic leukemia; AML, acute myeloid leukemia; AUL, acute undifferentiated leukemia; APC, annual percent changes.
Discussion
This study provided the updated epidemiological characteristics and influencing factors of AL in children and adolescents, and make comparisons between pediatric and adult patients, utilizing the SEER database. A total of 61,694 patients with AL were identified from the SEER database (1975–2016), with 73.6% adults and 26.4% children and adolescents. From 2000 to 2016, the incidence rates of AL and ALL in children and adolescents and adults were increasing; the incidence rate of AML remained stable in children and adolescents, and was on the rise in adults; the incidence rate of AUL was decreasing in adults on the whole. Children and adolescents with AL had significantly better OS than adults with AL. OS declined with age in both children and adolescents and adults with ALL, AML or AUL. In general, older age, male sex and black race were risk factors for the survival of children and adolescents and adults with ALL, AML and AUL, while insurance (insured or any Medicaid), first primary malignancy, chemotherapy and surgery were protective factors.
According to our findings, from 2000 to 2016, the incidence rates of AL for both pediatric and adult patients presented a rising trend, ranging from 4 to 5 and from 6.2 to 7.6 per 1 million person-years, respectively. The incidence rates of ALL in children and adolescents and adults increased from 3.2 to 4.1 and from 0.9 to 1.3 per 1 million person-years, respectively. A stable incidence rate of approximately 0.8 per 1 million person-years was shown for AML among children and adolescents. The incidence rate of AML in adults ranged from 4.9 to 6.1 per 1 million person-years, showing an upward trend. The increased incidence of AML arises not only from population aging and growth, but also because of inherent features of the disease [Citation19]. Proper management and epidemiological profiling require current data on the distribution and risk factors of AL and its subtypes. The incidence of AUL in adults decreased from 0.5 to 0.1 per 1 million person-years. Qasrawi et al. [Citation20] also reported a decline in the incidence rate of AUL over time. In a survey of AL cases registered by SEER between 2001 and 2007, only 825/29,672 were undifferentiated (2.7%). This resulted in an incidence ratio of 1.6 cases per 1 million person years [Citation21]. The reasons for the decreasing incidence of AUL are probably not a different etiology or pathogenesis but the more sensitive diagnostic tools assigning patients either to the myeloid or lymphoid lineage. As regards OS, children and adolescents had significantly greater OS than adults in AL (76.61% vs. 19.87%). In this study, 71.4% adult patients were over 50 years old. We hypothesize that OS in children and adolescents with AL was better than that in adults with AL may be due to the fact that as the elderly gradually increase in age, various functions of the body gradually decline, the physical state is poor, and the decline in tissue regeneration potential is obvious. One of the characteristics is that the hematopoietic function of elderly patients gradually declines due to the increase of age, and hematopoietic stem cells gradually lose their ability to regenerate, resulting in blood aging, including immunosenescence, anemia, etc., which increases the risk of autoimmunity and hematological malignancies. Further, it was found herein that OS in children and adolescents with ALL, AML and AUL decreased with age. Adults are the same. These findings may add to the current knowledge about OS in ALL, AML and AUL. More attention should be paid to the incidence and survival of both children and adolescents and adults with AL, and the progression of different subtypes of AL in different age groups should be monitored closely, thus achieving better disease management. As for AL subtypes, future studies can also focus on AL classification by immunophenotype and the molecular diagnosis of AL to further see the differences between children and adolescents and adults.
Older age, male sex and black race were identified as risk factors for survival among children and adolescents and adults with ALL, AML and AUL, while insurance, first primary malignancy, chemotherapy and surgery acted as protective factors. In a prior review of Advani et al. [Citation22], age remained an independent factor for prognosis among AL patients, and was a continuous variable with poorer outcomes in each successive decade for adults with AML. Age was also demonstrated to be the single most important prognostic factor in both AML and ALL [Citation23]. Kato et al. [Citation24] recognized that increasing age was associated with worse survival in pediatric ALL patients. A factor predicting a good prognosis after salvage treatment was shown to be young age in adult ALL patients [Citation25]. Factors associated with more aggressive disease biology tend to increase in frequency with increasing age, whilst tolerability of treatment strategies decreases [Citation26]. Besides, men with AML had a higher risk of death compared with women [Citation27]. African American men exhibited lower OS than whites and African American women [Citation28]. According to an analysis from the SEER database, survival in most major subtypes of leukemia (ALL, AML, chronic lymphoblastic leukemia, chronic myeloid leukemia) varied in different races, and blacks had the significantly worst five-year survival [Citation29]. Non-Hispanic whites had elevated OS compared with non-Hispanic blacks in intermediate-risk AML (31.6 months vs. 16.7 months) [Citation30]. Eche et al. [Citation31] reported worse survival in black children with ALL versus white children. Blacks may be more likely to have high-risk disease features that result in inferior survival. Moreover, survival among patients with insurance (insured or any Medicaid), AL as the first primary malignancy, chemotherapy and surgery was superior to that among those without. According to the SEER, insured status included both public and private insurance, and any Medicaid belonged to public insurance (https://seer.cancer.gov/seerstat/variables/seer/insurance-recode/), and it was unknown how those who were not insured pay for services, which needs future studies for investigation. Insured patients younger than 65 years with APL had improved survival than uninsured patients [Citation32]. Pulte et al. showed that patients without insurance or with Medicaid had lower survival expectations after AML diagnosis than patients with other insurance [Citation33]. Insured status was also reported to be associated with better OS in ALL across all age groups [Citation34]. Lack of insurance can be a barrier to timely, effective maintenance treatment. When patients with AL as a non-first primary malignancy, physical condition, anti-cancer performance and tolerance to treatment may decline due to the previous cancer. Corresponding treatment for AL could be proposed for patients with different risks stratified by these prognostic factors, so as to bring survival benefits.
Some limitations should be considered when interpreting our findings. First, specific information on chemotherapy is unavailable in the SEER database, such as the type, dose, and duration of chemotherapy drugs, which may have an impact on survival. Chemotherapy information was collected from the medical records examined, which had validity. Whether a patient received chemotherapy was determined based on the chemotherapy code: 0 indicated that the patient did not receive chemotherapy or whether the patient received chemotherapy was unknown; 1 indicated that the patient received chemotherapy. This was all the information about chemotherapy we could obtain from the SEER, and information on those who did not receive chemotherapy was not available. The same goes for surgery and other treatments. Second, patient follow-up may end if the patient moves to another region of the United States where SEER data are not collected. Besides, there were missing values which were treated as unknown. Data on transplant rate were not available in this database. Future investigations should improve the reporting of data on transplant rate for further research. Third, this study focused on the American population, with limited generalizability. Finally, since the SEER database has been updated, we cannot match and obtain the information on race and the type of another primary malignancy in this study population, and the Hispanic race and another primary malignancy cannot be described independently in this analysis.
Conclusion
From 2000 to 2016, the incidence rates of AL in children and adolescents and adults were on a rise. Children and adolescents with AL had significantly better OS than adults with AL, and OS decreased with age in both children and adolescents and adults with ALL, AML and AUL. Older age, male sex and black race were risk factors for the survival of children and adolescents and adults with ALL, AML and AUL, while insurance, first primary malignancy, chemotherapy and surgery were protective factors. Further prospective, well-designed studies are warranted to corroborate our findings.
Revised Supplementary File 1.docx
Download MS Word (143.2 KB)Disclosure statement
No potential conflict of interest was reported by the author(s).
Additional information
Funding
References
- Alsalem MA, Zaidan AA, Zaidan BB, et al. A review of the automated detection and classification of acute leukaemia: coherent taxonomy, datasets, validation and performance measurements, motivation, open challenges and recommendations. Comput Methods Programs Biomed. 2018;158:93–112. doi:10.1016/j.cmpb.2018.02.005
- Seth R, Singh A. Leukemias in children. Indian J Pediatr. 2015;82(9):817–824. doi:10.1007/s12098-015-1695-5
- Barr RD, Gomez-Almaguer D, Jaime-Perez JC, et al. Importance of nutrition in the treatment of leukemia in children and adolescents. Arch Med Res. 2016;47(8):585–592. doi:10.1016/j.arcmed.2016.11.013
- Stat bite: estimated new leukemia cases in 2008. J Natl Cancer Inst. 2008;100(8):531. doi:10.1093/jnci/djn111
- Pui CH, Relling MV, Downing JR. Acute lymphoblastic leukemia. N Engl J Med. 2004;350(15):1535–1548. doi:10.1056/NEJMra023001
- Hunault M, Harousseau JL, Delain M, et al. Better outcome of adult acute lymphoblastic leukemia after early genoidentical allogeneic bone marrow transplantation (BMT) than after late high-dose therapy and autologous BMT: a GOELAMS trial. Blood. 2004;104(10):3028–3037. doi:10.1182/blood-2003-10-3560
- Yang JJ, Cheng C, Devidas M, et al. Genome-wide association study identifies germline polymorphisms associated with relapse of childhood acute lymphoblastic leukemia. Blood. 2012;120(20):4197–4204. doi:10.1182/blood-2012-07-440107
- Hunger SP, Mullighan CG. Redefining ALL classification: toward detecting high-risk ALL and implementing precision medicine. Blood. 2015;125(26):3977–3987. doi:10.1182/blood-2015-02-580043
- Burkhardt B, Hermiston ML. Lymphoblastic lymphoma in children and adolescents: review of current challenges and future opportunities. Br J Haematol. 2019;185(6):1158–1170. doi:10.1111/bjh.15793
- De Kouchkovsky I, Abdul-Hay M. Acute myeloid leukemia: a comprehensive review and 2016 update. Blood Cancer J. 2016;6(7):e441. doi:10.1038/bcj.2016.50
- Newell LF, Cook RJ. Advances in acute myeloid leukemia. BMJ. 2021;375:n2026.
- Nasir SS, Giri S, Nunnery S, et al. Outcome of adolescents and young adults compared with pediatric patients with acute myeloid and promyelocytic leukemia. Clin Lymphoma Myeloma Leuk. 2017;17(2):126–132.e1. doi:10.1016/j.clml.2016.09.011
- Elgarten CW, Aplenc R. Pediatric acute myeloid leukemia: updates on biology, risk stratification, and therapy. Curr Opin Pediatr. 2020;32(1):57–66. doi:10.1097/MOP.0000000000000855
- Creutzig U, van den Heuvel-Eibrink MM, Gibson B, et al. Diagnosis and management of acute myeloid leukemia in children and adolescents: recommendations from an international expert panel. Blood. 2012;120(16):3187–3205. doi:10.1182/blood-2012-03-362608
- Zhong J, Yu X, Zhang X. Comparison of overall survival between de novo and secondary acute lymphoblastic leukemia patients of different ages. Clin Lymphoma Myeloma Leuk. 2020;20(9):e622–e627. doi:10.1016/j.clml.2020.04.013
- Kamath GR, Tremblay D, Coltoff A, et al. Comparing the epidemiology, clinical characteristics and prognostic factors of acute myeloid leukemia with and without acute promyelocytic leukemia. Carcinogenesis. 2019;40(5):651–660. doi:10.1093/carcin/bgz014
- Cronin KA, Ries LA, Edwards BK. The surveillance, epidemiology, and end results (SEER) program of the National Cancer Institute. Cancer. 2014;120(Suppl 23):3755–3757. doi:10.1002/cncr.29049
- Duggan MA, Anderson WF, Altekruse S, et al. The surveillance, epidemiology, and end results (SEER) program and pathology: toward strengthening the critical relationship. Am J Surg Pathol. 2016;40(12):e94–e102. doi:10.1097/PAS.0000000000000749
- Song X, Peng Y, Wang X, et al. Incidence, survival, and risk factors for adults with acute myeloid leukemia not otherwise specified and acute myeloid leukemia with recurrent genetic abnormalities: analysis of the surveillance, epidemiology, and end results (SEER) database, 2001–2013. Acta Haematol. 2018;139(2):115–127. doi:10.1159/000486228
- Qasrawi A, Gomes V, Chacko CA, et al. Acute undifferentiated leukemia: data on incidence and outcomes from a large population-based database. Leuk Res. 2020;89:106301. doi:10.1016/j.leukres.2020.106301
- Dores GM, Devesa SS, Curtis RE, et al. Acute leukemia incidence and patient survival among children and adults in the United States, 2001–2007. Blood. 2012;119(1):34–43. doi:10.1182/blood-2011-04-347872
- Advani AS, Hunger SP, Burnett AK. Acute leukemia in adolescents and young adults. Semin Oncol. 2009;36(3):213–226. doi:10.1053/j.seminoncol.2009.03.007
- Ganzel C, Rowe JM. Prognostic factors in adult acute leukemia. Hematol Oncol Clin North Am. 2011;25(6):1163–1187. doi:10.1016/j.hoc.2011.09.017
- Kato M, Manabe A. Treatment and biology of pediatric acute lymphoblastic leukemia. Pediatr Int Off J Jpn Pediatr Soc. 2018;60(1):4–12. doi:10.1111/ped.13457
- Fielding AK, Richards SM, Chopra R, et al. Outcome of 609 adults after relapse of acute lymphoblastic leukemia (ALL); an MRC UKALL12/ECOG 2993 study. Blood. 2007;109(3):944–950. doi:10.1182/blood-2006-05-018192
- Juliusson G, Hough R. Leukemia. Prog Tumor Res. 2016;43:87–100. doi:10.1159/000447076
- Kristinsson SY, Derolf AR, Edgren G, et al. Socioeconomic differences in patient survival are increasing for acute myeloid leukemia and multiple myeloma in Sweden. J Clin Oncol Off J Am Soc Clin Oncol. 2009;27(12):2073–2080. doi:10.1200/JCO.2008.18.2006
- Sekeres MA, Peterson B, Dodge RK, et al. Differences in prognostic factors and outcomes in African Americans and whites with acute myeloid leukemia. Blood. 2004;103(11):4036–4042. doi:10.1182/blood-2003-09-3118
- Zhao Y, Wang Y, Ma S. Racial differences in four leukemia subtypes: comprehensive descriptive epidemiology. Sci Rep. 2018;8(1):548. doi:10.1038/s41598-017-19081-4
- Abraham IE, Patel AA, Wang H, et al. Impact of race on outcomes in intermediate-risk acute myeloid leukemia. Cancer Causes Control. 2021;32(7):705–712. doi:10.1007/s10552-021-01422-4
- Eche IJ, Aronowitz T. A literature review of racial disparities in overall survival of black children with acute lymphoblastic leukemia compared with white children with acute lymphoblastic leukemia. J Pediatr Oncol Nurs Off J Assoc Pediatr Oncol Nurses. 2020;37(3):180–194. doi:10.1177/1043454220907547
- Jamy OH, Godby R, Dhir A, et al. Impact of insurance status on the survival of younger patients diagnosed with acute promyelocytic leukemia in the United States. Cancer. 2021;127(16):2966–2973. doi:10.1002/cncr.33593
- Pulte D, Castro FA, Brenner H, et al. Outcome disparities by insurance type for patients with acute myeloblastic leukemia. Leuk Res. 2017;56:75–81. doi:10.1016/j.leukres.2017.02.001
- Joshi U, Khanal S, Bhetuwal U, et al. Impact of insurance on overall survival in acute lymphoblastic leukemia: a SEER database study. Clin Lymphoma Myeloma Leuk. 2022;22(7):e477–e484. doi:10.1016/j.clml.2022.01.001