
 ?Mathematical formulae have been encoded as MathML and are displayed in this HTML version using MathJax in order to improve their display. Uncheck the box to turn MathJax off. This feature requires Javascript. Click on a formula to zoom.
ABSTRACT
Modelling customer loyalty has been a central issue in customer relationship management, particularly in digital subscription business models. To guarantee news media sustainability, publishers implemented subscription models that need to define successful retention strategies. Thus, churn management has become pivotal in the media subscription business. The present study aims to understand what drives subscribers to churn by performing a Machine Learning approach to model the propensity to churn of online subscribers of a Portuguese newspaper. Two models were developed, tested, and evaluated in two timeframes. The first one considered all Business to Consumer (B2C) subscriptions, and the second only the B2C non-recurring subscriptions. The experimental results revealed important patterns of churners, which allowed the marketing and editorial teams to implement churn prevention and retention measures.
Introduction
News media traditionally base their business models on a combination of sales and advertising revenue (Fletcher & Nielsen, Citation2017). The economic recovery from the 2008 crisis (Arrese, Citation2016) and the recent COVID-19 pandemic, coupled with a digital transformation and reader habits changes, induced publishers to re-evaluate their business models (Newman, Fletcher, Robertson, et al., Citation2022). To diminish and offset the obstacles caused by the previously mentioned difficulties, newspaper companies are focusing on digital information business models (Cardoso et al., Citation2020).
Online newspapers’ primary sources of revenue are advertising and online subscriptions, mainly in the form of paywall models (Pattabhiramaiah et al., Citation2019). Nonetheless, the first does not create a long-lasting relationship with the users and can be avoided with the use of ad blockers (advertisement blockers). Hence, the latter has been adopted by many publishers to increase revenue through subscription business models (Newman et al., Citation2019).
Recent studies present new paywall mechanisms based on data science algorithms to define the optimal paywall time to increase the propensity to subscribe (Chakraborty et al., Citation2017; Davoudi, Citation2018) and to recommend engaging content to increase reader loyalty and subscription propensity (Abdollahpouri et al., Citation2021). Thus, publishers focus on subscriber acquisition and retention (Rußell et al., Citation2020).
Furthermore, reader retention, personalisation, and paywall models are some of the major points of concern in the industry (Rußell et al., Citation2020; Suárez, Citation2019). Moreover, improving churn is becoming more important than acquisition. A slight improvement in decreasing churn significantly impacts company results (Suárez, Citation2019). As the research on engagement drivers to retain or churn online reader subscribers is quite scarce (Fernandes et al., Citation2023), this research presents a valuable contribution to the media industry with a strategy to retain online subscribers by increasing reader loyalty and decreasing churn propensity.
As Kotler et al. (Citation2019) argued, publishers should map the reader path across the reader funnel to improve critical touchpoints, such as cancelation moments. Furthermore, each second of time results in dozens of readers interacting with the website, which provides large volumes of data. Moreover, the opportunity to acquire more knowledge from the readers to implement successful acquisition and retention measures showed publishers that their extant database is their most valuable asset (Coussement & Van den Poel, Citation2009). The Big Data landscape makes the process of Data Mining (DM) part of an overall strategy to improve business intelligence, Customer Relationship Management (CRM), and Churn Management (Gunnarsson et al., Citation2007).
Between 2019 and 2020, there was a generalised increase in people paying for online news (Newman et al., Citation2021). However, in Portugal, 10% of the population affirmed paying for online news, most of them with an ongoing subscription (Cardoso et al., Citation2020). Portugal is still characterised by a strongly traditional press industry, where revenue depends highly on print (Newman, Fletcher, Schulz, et al., Citation2022). Even though digital media subscribers are increasing, the figures are small, threatening this trusted Portuguese news ecosystem. In addition, a wide variety of accessible options for readers poses a challenge to the newspaper business on digital platforms (Cardoso et al., Citation2020).
In this exploratory research, we used data from PÚBLICO online users. PÚBLICO is one of the Portuguese newspapers with the highest national reach, a trusted brand with well-defined journalistic values, and a digital subscription leader (Newman et al., Citation2020). This study has two main goals. First, identifying readers with the likelihood of churn, and second, understanding the main drivers of loyalty, retention, and churn is pivotal for publishers (Fernandes et al., Citation2024; Rußell et al., Citation2020). The objective is that the subscription marketing team can act in time to retain those subscribers with a high propensity to churn. With this understanding into consideration, this study aims to answer the following research questions (RQs):
Can a Machine Learning (ML) model identify subscribers most likely to churn?
What factors impact subscription renewal?
What are the patterns of churn subscribers?
Can retention strategies reduce the churn rate?
By answering these RQs, this study aims to contribute to the literature on publishers’ churn management and to guide publishers ’ subscription marketing teams on how to act in time to retain subscribers.
Theoretical background
Customer churn
In today’s digital subscription business models (DSBMs), to guarantee sustainability, companies highly value having a customer-oriented business strategy (Uner et al., Citation2020). One of the main challenges in this strategy is churn management, a very well-studied topic in literature. Research considerers that there are two types of churn: incidental and deliberate (Jayaswal et al., Citation2016). Incidental churn occurs when customers are forced to end their subscriptions for underlying reasons (e.g. faulty payments). In contrast, the process of a customer voluntarily deciding to cancel their subscription falls under the deliberate churn definition. The present research focuses on deliberate churn, a vital topic in online newspapers with subscription models (Rußell et al., Citation2020).
It is argued that reader retention is related to the frequency with which a user reads (Davoudi, Citation2018). Reader engagement is considered a multidimensional phenomenon related to the level of attention and involvement (emotional, cognitive, and behavioural) with media (Attfield et al., Citation2011; Fernandes et al., Citation2024). Several researchers have studied the relationship between user engagement and purchase intention in DSBMs. However, research on the relationship between engagement and cancelation is scarce in the media industry. Using a predictive model to detect customers’ likelihood of terminating their relationship with a company has proven to be very important. Thus, media companies invest in churn management for numerous reasons, namely:
Take advantage of the information they already have about long-term customers. With that information, they can understand their needs, preferences, and consumption characteristics. By increasing cross-sell and up-sell actions, customers become more profitable. Furthermore, a satisfied customer provides positive referrals that consequently bring new customers (Ganesh et al., Citation2000).
A small change in the churn rate can significantly increase profitability (Coussement & Van den Poel, Citation2009).
Conversely, unsatisfied customers can spread the word in diverse channels, inducing other customers to churn (Nitzan & Libai, Citation2011) and decreasing brand value.
Moreover, profit is compromised to attract new customers as the pressure for acquisition induces a price reduction and acquisition costs increase (De Caigny et al., Citation2018). Acquiring a new customer is several times more expensive than retaining existing ones (Kotler et al., Citation2016).
Churn prediction in subscription business models
Studies on customer churn prediction in the media sector have been developed by some authors (Burez & Van den Poel, Citation2007; Yuan et al., Citation2017). The digital database Scopus, the largest abstract and citation database of peer-reviewed literature (Ballew, Citation2009), only returns 39 documents (as of December 2023) that included the terms “churn” and “publisher”/”newspaper”:
TITLE-ABS-KEY (churn AND (publisher OR newspaper)) AND PUBYEAR > 1999 AND PUBYEAR < 2024
In these 39 documents, some interesting churn analyses across industries can be found (Ahn et al., Citation2020; C.-F. Tsai & Lu, Citation2010). There are examples from the online game industry (Xiong et al., Citation2023) and media industry (Coussement & Van den Poel, Citation2008), as well as a study that analyses online readers churn by device (Peña et al., Citation2023). Other studies on the matter have been developed in telecommunication (Coussement et al., Citation2017; Keramati et al., Citation2014; Verbeke et al., Citation2012), banking (Farquad et al., Citation2014), gambling (Coussement & De Bock, Citation2013), and many other industries (e.g. De Caigny et al., Citation2018). However, literature on the application of ML in the media industry for churn modelling is quite scarce. summarises the most prominent studies on churn modelling in subscription models. Traditional approaches such as Logistic Regression and Support Vector Machines have been employed to identify key predictors in subscription churn (De Caigny et al., Citation2018). However, the complexity and non-linearity of subscription data need more sophisticated models. Recent studies advocate for the adoption of advanced ensemble learning techniques like XGBoost (Chen & Guestrin, Citation2016) or LightGBM (Ke et al., Citation2017) due to their superior performance in handling large-scale, high-dimensional datasets with improved accuracy and efficiency.
Table 1. Literature review on churn modelling in subscriptions business models.
Across the media industry, some churn management strategies and insights have been published (Suárez, Citation2019). Dagens Nyheter, a Swedish newspaper, has created a research engine that pinpoints over 200 features that explain churn (Southern, Citation2019). They identify the lack of frequent visits as the most common churn driver. In addition, direct debit payment methods and subscribers’ seniority are drivers of low churn, while monthly invoice reminders are drivers of high churn (SparkBeyond Team, Citation2021). On the other hand, The Economist favours the time on the website as the single biggest predictor of retention (Suárez, Citation2019). Other good indicators for churn are the number of premium articles read, consumption across devices, the channel used when a user converted, and whether a user hit the paywall or subscribed to a premium article (Campbell, Citation2018). In addition, the platform used to consume news has been shown to impact the subscribers’ willingness to renew their subscriptions, especially on mobile websites, underscoring the need to improve users’ experience across platforms (Peña et al., Citation2023).
Although metrics that support publishers in identifying probable churners may vary, subscribers’ engagement metrics (Davoudi et al., Citation2019) are the most used. Furthermore, most newspapers agree that building product usage habits helps sustain a longer relationship with customers and, consequently, reduces churn propensity (Davoudi, Citation2018).
Methodology
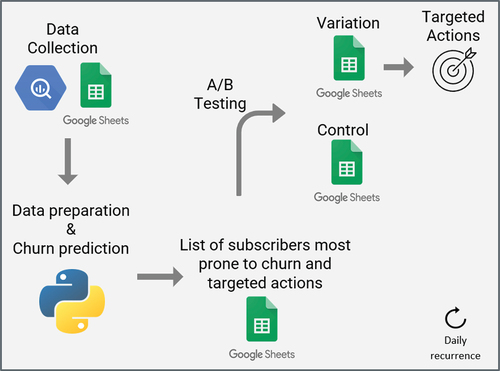
This study followed the well-known process model Cross Industry Standard Process for Data Mining (CRISP-DM) (Chapman et al., Citation2000). We combined business validation similarly to the Business Success Criteria of the CRISP-ML(Q) (Hanzelik et al., Citation2022). Thus, this section follows six phases, describing the going back and forward between the phases in multiple iterations until the result is reached. A diagram of the sequence of the phases is detailed in .
Figure 1. Research framework.
Like in many online subscription models, PÚBLICO has two types of subscriptions: recurring (automatically renewed) and non-recurring (non-automatically renewed). Non-recurring subscriptions are made with one-off payment transactions (e.g. bank transfers) and are associated with higher churn rates. Since churn rates differ in the two types, two models were built to conduct two experiments. Model 1 predicts churn for recurring and non-recurring subscriptions, and Model 2 predicts churn only for non-recurring subscriptions (see ). The models were sequentially evaluated, with daily predictions being subject to A/B tests. One group was contacted with retention actions (variation group), and no action was applied to the control group. Both experiments underwent a similar preprocessing phase: data was cleaned, transformed, and filtered. The modelling and respective evaluation phases followed the same framework for each model (see diagram in ). The analysis was done using the Python programming language and relying mainly on the following Python packages: pandas (McKinney, Citation2010), Scikit-learn (Pedregosa et al., Citation2011), XGBoost (Chen & Guestrin, Citation2016), and LightGBM (Ke et al., Citation2017). XGBoost and LightGBM are scalable gradient-boosting machine learning algorithms that achieve state-of-the-art results by optimally combining decision trees, utilising advanced regularisation techniques, and employing efficient computation strategies.
Business and data understanding
PÚBLICO’s online subscription retention problem was tackled through churn prediction, formalising it as a supervised ML research for binary classification. The target variable was defined as a churner (1) if a customer did not renew the subscription 30 days after the renewal date; otherwise, the customer was classified as a non-churner (0). Two sets of B2C subscribers were studied (Sample 1 and Sample 2; see description in ). Each dataset contains 44 features: customers’ website usage and newsletters consumption, subscription product specifications, user-related variables, and historical information focused on users’ affiliation with the company. Sample 1 contained 47,449 subscriptions, and sample 2 had 18,461 subscriptions, respectively, with a churn rate of 9.6% and 22.9%. Non-recurring payments are one-off transactions and lead to a higher churn rate. Thus, performing a second model gave more focus to those subscribers.
The datasets covered, respectively, a period of subscription renewal dates from NaN Invalid Date NaN, to NaN Invalid Date NaN, and from NaN Invalid Date NaN, to NaN Invalid Date NaN. Data were collected 30 days after the subscription ended, along with a subscription status identifier (target value). Five groups of variables were collected (see ).
Table 2. Features meaning, and periods covered.
Data preparation
Data preparation and preprocessing are critical phases in the DM process, as they are when representational data and its quality are addressed (Antonio et al., Citation2018). Finding patterns while training the algorithms is more complex and challenging when irrelevant, redundant, unreliable, or noisy data are present (Pyle, Citation1999). In this study, data cleaning comprises four tasks (see ):
Process missing values and outliers. The website’s usability variables with missing values were considered as having no interaction. Only subscribers with ages between 18 and 100 were considered, and missing values in the users’ age were replaced with the average subscribers’ age.
Duplicate data can bias the model to predict those entries better. Hence, its removal was done by keeping the most accurate unique entries.
Outlier elimination ensures that only representative data is introduced to the model. Therefore, subscriptions with less than 20 days were excluded as these involved offering subscribers a temporary subscription before the actual subscription began. Also, subscriptions without visits but with any kind of engagement were removed.
A coherence check is indispensable to ensure the data can be reliable. Inexistent categories in the preferred content section variable meant the user did not log in during the month. Mismatching subscription durations were adjusted by computing the difference between the subscriptions’ start and end dates. Furthermore, some inconsistencies were found and rectified within the subscription’s classification. Keeping unique instances and removing the outliers reduced the size of the datasets by 10.8% in the first sample and 10.1% in the second.
Having many available features that interact with each other, new variables were defined. For usability variables, in which there was available data for the last two months before the subscription ended, the following measures were derived:
The sum of activity in both periods, i.e. total articles read in both periods.
The proportion of activity per period, i.e. the percentage of articles read in the first or second period, highlights which period the user was more engaged.
Average activity per day for each period and both periods aggregated.
Binning usage metrics for each period according to percentiles (e.g. N_articles_N30 divided in 20th percentiles) and the days with visits by the days in a month, this way reducing the impact of extreme values on the model’s performance.
Furthermore, binary variables were created to indicate user interaction with the website features (such as comment, share, or save). The maximum RFV values were split into three columns, each indicating a value of the RFV variable. For newsletters, the click-through rate, the sum of the clicks and openings, and a binary variable for user newsletter interaction were computed.
We derived the subscriber’s age at the end of the subscription from the birthday. The start and end dates of the subscription were transformed into the weekday and the day of the month. The registration date was transformed into days since the user registered. Variables of days since the first subscription (tenure_days) and days with active subscriptions (active_subs_days) were converted into years.
A binary variable was computed to determine if the current product was the subscribers’ most frequent choice and the average price per day on the current subscription.
Finally, the SUBSCRIPTION_PRODUCT was unified into three classes comprising monthly, quarterly and semi-annual, and annual or larger subscriptions. Classes with less than 5% of instances were aggregated into one, defined as the “other”. As most ML algorithms cannot use text to perform predictions, these variables were transformed using label encoding and weight of evidence techniques.
Data modeling
Feature selection plays a key role in the model’s performance and computational costs. Selecting a small but highly predictive subset of variables reduces collinearity issues and increases model interpretability (Verbeke et al., Citation2012). Thus, the features gender and job were removed (which had, respectively, 33% and 95% of missing values), along with features that indicated unreliable data during the coherence check process (e.g. avg_subscription_days, max_subscription_days).
Groups of features representing the same type of information were identified to perform feature selection. An initial predictor group with one variable per group was created, defining a base dataset constituted by features representing distinct information. To select one variable from each information group, the initial predictor group was used to compute XGBoost models (Chen & Guestrin, Citation2016), in which all variables were constantly present in the models, except for the predictor that was being analysed, which was sequentially replaced by all other variables on that information group. The evaluation F1 Score (F1), gain, cover, and weight importance were extracted. For each information group, ranks and an average of the ranks were assigned to the variables based on each metric. The variable in each information group with the lowest average rank was selected. To understand each feature’s importance, the SHAP value was calculated. SHAP (SHapley Additive exPlanations) provides explanations for individual predictions by quantifying the contribution of each feature to the prediction. SHAP values are based on cooperative game theory. Shapley values assign a value to each player in a cooperative game based on their marginal contribution to every possible coalition. In the context of machine learning, each feature is considered a “player”, and the prediction outcome is considered the “payoff” (Lundberg & Lee, Citation2017).
Following variable selection, the variables with absolute Pearson correlation (Taylor, Citation1990) over 0.75 were replaced with an equivalent variable in a different format, keeping the variable with the largest churn correlation. A sequential variable removal was conducted, and variables were removed if the model’s F1 increased. The final training sets contained 16 and 11 predictors for Models 1 and 2, respectively (see ).
During the modelling stage, preprocessed datasets were sorted by subscriptions’ end date. For Model 1, it was split into the train (75%) and test data (25%) for Model 2 into the train (48%), validation (32%), and test data (25%). The churn percentage in the Model 1 dataset was 8% on train and test data. Whereas for Model 2, churn was 17%, 25%, and 31% for training, validation, and test data, respectively.
The oversampling technique SMOTE NC (Chawla et al., Citation2002) was applied to the training datasets to improve predictive performance by balancing the instances in each class. The validation and test datasets maintained the original distribution to assess the models’ performance, presenting a natural distribution of churners. Furthermore, the original and oversampled training data were relied on to build models based on state-of-the-art algorithms XGBoost and LightGBM. Moreover, RF and DT models were also constructed for performance comparison. For the algorithms developed on top of the original training data distribution, the parameter class_weight was set to balance.
These algorithms have several parameters that can be used to optimise the models’ performance and reduce the overfitting effect on training data. Thus, a grid search with 3-fold cross-validation was computed for each algorithm and training dataset combination with the parameters defined in . To select the optimal parameter combination, the averages of multiple evaluation metrics (accuracy, balanced accuracy, precision, recall, F1, and Area Under the Curve (AUC)) were extracted from the grid search, and the five models with the highest averages on each metric were considered, producing 360 different models (5 (top 5) × 6 (evaluation metrics) × 4 (algorithms) × 2 (datasets)). These were evaluated against the test and validation datasets, enabling the parameter selection for each dataset distribution and algorithm with the highest F1 and AUC. The results of this selection are detailed in the Results section. Finally, Model 1 and Model 2 were selected based on the highest F1 and AUC. F1 is a metric that combines precision and recall. It is a favoured metric when dealing with class imbalance problems. Moreover, AUC considers sensitivity and specificity as individual class performance metrics over all possible thresholds.
Table 3. Parameters considered for grid search cross-validation per model.
Evaluation and deployment
Two consecutive experiments were conducted, one for each model, involving daily churn predictions, categorising subscribers with a predicted probability to churn over 50% as “probable churners”. A/B testing was performed in both experiments, where 50% of the “probable churners” were sampled to the verification group (group to be targeted with a retention campaign), and the remaining 50% were sampled to the control group (no action was taken). represents the framework used in both experiments.
Figure 2. Daily predictions pipeline.
Model 1
The experiment to evaluate Model 1 was implemented over a period of three weeks in September 2021, where daily churn predictions were performed on recurrent and non-recurrent end subscribers. The retention measure of the first experiment was to offer one month of free subscriptions for subscribers who purchased an annual subscription.
Model 2
A second experiment was tested in April 2022 to evaluate Model 2, where daily churn predictions were conducted on non-recurrent subscriptions. Having already analysed Model 1 results, it was decided to act on “probable churners” through two channels: a newsletter containing content about the Ukrainian war and a phone call (when a phone number was available) with a more personalised approach.
Results
Models selection
The models attained with the grid-search parameter selection resulted in eight possible modelling options for both modelling contexts. The evaluation metrics presented in indicate that:
For recurrent and non-recurrent subscriptions (Model 1), DT and RF present the lowest performance considering the F1 in contrast with LightGBM and XGBoost. However, only XGBoost built with the non-balanced dataset does not overfit the training data.
For non-recurrent subscriptions (Model 2), the F1 measure increases on all algorithms and shows a good generalisation when predicting unseen data. The eight models present a similar performance, and XGBoost trained with the original dataset has the highest F1 performance.
The models trained with balanced datasets overfit the train data for both modelling contexts.
Table 4. Evaluation metrics of models trained with original and balanced data for both modelling contexts.
Therefore, considering F1 and AUC, the selected models were the XGBoost trained on the original dataset distributions. Model 1 attained an F1 of 76% for the training dataset and 72% for the test data (see ). As for the AUC, the results were 98% and 96%, respectively. When considering Model 2, the evaluation metrics were 88% for train and validation data, 86% for test data for the F1, and 99%, 98%, and 98% for the AUC.
Table 5. Evaluation metrics from selected models.
Models interpretation
XGBoost allows the analysis of each feature’s importance in terms of its weight, gain, and cover. However, for each measure, features could have different importance. Furthermore, SHAP values ensure consistent and accurate results, allowing for a more appropriate interpretation of the features’ importance (Lundberg & Lee, Citation2017). Moreover, tree SHAP extends the evaluation of features’ importance by identifying how much impact each feature has on the model’s output for individual instances. SHAP’s summary plot shows features vertically sorted from most to least important across all data samples, and their impact on the instance’s outcome can be analysed horizontally. The colour of each data point denotes the true value of the feature. The main reader subscription retention drivers and their impact are presented in and elaborated on in the following paragraphs.
Figure 3. Features importance ranking by SHAP values.
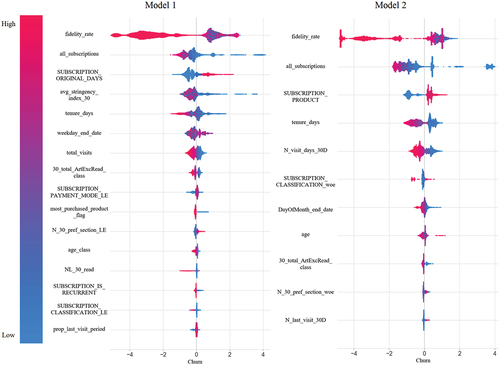
In both models, the predictors show a similar effect on churn likelihood and share a similar importance ranking in churn prediction. The two predictors with the highest impact on churn prediction are the fidelity_rate (percentage of days with an active subscription since the first subscription date) and the total amount of subscriptions purchased (all_subscriptions). Furthermore, higher values (higher percentage of days with active subscriptions and higher number of subscriptions purchased) for both features are related to a lower propensity to churn. This fact shows that brand loyalty metrics are a good indicator of churn probability, which is consistent with what previous authors have found (Ribeiro et al., Citation2022).
Moreover, the third most important predictor differs between models: in the first model, it is the current subscription length (in days) (SUBSCRIPTION_ORIGINAL_DAYS); in the second one, it is the current subscription product (monthly, annual, and larger, or in between) (SUBSCRIPTION_PRODUCT). Although both features are on different scales, they represent similar information: subscriptions with one year duration present a higher propensity to churn, whereas monthly subscriptions are more related to a lower likelihood to churn. Those findings are also supported by the industry literature that mentions subscription fatigue as one reason for churn (Guaglione, Citation2021). Readers argue that the reduced reading time does not justify committing to a lengthy subscription. Furthermore, the increase in subscription options across the industry leads the reader to buy shorter subscriptions (Felps, Citation2022).
Finally, another feature where the difference in the churn likelihood is evident in both models is the total number of days the subscriber visited the website during the last subscription’s month(s) (N_visit_days_30D). More days with visits are related to a lower likelihood of churn. This result is aligned with what was already known by the industry. According to the examples presented at the INMA Digital Subscriber Retention Master Class (2022), readers who visit the site daily have less propensity to churn. Furthermore, editorial newsletters are a way to increase engagement and reduce churn (Haggins & Felps, Citation2022).
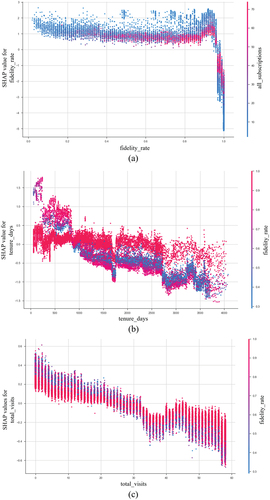
SHAP dependency plots help understand the effect of individual features over predictions (see ). For example, from ), it is visible that subscribers who have almost always had an active subscription since their first subscription (96% fidelity_rate) are less likely to churn. In addition, ) shows a downward trend in the propensity to churn as the days since the first subscription (tenure_days) increase, having a turnover moment of around 2.5 years, most visible for a group of subscriptions. The same trend is portrayed in ). As the total days with visits during the last two months of the subscription increase, the churn likelihood decreases, with a turnover of around 25 days with visits in the last 60 days of the current subscription.
Figure 4. SHAP dependency plots extracted from some model 1 predictors.
A/B tests evaluation
Model 1
Model 1 was applied to 4,376 subscriptions, of which 1,003 (20%) were considered “probable churners”. From those, 501 (50%) were allocated to the verification group and were impacted by the retention campaign. Model 1 predicted a higher percentage of churn by ten percentage points (pp) in the evaluation group than it predicted when training and testing the model. Furthermore, the F1 considering only the control group and users predicted as non-churners was 14.5%, which indicates that the model predicted poorly. Moreover, considering all users predicted as non-churners and the variation group, the F1 was 16%, which indicates that most of the predictions defined as churners were, in fact, non-churners. However, these results do not directly indicate that the retention action was successful, as the control group’s results were much lower than expected.
Two main out of our control facts negatively impacted the model results. In this model, the stringency index was the fourth most important predictor. During the experiment period, the index was lower than the values considered in the model due to a decrease in Covid restrictive measures (see ). On the other hand, the marketing team implemented a competitive marketing campaign across the website that induced churn. Readers were invited to subscribe to an annual subscription with three months of free content, exclusive for new joiners. However, the retention campaign pushed during the experiment offered one month for a yearly subscription to the high-propensity churners. This induced subscribers to churn and subscribe as new joiners (i.e. new registered readers). Competing against a better offer than the one being pushed and monitored for the experiment resulted in biased results.
Figure 5. Average stringency index per dataset.
Lastly, the model’s training was 30 days prior to the churn moment (last subscription day). However, to impact customers with the retention campaign before the end of the current subscription, for the experiment period, predictions were carried out 37 days before the churn moment (seven days before the subscription’s end day).
Model 2
The average stringency index was removed to avoid the challenges faced during the first experiment, and predictions were computed for the 30 days before the churn moment.
During its evaluation period, Model 2 was applied to 1,286 subscriptions (see ), with a forecasted churn rate of 30%. Of the subscribers predicted as “probable churners”, 193 (50%) were targeted with the retention actions (verification group). From those, 114 churned. As for the control group (194 subscribers), 108 subscribers cancelled their subscriptions. This difference means that a higher percentage (59%) of subscribers cancelled when targeted with the retention actions compared to subscribers who were not targeted by a campaign (56%). Nonetheless, this is not a significant difference (1, N = 387) = 0.46, p = .5) to corroborate that it is better not to contact customers who are ending their subscriptions.
Table 6. Retention actions results for model 2.
Only 65 subscribers opened the re-engagement newsletter; of those, 45% renewed their subscription, whereas 39% did not open the newsletter, not presenting a significant difference between samples based on the chi-squared test (1, N = 193) = .54, p = .46). Conversely, 86 subscribers from the variation group were contacted via mobile phone. Of those, 56 answered the phone, resulting in 43% renewing their subscription. In contrast, only 17% of subscribers who did not answer the phone call renewed their subscriptions. Only 20% of subscribers without an associated phone number, thus not contacted via phone, renewed their subscriptions. These results indicate that a phone call action is significantly more successful.
Discussion and conclusions
Following a long period of a downward trend in newspapers’ readership, newspapers have been increasingly adopting digital business models. Compared to other online services, publishers face subscription fatigue and churn increase. Nevertheless, the number of online newspaper subscribers has been increasing over the years. During the past two years, the COVID-19 pandemic and the Ukrainian war have contributed to an increase in subscriptions (Newman et al., Citation2021).
PÚBLICO newspaper follows the market trends, increasing subscribers and churn. In light of this dual challenge, it was decided to build a model to predict probable churning subscribers. This type of model is beneficial not only to identify churners but also to identify factors that drive churn, allowing the implementation of preventive and engagement measures (Fernandes et al., Citation2023). Two models were built and tested to attain the objective mentioned above. One model (Model 1) contains all subscriptions, and a second (Model 2) contains only non-recurring subscriptions. Models were evaluated using A/B tests in different periods, applying different retention strategies. Results show the percentage of days with an active subscription (fidelity_rate), the total amount of subscriptions purchased (all_subscriptions), the current subscription length (SUBSCRIPTION_ORIGINAL_DAYS), the current subscription product (SUBSCRIPTION_PRODUCT), and the total number of days the subscriber visited the website during the last subscription’s month(s) (N_visit_days_30D) are the top churn predictors.
Our study is very relevant for online newspapers as it unequivocally shows that:
Contacting probable churning customers via a phone is significantly more effective in maintaining subscribers than sending a newsletter or not doing any action (43%, 66%, and 55% churn on each action, respectively). Subscribers contacted with a more direct retention action (personalised phone call) are more likely to renew their subscriptions.
Churn subscription models can be an excellent cost-saving tool by identifying “probable churns”. Publishers can create actions to reduce churn and act only on high-propensity churners. One derived result of this model is the ability to forecast the number of cancellations, thus allowing newspapers to better plan their retention and attraction campaigns.
Subscribers with lower fidelity rates and few subscriptions presented a higher propensity to cancel their subscriptions. These findings are consistent with the work of Campbell (Citation2018) and reinforce the need for publishers to consider tailored strategies to address the needs of this subscriber segment in order to straighten their value perception and desire to maintain their subscription.
While product usage variables were not found to be the most critical variables for churn prediction, our findings align with what was found in the literature (American Press Institute, Citation2018; Financial Times, Citationn.d.; Veseling, Citation2018), where higher product usage is related to lower churn. This finding reinforces the need for publishers to create engaging content to keep readers’ visits high over time. The insight on the number of days with visits in the last two subscription months supported PÚBLICO’s decision to apply an automated content newsletter further to impact users who had less than 42% of days active.
Newspapers should consider the over-coverage of a topic, as it can provoke the well-known “news fatigue”, thus leading people to bypass news consumption (Fitzpatrick, Citation2022). In our study, this can be extrapolated from the importance of the stringency index in Model 1, which relates lower stringency values to higher churn probabilities.
A/B testing is a powerful tool to evaluate actions that result from prediction models, thus showing that A/B tests one more way for newspapers to follow other industries in becoming more data-driven in their decision-making.
A/B tests’ results in experiment 2 could have been more representative if more subscribers had a phone registered in their account. The good results achieved by calling “probable churners” show the relevance of newspapers to maintaining a complete and updated record of all subscribers.
In terms of theoretical implications, this study is also very relevant to the scientific community by filling a gap in the literature and providing the main engagement drivers to churn (Fernandes et al., Citation2023). We demonstrated that it is possible to successfully build online news media subscription churn prediction models and identify the factors that drive subscription cancellation. Researchers or analytical professionals could follow the steps described in our study to replicate, extend, or adapt these models in newspapers and other industries that employ online subscription business models.
Despite its benefits and contributions, this study still faced some limitations that future studies could improve. The statistical significance of experiment 2 could have been higher if more subscribers had a phone registered in their account. In future studies, newspapers should make an effort to update their subscribers’ database prior to any empirical evaluation. PÚBLICO had limited indicators of website engagement that could improve prediction performance and provide an understanding of the churn decision, such as preferred access channel, most used device, time on website/app, interactions with the customer via the call centre, and purchase channel. Future studies could use the previously mentioned indicators to improve churn models. In addition, employing news content-related variables, such as keywords, could be beneficial in implementing personalised retention strategies.
Phone calls done by an agent are costly and require human resources. Future studies could analyse the use of automated phone calls or other automated re-engagement measures. In addition, more retention actions should be tested as a means to implement distinct and personalised actions for customers with different probabilities of churn.
Disclosure statement
No potential conflict of interest was reported by the author(s).
Additional information
Funding
Notes on contributors
Lúcia Madeira Belchior
Lúcia Belchior is currently a second-year Master student in Information Management, with a specialization in Knowledge Management and Business Intelligence, at NOVA IMS. She is a junior Data Scientist at Metyis. Enthusiastic about data science, big data, and data engineering.
Nuno António
Nuno António holds a PhD in Science and Information Technology, a master’s degree in hotel administration and management, and a degree in software engineering. His research interests are related to the application of Machine Learning, Text Mining, Data Mining, Social Media Analytics, and Big Data. Nuno Antonio is invited Assistant Professor at Nova IMS. He is also the CTO of Itbase/WareGuest, a company specialised in the development of decision support systems.
Elizabeth Fernandes
Elizabeth Fernandes is currently a third year PhD student in Information Science and Technology at ISCTE. She is Head of Reporting and Analytics at KANTAR and former Head of Analytics and Audience insights of the Portuguese newspaper Público. She is also an Assistant Professor at IPVC. Her research interests include data science, big data, and business analytics, particularly user modelling for acquisition, engagement, and conversion. Passionate about extracting valuable information from data, she has collaborated with hospitality, retail, and media companies.
References
- Abdollahpouri, H., Malthouse, E. C., Konstan, J. A., Mobasher, B., & Gilbert, J. (2021). Toward the next generation of news recommender systems. The Web Conference 2021 - Companion of the World Wide Web Conference, WWW (pp. 402–406). https://doi.org/10.1145/3442442.3452327
- Ahn, J., Hwang, J., Kim, D., Choi, H., Kang, S. (2020). A survey on churn analysis in various business domains. Institute of Electrical and Electronics Engineers Access, 8, 220816–220839. https://doi.org/10.1109/ACCESS.2020.3042657
- American Press Institute. (2018). Paths to Subscription: Why recent subscribers chose to pay for news. https://www.americanpressinstitute.org/publications/reports/survey-research/paths-to-subscription/single-page/
- Antonio, N., de Almeida, A. M., Nunes, L., Batista, F., & Ribeiro, R. (2018). Hotel online reviews: Creating a multi-source aggregated index. International Journal of Contemporary Hospitality Management, 30(12), 3574–3591. https://doi.org/10.1108/IJCHM-05-2017-0302
- Arrese, Á. (2016). From Gratis to Paywalls: A brief history of a retro-innovation in the press’s business. Journalism Studies, 17(8), 1051–1067. https://doi.org/10.1080/1461670X.2015.1027788
- Attfield, S., Kazai, G., & Lalmas, M. (2011). Towards a science of user engagement. Position paper. WSDM Workshop on User Modelling for Web Applications. http://www.dcs.gla.ac.uk/~mounia/Papers/engagement.pdf
- Ballew, B. (2009). Elsevier’s Scopus® Database. Journal of Electronic Resources in Medical Libraries, 6(3), 245–252.
- Burez, J., & Van den Poel, D. (2007). CRM at a pay-TV company: Using analytical models to reduce customer attrition by targeted marketing for subscription services. Expert Systems with Applications, 32(2), 277–288. https://doi.org/10.1016/j.eswa.2005.11.037
- Campbell, C. (2018, August). Engaged readers don’t churn: Retention lessons for digital subscriptions. WAN-IFRA Reports.
- Cardoso, G., Paisana, M., & Pinto-Martinho, A. (2020). Digital news report 2020 - PORTUGAL data. OberCom Reuters.
- Chakraborty, A., Ghosh, S., Ganguly, N., & Gummadi, K. P. (2017). Optimizing the recency-relevancy trade-off in online news recommendations. 26th International World Wide Web Conference, WWW 2017 (Vol. i. pp. 837–846). https://doi.org/10.1145/3038912.3052656
- Chapman, P., Clinton, J., Kerber, R., Khabaza, T., Reinartz, T., Shearer, C., & Rudiger, W. (2000). Crisp-Dm 1.0. CRISP-DM Consortium, 3, 76.
- Chawla, N. V., Bowyer, K. W., Hall, L. O., & Kegelmeyer, W. P. (2002). SMOTE: Synthetic minority over-sampling technique. Journal of Artificial Intelligence Research, 16, 321–357. https://doi.org/10.1613/jair.953
- Chen, T., & Guestrin, C. (2016). Xgboost: a scalable tree boosting system. Proceedings of the 22nd ACM SIGKDD International Conference on Knowledge Discovery and Data Mining (pp. 785–794). https://doi.org/10.1145/2939672.2939785
- Coussement, K., & De Bock, K. W. (2013). Customer churn prediction in the online gambling industry: The bene ficial effect of ensemble learning. Journal of Business Research, 66(9), 1629–1636. https://doi.org/10.1016/j.jbusres.2012.12.008
- Coussement, K., Lessmann, S., & Verstraeten, G. (2017). A comparative analysis of data preparation algorithms for customer churn prediction: A case study in the telecommunication industry. Decision Support Systems, 95, 27–36. https://doi.org/10.1016/j.dss.2016.11.007
- Coussement, K., & Van den Poel, D. (2008). Churn prediction in subscription services: An application of support vector machines while comparing two parameter-selection techniques. Expert Systems with Applications, 34(1), 313–327. https://doi.org/10.1016/j.eswa.2006.09.038
- Coussement, K., & Van den Poel, D. (2009). Improving customer attrition prediction by integrating emotions from client/company interaction emails and evaluating multiple classifiers. Expert Systems with Applications, 36(3 PART 2), 6127–6134. https://doi.org/10.1016/j.eswa.2008.07.021
- Davoudi, H. (2018). User Acquisition and engagement in digital News Media.
- Davoudi, H., Aijun, A., & Edall, G. (2019). Content-based dwell time engagement prediction model for news articles. Proceedings of the 2019 Conference of the North American Chapter of the Association for Computational Linguistics: Human Language Technologies (Vol. 2).
- De Caigny, A., Coussement, K., & De Bock, K. W. (2018). A new hybrid classification algorithm for customer churn prediction based on logistic regression and decision trees. European Journal of Operational Research, 269(2), 760–772. https://doi.org/10.1016/j.ejor.2018.02.009
- Ekholm, P. (2019). Machine learning challenge winning solutions. https://medium.com/mittmedia/we-looked-into-why-our-subscribers-churned-with-machine-learning-d1ac1adf8009
- Farquad, M. A. H., Ravi, V., & Raju, S. B. (2014). Churn prediction using comprehensible support vector machine: An analytical CRM application. Applied Soft Computing Journal, 19, 31–40. https://doi.org/10.1016/j.asoc.2014.01.031
- Felps, P. (2022). Piano shares how publishers can improve retention in a post-pandemic world. https://www.inma.org/blogs/conference/post.cfm/piano-shares-how-publishers-can-improve-retention-in-a-post-pandemic-world
- Fernandes, E., Moro, S., & Cortez, P. (2023). Data science, machine learning and big data in digital journalism: A survey of state-of-the-art, challenges and opportunities. Expert Systems with Applications, 221, 119795. https://doi.org/10.1016/j.eswa.2023.119795
- Fernandes, E., Moro, S., & Cortez, P. (2024). A data-driven approach to improve online consumer subscriptions by combining data visualization and machine learning methods. International Journal of Consumer Studies, 48(2), e13030.
- Financial Times. (n.d.). Lessons on retention from the FT (and beyond). https://www.ftstrategies.com/en-gb/insights/lessons-on-retention-from-the-ft-and-beyond/
- Fitzpatrick, N. (2022). No News is Not Good News: The Implications of News Fatigue and News Avoidance in a Pandemic World. Athens Journal of Mass Media and Communications, 8(3), 145–160. https://doi.org/10.30958/ajmmc.8-3-1
- Fletcher, R., & Nielsen, R. K. (2017). Paying for online news: A comparative analysis of six countries. Digital Journalism, 5(9), 1173–1191. https://doi.org/10.1080/21670811.2016.1246373
- Ganesh, J., Arnold, M. J., & Reynolds, K. E. (2000). Understanding the customer base of service providers: An examination of the differences between switchers and stayers. Journal of Marketing, 64(3), 65–87. https://doi.org/10.1509/jmkg.64.3.65.18028
- Global Change Data Lab. (2021). Our World Data. https://ourworldindata.org/
- Guaglione, S. (2021). Publishers rethink their value to stave off subscription fatigue among new paying readers. https://digiday.com/media/publishers-rethink-their-value-to-stave-off-subscription-fatigue-among-new-paying-readers/
- Gunnarsson, C. L., Walker, M. M., Walatka, V., & Swann, K. (2007). Lessons learned: A case study using data mining in the newspaper industry. Journal of Database Marketing & Customer Strategy Management, 14(4), 271–280. https://doi.org/10.1057/palgrave.dbm.3250058
- Haggins, J., & Felps, P. (2022). Nurturing media subscribers is key to controlling churn. https://www.inma.org/blogs/conference/post.cfm/nurturing-media-subscribers-is-key-to-controlling-churn
- Hanzelik, P. P., Kummer, A., & Abonyi, J. (2022). Edge-computing and machine-learning-based framework for software sensor development. Sensors, 22(11), 4268. https://doi.org/10.3390/s22114268
- Jayaswal, P., Prasad, B. R., Tomar, D., & Agarwal, S. (2016). An ensemble approach for efficient churn prediction in telecom industry. International Journal of Database Theory and Application, 9(8), 211–232. https://doi.org/10.14257/ijdta.2016.9.8.21
- Kartajaya, H., Kotler, P., & Hooi, D. H. (2019). Marketing 4.0: moving from traditional to digital. World Scientific Book Chapters (pp. 99–123).
- Ke, G., Meng, Q., Finley, T., Wang, T., Chen, W., Ma, W., Ye, Q., & Liu, T. Y. (2017). Lightgbm: A highly efficient gradient boosting decision tree. Advances in Neural Information Processing Systems, 30.
- Keramati, A., Jafari-Marandi, R., Aliannejadi, M., Ahmadian, I., Mozaffari, M., & Abbasi, U. (2014). Improved churn prediction in telecommunication industry using data mining techniques. Applied Soft Computing Journal, 24, 994–1012. https://doi.org/10.1016/j.asoc.2014.08.041
- Kotler, P., Lane Keller, K., Brady, M., Goodman, M., & Hansen, T. (2016). Marketing Management (3rd ed.). Pearson Education Ltd.
- Lundberg, S. M., & Lee, S. I. (2017). A unified approach to interpreting model predictions. Advances in Neural Information Processing Systems, 30.
- McKinney, W. (2010). Data structures for statistical computing in python. In S. van der Walt & J. Millman (Eds.). Proceedings of the 9th Python in Science Conference (pp. 56–61). https://doi.org/10.25080/Majora-92bf1922-00a.
- Newman, N., Fletcher, R., Kalogeropoulos, A., & Rasmus Kleis, N. (2019). Digital News Report. Digital News Report.
- Newman, N., Fletcher, R., Robertson, C. T., Eddy, K., & Nielsen, R. K. (2022). Reuters institute digital news report 2022.
- Newman, N., Fletcher, R., Schulz, A., Andi, S., Robertson, C., & Nielsen, R. (2022). Digital news report 2021 (10th ed.). In Reuters Institute. https://reutersinstitute.politics.ox.ac.uk/digital-news-report/2021
- Newman, N., Fletcher, R., Schulz, A., Andı, S., Robertson, C. T., & Nielsen, R. K. (2021). Reuters institute digital news report 2021.
- Newman, N., Richard Fletcher, W., Schulz, A., Andı, S., & Kleis Nielsen, R. (2020). Reuters institute digital news report 2020. 112.
- Nitzan, I., & Libai, B. (2011). Social effects on customer retention. Journal of Marketing, 75(6), 24–38. https://doi.org/10.1509/jm.10.0209
- Pattabhiramaiah, A., Sriram, S., & Manchanda, P. (2019). Paywalls: Monetizing Online Content. SSRN Electronic Journal, 83(2), 19–36. https://doi.org/10.1177/0022242918815163
- Pedregosa, F., Varoquaux, G., Gramfort, A., Michel, V., Thirion, B., Grisel, O., Blondel, M., Prettenhofer, P., Weiss, R., Dubourg, V., Vanderplas, J., Passos, A., Cournapeau, D., Brucher, M., Perrot, M., & Duchesnay, E. (2011). Scikit-learn: Machine learning in python. Journal of Machine Learning Research, 12, 2825–2830.
- Peña, V. C., Malthouse, E. C., & Mersey, R. D. (2023). Churning off the news: An analysis of newspaper subscriber churn across digital devices. Newspaper Research Journal, 44(2), 190–205. https://doi.org/10.1177/07395329231167374
- Pyle, D. (1999). Data preparation for data mining. In Diane D. Cerra (Ed.), Applied Artificial Intelligence (1st ed. Vol. 17, 5–6). Morgan Kaufmann Publishers Inc.
- Ribeiro, H., Barbosa, B., Moreira, A. C., & Rodrigues, R. (2022). Churn in services – a bibliometric review. Cuadernos de Gestion, 22(2), 97–121. https://doi.org/10.5295/cdg.211509hr
- Rußell, R., Berger, B., Stich, L., Hess, T., & Spann, M. (2020). Monetizing Online Content: Digital Paywall Design and Configuration. Business & Information Systems Engineering, 62(3), 253–260. https://doi.org/10.1007/s12599-020-00632-5
- Southern, L. (2019). How Swedish newspaper Dagens Nyheter halved subscriber churn in 2 years. https://digiday.com/media/how-swedish-newspaper-dagens-nyheter-halved-churn-to-8-in-2-years/
- SparkBeyond Team. (2021). Reducing churn for a European media company. https://www.sparkbeyond.com/case-study/reducing-churn-for-a-european-media-company
- Suárez, E. (2019). How to build a successful subscription news business: Lessons from Britain and Spain. February, 61–67.
- Taylor, R. (1990). Interpretation of the correlation coefficient: a basic review. Journal of diagnostic medical sonography, 6.1, 35–39.
- Tsai, C.-F., & Lu, Y.-H. (2010). Data mining techniques in customer churn prediction. Recent Patents on Computer Science, 3(1), 28–32.
- Tsai, C., & Lu, Y. (2009). Customer churn prediction by hybrid neural networks. Expert Systems with Applications, 36(10), 12547–12553. https://doi.org/10.1016/j.eswa.2009.05.032
- Uner, M. M., Guven, F., & Cavusgil, S. T. (2020). Churn and loyalty behavior of Turkish digital natives: Empirical insights and managerial implications. Telecommunications Policy, 44(4), 101901. https://doi.org/10.1016/j.telpol.2019.101901
- Verbeke, W., Dejaeger, K., Martens, D., Hur, J., & Baesens, B. (2012). New insights into churn prediction in the telecommunication sector: A profit driven data mining approach. European Journal of Operational Research, 218(1), 211–229. https://doi.org/10.1016/j.ejor.2011.09.031
- Veseling, B. (2018). The road to 1 million subscribers: FT helps users to build ‘habit’. https://wan-ifra.org/2018/04/the-road-to-1-million-subscribers-ft-helps-users-to-build-habit/
- Xiong, Y., Wu, R., Zhao, S., Tao, J., Shen, X., Lyu, T., Fan, C., &Cui, P., (2023). A data-driven decision support framework for player churn analysis in online Games. Proceedings of the 29th ACM SIGKDD Conference on Knowledge Discovery and Data Mining, Long Beach CA USA.
- Yuan, S., Bai, S., Song, M., & Zhou, Z. (2017). Customer churn prediction in the online new media platform: a case study on juzi entertainment. 2017 International Conference on Platform Technology and Service, PlatCon 2017 - Proceedings (pp. 0–4). https://doi.org/10.1109/PlatCon.2017.7883698