
Abstract
The aim of the present research was to develop a magnetic coconut carbon composite (Fe2O3/Fe3O4@CNC) as a solid-phase extraction (SPE) sorbent for the analysis of carcinogenic N-nitrosodimethylamine (NDMA) in pharmaceuticals. Coconut composites modified with Fe2O3 and Fe3O4 were prepared and applied as SPE sorbent for the extraction of NDMA in pharmaceuticals. The sorbent was characterized with X-Ray, infrared spectroscopy and nitrogen porosimetry. The best ions for the Gas Chromatography-Mass Spectrometry with Selected Ion Monitoring (GC-MS/SIM) analysis were m/z 74 and 42 for NDMA, and m/z 80 and 46 for NDMA-d6 internal standard. System has offered great method performance in terms of sensitivity limit of quantitation (LOQ) 16 ng kg−1. The developed sorbent has enhanced the sensitivity and speed of analysis. The developed method was applied to authenticate the presence of NDMA in various pharmaceutical samples. Among the analyzed samples, NDMA impurities were relatively identified at high amounts in nizatidine samples.
Highlights
NDMA was verified in ranitidine, metformin and nizatidine
Fe2O3/Fe3O4@CNC composite was used for NDMA identification without pretreatment
SPE sorbent enhance sensitivity, reduce analysis time, sustain accuracy & precision
High level of NDMA impurity were found in nizatidine pharmaceuticals.
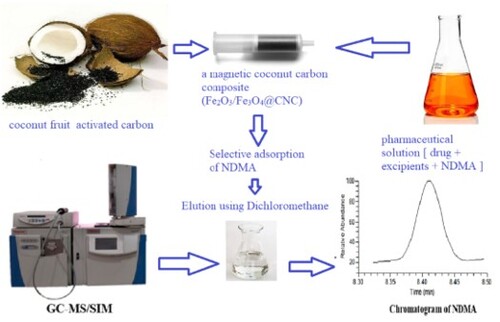
GRAPHICAL ABSTRACT
1. Introduction
Nitrosamines, with general chemical structure R2N−N = O, can be present in drugs as impurities and may increase the risk of cancer according to the Food and Drug Administration (FDA) [Citation1]. The World Health Organization (WHO) and the FDA that interim allowable intake of N-nitrosodimethylamine (NDMA) from pharmaceutical products are 96 ng/day or 0.32 µg g−1 [Citation2]. However, being NDMA a probable human carcinogen (type 2A) by the WHO’s International Agency for Research on Cancer (IARC), avoiding exposure to it completely is the best approach. NDMA is the most common member of the nitrosamines group. Besides, it can be detected in water [Citation3–7], foods including fruit drinks [Citation7], beverages [Citation8], milk and dairy products [Citation9], fish product [Citation10], meat [Citation11], and tobacco smoke and polluted indoor environments [Citation12].
The first discovery for the NDMA impurity in a pharmaceutical product was in Valsartan in 2018. As a result, the FDA recommended to recall Valsartan from pharmacies [Citation13]. From that case, we have learnt that NDMA can be generated during the synthesis of the active pharmaceutical constituents and can also result from its presence in reagents and solvents, and due to inadequate storage conditions [Citation14,Citation15]. Since late 2019, NDMA has been discovered in other pharmaceutical products like Ranitidine (RAN). Official drug organizations in several countries announced a sudden recall of RAN pharmaceutical products from drug markets and suggested stopping the manufacturing of these products because of their possible unacceptable high levels of NDMA [Citation16,Citation17]. RAN, chemically known as N-[2- ([[5-[(dimethylamino) methyl]furanyl]methyl]thio)-ethyl]-N-methyl-2-nitro-1,1- ethenediamine, is one of the most used drugs for the treatment of duodenal and gastric ulceration and gastric heartburn [Citation18]. In the second quarter of 2020, the FDA announced Metformin (MET) and Nizatidine (NIZ) pharmaceuticals recall after discovering NDMA [Citation1,Citation19]. Metformin (MET), N,N-dimethylimi-docarbonimidic diamide [Citation20], is widely used as a blood glucose-lowering drug. NIZ, as N-[2-[[[2-[(dimethylamino)methyl]-4-thiazolyl]methyl]thio]ethyl]-N″-methyl-2-nitro-1,1-ethenediamine, belongs to histamine H2-antagonist and is used for the reduction of gastric acid secretion [Citation21].
A main difficulty when analyzing NDMA impurities in pharmaceutical formulations is the co-extraction of the active principle and excipients. Different types of SPE cartridges were effectively used to extract NDMA from the pharmaceuticals as long as the drug substance is completely precipitated before passing through the cartridge materials [Citation22,Citation23]. It is a challenge to find a suitable precipitating agent that would precipitate the main active component and excipients in the drug while not losing NDMA impurities during the precipitation, as well as avoiding long extraction times. Charcoal-based SPE can be effective for the extraction and preconcentration of NDMA in different matrices [Citation5,Citation6], but in the case of pharmaceutical formulations, it requires the precipitation of drug substance and excipient before passing through cartridge [Citation22,Citation23].
Due to the toxicity of NDMA, the development of a rugged analytical technique for its quantification in different samples is an industry and health need. Analytical methodology existed for the assay of NDMA in foods, water, and other environmental samples based on Gas Chromatography-Mass Spectrometry with multiple reaction monitoring (GC-MS/MS) [Citation3,Citation6]; Selected Ion Monitoring (SIM): GC-MS/SIM [Citation7,Citation9]; Flame Ionization Detection (FID): GC-FID [Citation11]; Nitrogen and Phosphorus Detection (NPD): GC-NPD [Citation8,Citation10]; and Liquid Chromatography coupled to tandem Mass Spectrometry (LC-MS/MS) [Citation4], Direct Injection (DI) GC-MS [Citation24,Citation25], Exactive GC Orbitrap Mass Spectrometer (HRAM-GC-MS) [Citation26], headspace GC-MS [Citation27,Citation28], GC-MS/MS [Citation29,Citation30], with photo-Diode Array Detector (DAD) HPLC-DAD [Citation15], LC-MS/MS [Citation31–33] and LC-High Resolution (HR) MS [Citation34–36]. Most of the methodology available could not be used across pharmaceutical formulations that contained NDMA and presented limited sensitivity compared to what it was needed to quantify the daily intake of NDMA [Citation22]. Some methods were affected by limited selectivity by the co-extraction and detection of excipients in drugs. Furthermore, the thermal degradation of some of the drugs to NDMA (e.g. RAN in GC instrument) was observed to cause inaccuracy in the determination of NDMA present in the samples originally. The recently published GC-MS/MS method by Lim et al. [Citation22] showed adequate accuracy (95–105%) and precision (0.4–2.7%) during NDMA analysis in pharmaceuticals. Although this method analyzed NDMA without interferences from excipients and active ingredient in pharmaceuticals, the method requires multiple extraction steps. These include precipitating lipophilic drugs and excipients followed by a second step which involved the extraction of NDMA with a solid-phase extraction (SPE) containing activated carbon. Multi extraction steps are time consuming and not easy for routine examination in quality control (QC) laboratories. The LOD of the method was 0.3 µg kg−1 when using just 0.1 g of pharmaceutical product. In comparison to another recent method has also achieved similar LOD (1 µg NDMA L−1) values [Citation23]. The approach is based on Head Space extraction with Solid-Phase Micro-Extraction preceding GC-MS analysis (HS-SPME-GC-MS) for the quantification of NDMA in RAN samples. This method reduced the temperature to which heat sensitive impurity was exposed to during the analysis compared to the LC-MS/MS approach with Atmospheric Pressure Chemical Ionization (APCI) ionization source, which led to LOD 0.3 µg L−1. Although the method was not validated and error in the analysis was not given, the concentrations of NDMA quantified with HS-SPME-GC-MS were overall in agreement with those in LC-MS/MS. Concentration of NDMA <10 µg kg−1 could not be detected with both methods.
The main goal of this research was to develop a sensitive GC-MS method with a facile, efficient and selective extraction and analysis of NDMA in pharmaceutical products, overcoming limitations found with existing analytical methods. The method has been supported by the use of a new adsorbent (Fez2O3/Fe3O4 coconut activated carbon cartridge) for the estimation of NDMA in NIZ, RAN and MET pharmaceuticals.
The use of magnetic sorbent in the present study is due to its easiness, ease of process, high efficiency, high recovery, and rapid isolation [Citation37–47].
2. Material and methods
2.1. Description for used chemicals
N-nitrosodimethylamine was purchased from Sigma-Aldrich (St. Louis, USA). N-nitrosodimethylamine, 1 µg mL−1, (D6, 98% purity) soluble in dichloromethane-D2 was purchased from Cambridge Isotopes Laboratories, Inc. (Andover, USA). Dichloromethane of CHROMASOLV™ grade, 99.8% purity, was purchased from Honeywell/Riedel-de Haën™ Co. (Seelze, Germany). Dichloromethane was used in the preparation of standard solutions and samples.
2.2. Pharmaceutical formulation samples
A total of 26 pharmaceutical formulations were collected from community pharmacies in Saudi Arabia and Egypt. The studied formulations included 16 RAN pharmaceutical formulations, 7 MET tablets, and 3 NIZ capsules, all with different concentrations. All samples were obtained just after an urgent official recall of these formulations from local pharmacies because of the probability of the presence of toxic NDMA in 2019 and 2020.
2.3. Preparation of standard solutions
NDMA (50 µg mL−1) and NDMA-d6 internal standard (10 µg mL−1) stock solutions were prepared in dichloromethane and stored at 4 °C till use. NDMA working standards were prepared in the range of 0.0075 to 376 ng mL−1 by diluting the NDMA stock solutions with dichloromethane. An internal standard (NDMA-d6) solution was added to each working solution of standard and sample to attain a final concentration of 0.05 µg mL−1.
2.4. Synthesis of Fe2O3/Fe3O4@Coconut charcoal (Fe2O3/Fe3O4@CNC) adsorbent
Coconut fruits were collected from the indigenous market in Sakaka, Saudi Arabia and cracked to separate the shell from the pulp. The coconut shells were cleaned numerous times with tap water, then with bi-distilled water to remove stone, dust and dirt, finally dried in oven at a temperature of 80 °C for 24 h. At that point, 50 g of the dried coconut shells were crushed into small pieces and placed into a series of porcelain crucibles and covered with lids. Then, they were placed into a muffle furnace, heated to 400 °C at a rate of 15 °C/min and kept at 400 °C for 2 h in air atmosphere. The charcoal produced was allowed to cool down and grinded to a very fine powder with a mortar.
The Fe2O3/Fe3O4@CNC composite was prepared according to the following procedures: the coconut charcoal powder (25 g) was added to bi-distilled water (200 mL) containing FeCl3.6H2O and FeSO4.7H2O salts in the molar ratio 2:1 and its temperature was previously adjusted at 80 °C. The mixture was stirred for impregnation of Fe3+/Fe2+ on the surface of charcoal for 30 min before the addition of NH4OH solution to adjust the pH to around 9. The resultant charcoal-magnetic adsorbent suspended in solution were kept under these conditions for an additional 1 h. At this point, the formed product was filtrated, washed with bi-distilled water for numerous times and dried in the oven at 70 °C for 15 h.
2.5. Preparation of Fe2O3/Fe3O4@CNC composite as SPE sorbent
The Fe2O3/Fe3O4@CNC composite was prepared as sorbent for SPE to adsorb NDMA. The magnetic charcoal (1.5 g), so called Fe2O3/ Fe3O4@CNC composite, was packed in 10 mL polypropylene syringe column in dry form after inserting a piece of cotton on the bottom of column. The cartridges were conditioned with 10 mL of water and/or methanol.
2.6. Fe2O3/Fe3O4@CNC composite SPE sorbent
The content of one tablet /or sachet /or capsule or one ampoule for each pharmaceutical formulation was used, and the total volume of the suspension was completed to 15 mL with water for the analysis of RAN formulations; and in 15 mL of methanol for NIZ and MET formulations. The formulation was spiked by 0.05 µg/mL of an internal standard NDMA-d6 in methanol. The sample suspension was sonicated for 10 min followed by stirring for 10 min and centrifuged at 4000 rpm for additional 10 min. Then the supernatant was applied to the SPE cartridge packed with the developed Fe2O3/Fe3O4@CNC cartridge and eluted supported with the vacuum from the filtration pump. The elution was carried out and the adsorbed NDMA and NDMA-d6 on cartridge were eluted with 10 mL of dichloromethane. To eliminate residual water, the solid anhydrous sodium sulphate was added. The SPE method efficiency was tested with four different formulations were used after spiking with different concentration levels of NDMA standard solution.
2.7. Descriptions instruments and working conditions
NDMA analysis was performed using a TRACETM 1310 gas chromatograph coupled to AI/AS1310 auto-sampler unit (Thermo Scientific, Waltham, USA). NDMA (1µL) standard solutions and samples were injected and separated on a TG-WAXMS column with dimensions 60, 0.32 mm internal diameter (I.D.), 0.5 μm thickness (Thermo Scientific, Waltham, USA). The injection unit with a splitless inlet was adjusted at 230°C and the helium gas was used as a carrier gas at a flow rate of 1 mL/min. The oven temperature program included a first step at 35°C for 1 min, then ramped at 25°C/min to 130°C, after that the temperature was raised at 125°C /mi. to 220°C and kept at 220°C for 6 min. The GC was directly connected to an ISQLT single quadruple mass spectrometer with a transfer line temperature of 200°C. The mass spectrometer was operated with an electron impact at 70 eV and the ion source was adjusted at 180°C. The acquisition of fragment ions was performed with Selected Ion Monitoring (SIM) mode with a scan rate of 0.3 s. Xcalibur 3.1 software was used for method setup and data processing.
The developed carbon was characterized with a Shimadzu IR Tracer-100 Fourier Transform Infrared Spectrophotometer. The X-ray diffraction patterns for the Fe2O3/Fe3O4@CNC material using the Maxima–X (D/Max2500VB2+/Pc, Shimadzu Company, Japan) with an X-ray Wavelength Copper (Cu) detector. The morphology of the composite was characterized with Field Emission Scanning Electron Microscopy (FESEM) (Thermo Scientific Quattro S, Thermo Fischer, Waltham, MA, USA) at 20 kV. Microgrphs of the composite surface were captured at varying magnifications (10000x and 100000x), and Electron Dispersive X-Ray (EDX) was performed using the Oxford Instruments INCA software. The pore size distribution and surface area of the composite were estimated by measurement of N2 adsorption–desorption isotherms at 77 K using an automated gas sorption analyzer A NOVA 4200e (Quantachrome Instruments, USA). The degassing time was 8 h at 150 °C. The data was treated with Brunauer–Emmett–Teller (BET) and Barrett-Joyner-Halenda (BJH) to obtain the specific surface area and size distribution of the composite’s porosity, respectively.
2.8. Method validation
The GC-MS method for the determination of NDMA was validated by testing linearity, accuracy, precision, LOD, LOQ, and selectivity. Linearity was evaluated by the construction of a calibration curve that was prepared by plotting the peak area against the nanogram NDMA mL−1 in the existence of NDMA-d6 as an internal standard. The accuracy and the precision of the method were determined by the calculation of the recovery percentage and relative standard deviation (RSD) of the GC-MS readings of different spiked concentration levels of NDMA. LOD and LOQ were estimated from their corresponding equations according to the International Conference for Harmonization (ICH) guidelines [Citation48].
3. Results and discussion
3.1. Characterizing Fe2O3/Fe3O4@CNC composite using X-Ray diffraction analysis (XRD), Fourier Transform Infrared (FTIR), Brunauer–Emmett–Teller and Barrett–Joyner–Halenda model (BET-BJH) and Scanning Electron Microscopy (SEM)
3.1.1. X-Ray diffraction analysis (XRD)
The XRD drffractograms of bare coconut charcoal (CNC) and the developed iron oxides@coconut charcoal composite are given in Figure . In diffraction ‘a’, the bare CNC powder revealed characteristic broad diffraction peaks assigned at 2θ = 23° and 43° due to the typical amorphous structure of the carbon powder [Citation49]. Upon modifying the carbon with iron oxides, the diffraction pattern rendered markedly crystalline with a slightly intense hump attributed to CNC species. As shown in diffraction (b), there are nine diffraction peaks attributed to mixed iron oxides. The peaks allocated at 2θ = 30.2°, 35.6°, 43°, 53.4°, 57°, and 62.8° are matched with the JCPDS No. 82–1533 and attributed to (220), (311), (400), (422), (511), and (440) characteristic for Fe3O4 cubic crystallinity [Citation50]. In addition, the peaks figured out at 2θ = 32.6°, 46.8° and 58.2° are due to the presence of Fe2O3 particulates [Citation51]. These results propose the development of two iron oxides with the majority of Fe3O4 and some Fe2O3 to be impregnated on CNC powder. Moreover, the drastic reduction of peak intensity for Fe2O3/Fe3O4@CNC composite compared to bare CNC reflects a smaller particle size of the former compared to the latter. The average size of the crystallite was evaluated by using the well-known Debye-Scherrer equation: D = K λ/β cosθ. Accordingly, the Fe2O3/Fe3O4@CNC composite revealed an estimate of 12.86 nm.
Figure 1. XRD diffractogram of bare coconut charcoal (CNC) and Fe2O3/Fe3O4@coconut charcoal composite.

3.1.2. Fourier transform infrared (FT-IR)
The FTIR characterization showed characteristic oxidized groups in coconut carbon such as hydroxyl (OH) and carboxyl (COOH) groups at 3431 cm−1; C = O at 1708cm−1 in addition to bands at 2974 and 1549 cm−1 due to aliphatic C–H and C = C bonds [Citation52] (Figure ). Bands from the Fe–O groups, of either hematite and magnetite moieties, were observed at 580 and 459 cm−1 [Citation53–55]. From outcomes of supplementary Figures S1–S3, we can confirm that NDMA was adsorbed on the surface of the aforementioned composite and it was completely and selectively desorbed without interference of drugs or excipients.
Figure 2. FTIR of CNC and Fe2O3/Fe3O4@CNC cartridge.

3.1.3. Brunauer–Emmett–Teller and Barrett–Joyner–Halenda model (BET-BJH)
The surface area and the corresponding BJH pore-size distribution for the Fe2O3/Fe3O4@CNC composite were calculated from the N2 adsorption–desorption isotherm (Figure A,B). The adsorption–desorption curve of Fe2O3/Fe3O4@CNC composite exhibits a typical type IV isotherm indicating its mesoporous structure. The surface area of the Fe2O3/Fe3O4@CNC composite is 79.4 m2 g−1 with a pore volume of 0.066 cc g−1 and a pore diameter of 1.95 nm. The results reflected that the different mesopores presented a relatively narrow distribution, between 20 and 75 nm.
Figure 3. N2 adsorption (□)/desorption (○) isotherms curves (A); pore size distribution determined by BJH model (B) of Fe2O3/Fe3O4@CNC composite.

3.1.4. Morphologies of Fe2O3/Fe3O4@CNC composite and elemental analysis
The morphology of Fe2O3/Fe3O4@CNC composite in high resolution and magnification were characterized by Field Emission Scanning Electron Microscopy (FE-SEM) at different magnifications as shown in Figure . It is evident from the images (Figure A,A*) The images show that the Fe2O3/Fe3O4@CNC composite has a various and irregular sizes with rough surface. The particles size of Fe2O3/Fe3O4@CNC composite from SEM images indicate the surface morphology of particles that are agglomerated structure with different shapes, leading to small spherical agglomeration of Fe2O3/Fe3O4 on the surface of charcoal [Citation56]. The Energy-dispersive X-ray spectroscopy (EDX) surfaces elemental composition (Figure B) confirmed the presence of C, O, and Fe in Fe2O3/Fe3O4@CNC composite, the atomic mass (%) of these elements are presented in Table b included in Figure . The EDX-ray analysis shows high carbon, and Fe contents, 49.42%, and 27.72%, respectively at Fe2O3/Fe3O4@CNC composite surface; this composition confirmed the formation of a magnetic-charcoal composite [Citation43].
Figure 4. SEM micrographs of Fe2O3/Fe3O4@CNC composite: magnification of 10000× (A), magnification of 100000× (A*) and elemental distribution by EDX (B, b).

3.2. GC-MS chromatographic method optimization
The acquisition was carried out with SIM mode to achieve lower detection limits and high selectivity of the detection of NDMA. Several columns were used to evaluate the separation efficiency, peak shape, and sensitivity, e.g. Rxi®-35Sil MS (30 m x 0.25 mm x 0.50 µm), TG-1701MS (30 m x 0.25 mm x 0.50 µm), TG-WAXMS (60 m x 0.32 mm x 0.50 µm), TG-5MS (60 m x 0.25 mm x 0.25 µm) and TG-1MS (60 m x 0.25 mm x 0.50 µm). Among them, the best chromatographic parameters were achieved using the TG-WAXMS column (60 m x 0.32 mm x 0.50 µm). Splitless mode was used and the temperature in the injection port was 230 °C. The best ions for the analysis were m/z 74 and 42 for NDMA, and m/z 80 and 46 for NDMA-d6 internal standard which correspond to the loss from the starting compounds. The optimized separation made it possible to carry out the detection of the analyte and its internal standard with a relatively low analysis time (<12 min), their retention times were 8.40 ± 0.20 min. The adequate peak shape NDMA in the existence of NDMA-d6 as an internal standard are illustrated in Figure , which confirms the chromatographic efficiency of the investigated method for the estimation of NDMA in pharmaceutical formulations.
Figure 5. GC-MS/SIM chromatogram of NDMA and NDMA-d6 in a standard solution.

3.3. Method validation
The new GC/MS method validation parameters were followed as per ICH guidelines [Citation48]. The linear range of the SIM analysis of NDMA was from 0.0075 to 376 µg kg−1 which corresponds to 0.00001 to 0.5 µg/mL (R2 > 0.9996). The instrumental accuracy and precision for NDMA in the assay of NDMA in standards are given in Table . Recoveries and relative standard deviation values ranged from 97.9 to 102.5% and 0.51 to 4.59%, respectively, when assessed at concentrations over 4 orders of magnitude. This demonstrates the suitability the proposed analysis with the developed GC-MS (SIM) method. Moreover, the standard spiking procedures were applied for the selected dosage forms (so called RE8, RS1, ME1 and NE1) using different concentration levels of NDMA as listed in Table . The percentage recoveries and precisions obtained for NDMA levels spiked in pharmaceuticals ranged from 97.59 to 102.51 and 0.144 to 2.06 respectively, evidencing the absence of interferences resulting from the extraction of the drug and their excipients, which resulted in the confirmation of the accuracy in the determination of NDMA.
Table 1. Instrumental accuracy and precision of the proposed method for the determination of NDMA.
Table 2. NDMA analysis results of pharmaceutical product samples.
The LOD and LOQ were 0.0048 µg kg−1 and 0.016 µg kg−1, respectively. The symmetry of NDMA peaks in standards and pharmaceuticals as shown in Figure and Figure indicates the required selectivity of the developed method. The new GC-MS method is very competitive in terms of sensitivity as illustrated in Table . Moreover, the novel method was performed efficaciously for NDMA detection in various pharmaceuticals of NIZ, RAN and MET.
Figure 6. Comparison of GC–MS/SIM chromatograms of NDMA in RAN, MET and NIZ representative pharmaceutical products analyzed by solvent extraction method including the Fe2O3/Fe3O4@CNC SPE.

Table 3. Comparison of the proposed method with some reported methods.
3.4. Optimization of the SPE method using developed Fe2O3/Fe3O4@CNC composite sorbent
In the present work and instead of precipitating drug substance or excipient, the novel cartridge material based on Fe2O3/Fe3O4@CNC composite sorbed the NDMA impurity in pharmaceuticals. In the new method, pharmaceuticals were dissolved in an appropriate solvent and directly passed through the cartridge without pretreatment except a centrifugation step. Different factors were tested for laboratory synthetic cartridge to improve its selectivity and efficiency e.g. amount of sorbent (0.1, 0.25, 0.5, 0.75, 1, 1.25, 1.5, 1.75 and 2 g), extraction solvent (water, methanol, acetonitrile, n-hexane, chloroform and dichloromethane), pH (2 to 12), and elution solvent (methanol, acetonitrile, n-hexane, chloroform and dichloromethane). The optimum extraction conditions were 1.5 g of Fe2O3/ Fe3O4@CNC composite as a sorbent; water and methanol as extraction solvents according to the pharmaceutical type; pH values ranged from 7 to 9; and dichloromethane as elution solvent. These parameters enhanced the selective adsorption efficiency of NDMA and resulted in the complete absence of the drug active component and excipients in the extracted fraction.
According to previous results, three sorption mechanisms were proposed for NDMA sorption onto the investigated adsorbent; (a) H-bond attractions between the O-H group in the adsorbent and NDMA containing moieties, (b) Van der Waals force between hydrophobic part in NDMA and graphite structure, (c) the hydrogen bonding in the hydrated moiety in haematite and/or magnetite with the O = N in NDMA [Citation57–61].
3.5. Application of the novel GC-MS method for the analysis of commercial pharmaceuticals
High sensitivity and selectivity of the new analytical method for the routine assay of NDMA impurities in pharmaceuticals is shown in Table where concentrations as low as 0.12 ng NDMA mL−1 could be quantified, and the quantification was possible in broad range of pharmaceuticals. Among 16 samples of RAN, seven samples only were completely safe i.e. NDMA concentrations were lower than the toxic threshold regardless of daily intake (0.096 µg/mL per day), while four RAN samples were completely above the acceptable limits of NDMA even at a single dose of the dosage form. Furthermore, five RAN samples contained NDMA concentrations above the acceptable limits if it is taken two-times or more a day. In addition, 4 out of 7 MET pharmaceuticals examined were completely safe, while 2 samples were not safe if it is taken as a single dose per day. Furthermore, one MET formulation in Saudi market was completely free from NDMA impurity. On the other hand, all NIZ samples contained NDMA amounts above acceptable threshold. Therefore, the decision of withdrawal of suspected pharmaceuticals e.g. RAN, MET, and NIZ from Egyptian and Saudi markets was absolutely correct for the safety of the patients.
3.6. Recommendations
Considering the results raised in Table , the upcoming recommendations can be concluded: (i) RAN pharmaceuticals (RE1, RE2, RE8, RS1, RS2, RS4, RS5), and MET pharmaceuticals (MS1, MS2, MS3, ME1) are completely safe for the consumers and redistribution of these products in both Egypt and Saudi market is strongly recommended after rechecking of the accuracy of this conclusion by independent official quality control laboratory. On the contrary, (ii) all investigated NIZ samples were harmful to human health even at a single dose. (iii) The high level of NDMA impurity in all checked pharmaceuticals of NIZ, ranged from 0.4914 ± 0.0118 to 0.6840 ± 0.0312 μg/one formulation, requires further investigation for discovering the origin of NDMA in these products that may arise from the NIZ synthesis process and/or bad storage conditions and/or instability of NIZ active ingredient in the normal storage conditions.
3.7 Future scopes for this study
The new validated, selective, and efficient GC-MS method could be useful for detecting NDMA in other pharmaceuticals e.g. valsartan, irbesartan, and losartan, and food samples e.g. barley malt, and bacon. Besides, the extraction method using the magnetic coconut carbon composite (Fe2O3/Fe3O4@CNC) could be adapted for the purification of raw materials of drugs from the toxic NDMA impurity in the industrial scope.
4. Conclusions
The application of the developed magnetic carbon composite (Fe2O3/Fe3O4@CNC composite) developed (The Brunauer, Emmett, and Teller (BET) surface area 79.4 m2g−1) lead to highly efficient sorption and isolation of NDMA from pharmaceuticals when using dichloromethane as eluting solvent. The selectivity offered by the extraction method prevented the presence of impurities that could lead to the generation of NDMA during the analysis (due to high temperatures in the subsequent GC analysis that were around 220 to 230°C) in the extract to be analyzed. Additionally, the developed GC-MS (SIM) for the estimation of NDAM and its quantification with isotopic dilution was fast (<12 min), sensitive (instrumental LOD 4.8 ng NDMA kg−1) and precise (<5% instrumental RSD %). The selectivity in the extraction and analysis lead to high accuracy in the analysis of NDMA in samples (98-102%). NDMA impurities were detected above the acceptable limits even at a single dose of some samples of RAN, MET and NIZ pharmaceuticals. Outcomes have revealed that the Ranitidine (RAN) pharmaceuticals from Egypt (RE) and Saudi Arabia (RS) (RE1, RE2, RE8, RS1, RS2, RS4, RS5), and Metformin (MET) pharmaceuticals (MS1, MS2, MS3, ME1) are completely safe for the consumers and redistribution of these products in both Egypt and Saudi market is strongly recommended after rechecking by independent official laboratory. On the contrary, all investigated Nizatidine (NIZ) samples were harmful for human health even at a single dose. The high level of NDMA impurity in all checked pharmaceuticals of NIZ requires further investigation for discovering the origin of NDMA in these products. The application of the novel magnetic carbon composite enables an efficient sorption and analysis of NDMA using the GC-MS instrument in pharmaceuticals with the desired selectivity as the generation of NDMA from drug raw material was prohibited due to high temperatures in the GC instrument. Additionally, the new GC-MS method is very competitive in terms of sensitivity.
Supplemental Material
Download MS Word (512.8 KB)Acknowledgements
This work was funded by the Deanship of Scientific Research at Jouf University under grant No (DSR-2021-03-0343).
Disclosure statement
No potential conflict of interest was reported by the author(s).
Data availability statement
The datasets generated during and/or analyzed during the current study are available from the corresponding author on reasonable request.
References
- https://www.fda.gov/media/137644/download, (n.d.).
- https://www.who.int/medicines/publications/drugalerts/InformationNote_Nitrosamine-impurities/en/, (n.d.).
- Hu R, Zhang L, Yang Z. Picogram determination of N-nitrosodimethylamine in water. Water Sci Technol. 2008;58:143–151. doi:10.2166/wst.2008.644
- Topuz E, Aydin E, Pehlivanoglu-Mantas E. A practical LC-MS/MS method for the detection of NDMA at nanogram per liter concentrations in multiple water matrices. Water Air Soil Pollut. 2012;223:5793–5802. doi:10.1007/s11270-012-1315-1
- Sieira BJ, Carpinteiro I, Rodil R, et al. Determination of N-nitrosamines by gas chromatography coupled to quadrupole–time-of-flight mass spectrometry in water samples. Separations. 2020;7:3. doi:10.3390/separations7010003
- Chen W, Li X, Huang H, et al. Comparison of gas chromatography-mass spectrometry and gas chromatography-tandem mass spectrometry with electron ionization for determination of N-nitrosamines in environmental water. Chemosphere. 2017;168:1400–1410. doi:10.1016/j.chemosphere.2016.11.109
- Sen NP, Baddoo PA, Weber D, et al. A sensitive and specific method for the determination of N-nitrosodimethylamine in drinking water and fruit drinks. Int J Environ Anal Chem. 1994;56:149–163. doi:10.1080/03067319408039802
- Jurado-Sánchez B, Ballesteros E, Gallego M. Gas chromatographic determination of N-nitrosamines in beverages following automatic solid-phase extraction. J Agric Food Chem. 2007;55:9758–9763. doi:10.1021/jf071437u
- Jurado-Sánchez B, Ballesteros E, Gallego M. Gas chromatographic determination of N-nitrosamines, aromatic amines, and melamine in milk and dairy products using an automatic solid-phase extraction system. J Agric Food Chem. 2011;59:7519–7526. doi:10.1021/jf2013919
- Takatsuki K, Kikuchi T. Determination of N-nitrosodimethylamine in fish products using gas chromatography with nitrogen—phosphorus detection. J Chromatogr A. 1990;508:357–362. doi:10.1016/S0021-9673(00)91278-0
- Al-Kaseem M, Al-Assaf Z, Karabeet F. Development and validation of GC-FID method for the determination of volatile N-nitrosamines in meat. Int J Pharm Sci Rev Res. 2014;25:59–64.
- Brunnemann KD, Hoffmann D. Analysis of volatile nitrosamines in tobacco smoke and polluted indoor environments. Chemical studies on tobacco smoke LIX. IARC Sci Publ. 1978;19:343–356.
- https://www.fda.gov/drugs/drug-safety-and-availability/fda-updates-and-press-announcements-angiotensin-ii-receptor-blocker-arb-recalls-valsartan-losartan, (n.d.).
- Parr MK, Joseph JF. NDMA impurity in valsartan and other pharmaceutical products: analytical methods for the determination of N-nitrosamines. J Pharm Biomed Anal. 2019;164:536–549. doi:10.1016/j.jpba.2018.11.010
- Masada S, Tsuji G, Arai R, et al. Rapid and efficient high-performance liquid chromatography analysis of N-nitrosodimethylamine impurity in valsartan drug substance and its products. Sci Rep. 2019;9:1–6. doi:10.1038/s41598-019-48344-5
- https://www.fda.gov/news-events/press-announcements/statement-new-testing-results-including-low-levels-impurities-ranitidine-drugs, (n.d.).
- https://old.sfda.gov.sa/en/drug/news/pages/d17-9-2019a1.aspx, (n.d.).
- Munro JS, Walker TA. Ranitidine hydrochloride: development of an isocratic stability-indicating high-performance liquid chromatographic separation. J Chromatogr A. 2001;914:13–21. doi:10.1016/S0021-9673(01)00540-4
- https://www.fda.gov/drugs/drug-safety-and-availability/fda-updates-and-press-announcements-ndma-metformin, (n.d.).
- Chhetri HP, Thapa P, Van Schepdael A. Simple HPLC-UV method for the quantification of metformin in human plasma with one step protein precipitation. Saudi Pharm J. 2014;22:483–487. doi:10.1016/j.jsps.2013.12.011
- Belal TS, Abdel-Hay MH, Sabry SM, et al. HPLC-DAD stability indicating determination of nizatidine in bulk and capsules dosage form. Bull Facul Pharm Cairo Univ. 2013;51:185–191. doi:10.1016/j.bfopcu.2013.05.001
- Lim H-H, Oh Y-S, Shin H-S. Determination of N-nitrosodimethylamine and N-nitrosomethylethylamine in drug substances and products of sartans, metformin and ranitidine by precipitation and solid phase extraction and gas chromatography–tandem mass spectrometry. J Pharm Biomed Anal. 2020;189:113460. doi:10.1016/j.jpba.2020.113460
- Alshehri YM, Alghamdi TS, Aldawsari FS. HS-SPME-GC-MS as an alternative method for NDMA analysis in ranitidine products. J Pharm Biomed Anal. 2020;191:113582. doi:10.1016/j.jpba.2020.113582
- T.G.E.O. Network, DI-GC-MS (https://www.edqm.eu/sites/default/files/31 pv 163 nitrosamine in sartans en draft swissmedic v2.pdf), (Accessed April. 10, 2020). (n.d.).
- U.S. FDA, Combined direct injection N-nitrosodimethylamine (NDMA) andN-nitrosodiethylamine (NDEA) impurity assay by GC/MS, (2018) https://www.fda.gov/downloads/Drugs/DrugSafety/UCM.
- S.H.S. Authority, Determination of n-nitrosodimethylamine (NDMA) in Metformin products by HRAM-GCMS, (2019) https://www.hsa.gov.sg/.
- U.S. FDA, GC/MS headspace method for detection of NDMA in Valsartan DrugSubstance, (2019) https://www.fda.gov/downloads/Drugs/DrugSafety/UCM.
- T.G.E.O. Network, HS GC-MS method for the determination of NDMA and NDEA in Sartan, (n.d.) https://www.edqm.eu/sites/default/files/medias/fic.
- Combined direct injection method: a GC-MS/MS method that allows for determination of both NDMA and NDEA simultaneously https://www.fda.gov/media/123409/download), OTR Has Been Asked to Develop a Gas Chromatography-Tandem Mass Spectrometry (GC-MS/MS) Method Utilizing liquid Injection to Look for All These Nitrosamine Impurities, Accessed April.10, 2020. (n.d.).
- H. Canada, Determination of N-Nitrosodimethylamine (NDMA) and N-Nitrosodiethylamine (NDEA) by GC-MS-MS (Direct Injection) in Sartan Finished Products and Drug Substances, https://www.canada.ca/en/health-canada/services/drugs-health-products/compliance-enforcement/in, (n.d.).
- T.G.E.O. Network, LC-MS/MS Method for the determination of NDEA and NDMA in Valsartan, Irbesartan and Losartan APIs and finished dosage form. (https://www.edqm.eu/sites/default/files/medias/fichiers/Sartans/de-by-lc-ms ls.pdf) (accessed April. 10, 2020)., (n.d.).
- Sörgel F, Kinzig M, Abdel-Tawab M, et al. The contamination of valsartan and other sartans, part 1: New findings. J Pharm Biomed Anal. 2019;172:395–405. doi:10.1016/j.jpba.2019.05.022
- USFDA, RapidFire-MS/MS method, a method that can detect NEIPA, NDIPA, NDBA, and NMBA, https://www.fda.gov/media/125477/download (accessed April. 10, 2020, (n.d.).
- USFDA, LC-HRMS method, a method that can detect NDMA, NDEA, NEIPA, NDIPA, NDBA, and NMBA, https://www.fda.gov/media/125478/download (accessed April. 10, 2020), (n.d.).
- USFDA, Liquid chromatography-high resolution mass spectrometry(LC-HRMS) method for the determination of NDMA in ranitidine drug substance and drug product, https://www.fda.gov/media/130801/download(accessed April. 10, 2020), (n.d.).
- USFDA, Liquid chromatography-high resolution mass spectrometry(LC-HRMS) method for the determination of NDMA in metformin drug substance and drug product, https://www.fda.gov/media/134914/download(accessed April. 10, 2020), (n.d.).
- Farhadi B, Ebrahimi M, Morsali A. Pre-concentration and sensitive determination of propranolol and metoprolol using dispersive solid-phase microextraction and high-performance liquid chromatography in biological, wastewater, and pharmaceutical samples. Chem Methodol. 2022;6:750–761. doi:10.22034/chemm.2022.317197.1401
- Hajizadeh F, Amiri A, Maleki B, et al. Fe3O4@ SiO2@ PAMAM-G2 nanocomposite as sorbent for the extraction and preconcentration of estradiol valerate drug from human plasma samples. Microchem J. 2022;175:107176. doi:10.1016/j.microc.2022.107176
- Ghani M, Zayeri Z, Maleki B. Glutathione-stabilized Fe3O4 nanoparticles as the sorbent for magnetic solid-phase extraction of diazepam and sertraline from urine samples through quantitation via high-performance liquid chromatography. J Sep Sci. 2021;44:1195–1202. doi:10.1002/jssc.202000938
- Laffafchi F, Tajbakhsh M, Sarrafi Y, et al. Creatine@ SiO2@ Fe3O4 nanocomposite as an efficient sorbent for magnetic solid-phase extraction of escitalopram and chlordiazepoxide from urine samples through quantitation via HPLC–UV. J Sep Sci. 2022;45:3005–3013. doi:10.1002/jssc.202200305
- Yeganeh-Salman E, Alinezhad H, Amiri A, et al. Poly Schiff-base based on polyimides functionalized with magnetic nanoparticles as novel sorbent for magnetic solid-phase extraction of non-steroidal anti-inflammatory drugs in environmental water samples. Microchem J. 2022;183:108000. doi:10.1016/j.microc.2022.108000
- Ghani M, Jafari Z, Maleki B, et al. Magnetic solid-phase extraction of warfarin and gemfibrozil in biological samples using polydopamine-coated magnetic nanoparticles via core-shell nanostructure. J Sep Sci. 2023;46:2200745. doi:10.1002/jssc.202200745
- Kahsay MH, Belachew N, Tadesse A, et al. Magnetite nanoparticle decorated reduced graphene oxide for adsorptive removal of crystal violet and antifungal activities. RSC Adv. 2020;10:34916–34927. doi:10.1039/D0RA07061K
- Jafari Z, Ghani M. Magnetic carbonized cellulose-MIL 101 (Fe) composite as a sorbent for magnetic solid phase extraction of selected organophosphorus pesticides combined with high performance liquid chromatography-ultraviolet detection. Talanta Open. 2023;7:100212. doi:10.1016/j.talo.2023.100212
- Ghani M, Maleki B, Jafari Z, et al. Polymethyldopamin@ Fe3O4 for magnetic solid phase extraction of polycyclic aromatic hydrocarbons combined with DES as desorption solvent and high-performance liquid chromatography-ultraviolet detection. Polycycl Aromat Compd. 2023: 1–13. doi:10.1080/10406638.2023.2216835
- Wang Q, Chen L, Cui X, et al. Determination of trace bisphenols in milk based on Fe3O4@ NH2-MIL-88 (Fe)@ TpPa magnetic solid-phase extraction coupled with HPLC. Talanta. 2023;256:124268. doi:10.1016/j.talanta.2023.124268
- Liu J, Su Z, Xu Q, et al. Facile synthesis of boric acid-functionalized magnetic covalent organic frameworks and application to magnetic solid-phase extraction of trace endocrine disrupting compounds from meat samples. Food Chem. 2023;399:133843. doi:10.1016/j.foodchem.2022.133843
- IFPMA, Validation of analytical procedures: text and methodology, in: International Conference on Harmonization, Geneva, Switzerland, 2005: pp. 1–13.
- Juang R-S, Yei Y-C, Liao C-S, et al. Synthesis of magnetic Fe3O4/activated carbon nanocomposites with high surface area as recoverable adsorbents. J Taiwan Inst Chem Eng. 2018;90:51–60. doi:10.1016/j.jtice.2017.12.005
- Chen F, Liu R, Xiao S, et al. Solvothermal synthesis in ethylene glycol and adsorption property of magnetic Fe3O4 microspheres. Mater Res Bull. 2014;55:38–42. doi:10.1016/j.materresbull.2014.03.034
- El Mendili Y, Bardeau J-F, Randrianantoandro N, et al. Structural behavior of laser-irradiated γ-Fe2O3 nanocrystals dispersed in porous silica matrix: γ-Fe2O3 to α-Fe2O3 phase transition and formation of ϵ-Fe2O3. Sci Technol Adv Mater. 2016;17:597–609. doi:10.1080/14686996.2016.1222494
- Martini T, Astuti F, Maharditya W. Test the Effectiveness and Characterization of Quartz Sand/Coconut Shell Charcoal Composite as Adsorbent of Manganese Heavy Metal. In: IOP Conf Ser Mater Sci Eng, IOP Publishing, 2020: p. 12041.
- Liu H, Li P, Lu B, et al. Transformation of ferrihydrite in the presence or absence of trace Fe (II): the effect of preparation procedures of ferrihydrite. J Solid State Chem. 2009;182:1767–1771. doi:10.1016/j.jssc.2009.03.030
- Lassoued A, Dkhil B, Gadri A, et al. Control of the shape and size of iron oxide (α-Fe2O3) nanoparticles synthesized through the chemical precipitation method. Res Phys. 2017;7:3007–3015. doi:10.1016/j.rinp.2017.07.066
- Si J-C, Xing Y, Peng M-L, et al. Solvothermal synthesis of tunable iron oxide nanorods and their transfer from organic phase to water phase. Cryst Eng Comm. 2014;16:512–516. doi:10.1039/C3CE41544A
- Hajighasemkhan A, Taghavi L, Moniri E, et al. Adsorption kinetics and isotherms study of 2, 4-dichlorophenoxyacetic acid by 3dimensional/graphene oxide/magnetic from aquatic solutions. Int J Environ Anal Chem. 2022;102:1171–1191. doi:10.1080/03067319.2020.1734194
- Chen C, Zhou W, Lin D. Sorption characteristics of N-nitrosodimethylamine onto biochar from aqueous solution. Bioresour Technol. 2015;179:359–366. doi:10.1016/j.biortech.2014.12.059
- Torabi E, Mirzaei M, Bazargan M, et al. A critical review of covalent organic frameworks-based sorbents in extraction methods. Anal Chim Acta. 2022;1224:340207. doi:10.1016/j.aca.2022.340207
- Bazargan M, Ghaemi F, Amiri A, et al. Metal–organic framework-based sorbents in analytical sample preparation. Coord Chem Rev. 2021;445:214107. doi:10.1016/j.ccr.2021.214107
- Torabi E, Moghadasi M, Mirzaei M, et al. Nanofiber-based sorbents: current status and applications in extraction methods. J Chromatogr A. 2022;1689:463739.
- Ghani M, Jafari Z, Raoof JB. Porous agarose/chitosan/graphene oxide composite coupled with deep eutectic solvent for thin film microextraction of chlorophenols. J Chromatogr A. 2023;1694:463899. doi:10.1016/j.chroma.2023.463899