
 ?Mathematical formulae have been encoded as MathML and are displayed in this HTML version using MathJax in order to improve their display. Uncheck the box to turn MathJax off. This feature requires Javascript. Click on a formula to zoom.
ABSTRACT
Using the historical simulations from 27 models in phase 5 of the Coupled Model Intercomparison Project (CMIP5) and 27 models in phase 6 (CMIP6), the authors evaluated the differences between CMIP5 and CMIP6 models in simulating the climate mean of extreme temperature over China through comparison with observations during 1979–2005. The CMIP6 models reproduce well the spatial distribution of annual maxima of daily maximum temperature (TXx), annual minima of daily minimum temperature (TNn), and frost days (FD). The model spread in CMIP6 is reduced relative to CMIP5 for some temperature indices, such as TXx, warm spell duration index (WSDI), and warm days (TX90p). The multimodel median ensembles also capture the observed trend of extreme temperature. However, the CMIP6 models still have low skill in capturing TX90p and cold nights (TN10p) and have obvious cold biases or warm biases over the Tibetan Plateau. The ability of individual models varies for different indices, although some models outperform the others in terms of the average of all indices considered for different models. By comparing different version models from the same organization, the updated CMIP6 models show no significant difference from their counterparts from CMIP5 for some models. Compared with individual models, the median ensembles show better agreement with the observations for temperature indices and their means.
Graphical abstract
摘要
本文评估了CMIP5和CMIP6模式对中国在1979–2005年期间的极端温度的模拟性能。结果表明:CMIP6模式可以很好地再现年最大日最高气温,年最小日最低气温和霜冻日数的空间分布特征。对于年最大日最高气温,持续暖日日数和暖昼,CMIP6模式间的不确定性相对于CMIP5模式有所降低。并且,CMIP6模式也能表现出观测到的极端温度的趋势。然而,CMIP6模式再现暖昼和冷夜的能力仍然不足,特别是在青藏高原上存在明显的冷偏差或者暖偏差对于某些指数。单个CMIP6或CMIP5模式的模拟能力就不同的指数而有所不同,某些模式的模拟能力较为突出。对于一些来自同一机构不同版本的模式,改进的CMIP6模式与CMIP5模式的模拟结果没有明显差异。多模式中位数平均的模拟效果优于大多数单个模式。
1. Introduction
Temperature extremes associated with global warming are of great concern because our society is susceptible to both the intensity and frequency of extreme temperature. The extreme temperature has been widely reported in China (Hou et al. Citation2014; Chen and Sun Citation2014; Ren et al. Citation2020). In general, changes in extreme temperature and their influence on our society differ with the region and the category of extremes (IPCC Citation2012). Therefore, the assessment of extreme events is important.
The Coupled Model Intercomparison Project (CMIP) provides simulations of past, present, and future climate. The purpose of CMIP is to investigate and improve climate model diagnosis, intercomparison, data access, etc. Extensive research to evaluate model simulations of extreme temperature started with the release of phase 5 of CMIP (CMIP5) models (Guo et al. Citation2013; Sillmann et al. Citation2013a, Citation2013b; Zhou et al. Citation2014; Wang et al. Citation2020). Chen and Sun (Citation2015) revealed that for some extreme temperature indices, the model spread in CMIP5 is reduced compared with CMIP3. Dong et al. (Citation2015) indicated that the observed spatial pattern of extreme temperature is generally captured by CMIP5 models, but there are some wide disagreements about differences between models and observations for the duration and frequency indices in some areas. Though some new components (Taylor, Stouffer, and Meehl Citation2012) have been added to several models in CMIP5, the coarse resolution of the models fails to provide the regional-scale information necessary for regional impact assessment. Climate models are incapable of simulating well extreme events occurring on a small spatial scale (Kong et al. Citation2019). Recently, some modeling groups have released their new CMIP6 simulations (Eyring et al. Citation2016; O’Neill et al. Citation2016). However, few studies have compared models from CMIP5 and CMIP6 in simulating temperature extremes in China. This is what we intend to address in this study. We focus on the performance of CMIP5 and CMIP6 models, and aim to answer two questions: What are the differences from CMIP5 to CMIP6 models in simulating temperature extremes in China? Which models perform better in this regard?
The paper is organized as follows. Section 2 describes the data and the temperature indices, as well as the methods. Model simulation of present-day extreme temperature over China is presented in section 3. The final section provides conclusions.
2. Data and methods
2.1. Model output and observations
Simulated daily minimum and maximum temperature (TN and TX, respectively) outputs were retrieved through data portals of the Earth System Grid Federation (https://esgf-node.llnl.gov/projects/esgf-llnl/) using 27 CMIP6 (Table S1) and 27 CMIP5 (Table S2) models. Only the historical experiments were employed.
The CN05.1 0.25° × 0.25° daily temperature dataset (Wu and Gao Citation2013) was used as observations. Additionally, the daily minimum and maximum temperatures from three reanalyses were also used: NCEP-1, NCEP-2, and ERA5 (Kalnay et al. Citation1996; Kanamitsu et al. Citation2002; Hersbach et al. Citation2020).
2.2. Temperature indices and methods
Extreme temperature indices have been defined in previous studies (Frich et al. Citation2002; Sillmann et al. Citation2013a). Here, we selected eight temperature indices (). These indices include absolute indices (TXx and TNn), fixed threshold indices (ID, FD, TX90p, and TN10p), and duration indices (WSDI and CSDI). Together, these indices generally cover all aspects of temperature extremes.
Table 1. Definitions of extreme temperature indices used in this study (TX and TN indicate daily maximum temperature and daily minimum temperature, respectively)
This study uses data for 1979–2005 from models, observation, and reanalyses. Percentile indices for the observations and models were calculated relative to the period 1961–90 (except for NCEP-2 and ERA5, which cover a short time period, and are instead computed during the period of 1979–2008). Differences from using different reference periods to calculate percentile indices are relatively small. A similar method can be found in Chen and Sun (Citation2015). To further evaluate the overall skill in simulating these indices, an exploratory model climate performance index (MCPI) and an exploratory model variability index (MVI) were used. To calculate MCPI, first, the median of the model is obtained by computing the multimodel median of individual indices and then relative errors are determined. The MVI is defined as:
where m is a given model, r is the reference data, is the ratio between simulated and observed variance, and F is the overall number of variables. More detailed information on the use of MCPI and MVI may be found in Gleckler, Taylor, and Doutriaux (Citation2008).
We also selected the Taylor skill score (TS) to assess model skill; the TS is defined according to Wang et al. (Citation2018) as:
where R is the spatial correlation coefficient between the model and observation, and is the maximum correlation coefficient attainable (here, we use 0.999). Parameters
and
are the standard deviations of the simulated and observed patterns, respectively. The score is 1 for a perfect match between observation and model, and 0 for no match at all.
To facilitate intercomparison, all indices were interpolated onto a 1.25° × 1.25° grid using bilinear interpolation.
3. Results
3.1. Spatial pattern of temperature extremes
First, the spatial distribution of the annual mean from CN05.1 and the annual mean biases (departure of CMIP6 and CMIP5 multimodel median ensembles from CN05.1) of four temperature indices (TXx, TNn, ID, and FD) during 1979–2005 over China are shown in . The observed TXx decreases from south to north in eastern China, and the line of maximum descent of TXx is from Southeast to Northwest China ()). The temperature gradients are also reasonably captured by the CMIP6 and CMIP5 multimodel medians (Figure S1(b,c)) but some biases are evident for the TXx relative to the observations (,c)). The TXx is underestimated over parts of the Tibetan Plateau (TP) and Northeast China but overestimated over parts of Xinjiang. Compared with CMIP5 models, these biases are reduced to some extent in CMIP6 models, especially over the TP (Figure S2(a)). The observed TNn ()) is characterized by north–south gradients. The TNn for CMIP5 models displays substantially negative biases over parts of the TP, the Sichuan Basin, and South China, but exceeds its observed values over the north of Northeast China and parts of Xinjiang. These biases are also found in CMIP6 models, but with obviously smaller magnitude (Figure S2(b)). For example, compared with CIMP5, the negative bias over the TP is reduced by 38% in CMIP6. The average bias of TNn over China is −0.91°C from CMIP6 and −1.56°C from CMIP5. Overall, TXx and TNn have relatively obvious cold biases over the TP in both CMIP5 and CMIP6 models. This may be connected with the complex terrain in the TP (Flato et al. Citation2013), with the coarse resolutions of the climate models leading to difficulties in the model simulation that amplify the errors in this region compared with other regions.
Figure 1. Mean of observed TXx, TNn, ID, and FD indices (left column; see for definitions) during 1979–2005. Middle and right columns display biases of CMIP5 and CMIP6 multimodel median ensembles when compared with observations. Units of TXx and TNn are °C; ID and FD are days

The observed patterns of ID ()) and FD ()) show small values in some regions, such as in South China, while there are large values in the TP and Northeast China. The features of ID in China may be due to the strong moisture transport, Asian low, and so on (Wang et al. Citation2014). Regarding FD, water vapor cannot be ignored (Liu, Henderson, and Xu Citation2008). CMIP5 and CMIP6 models show a positive bias in ID over most parts of the northern China region, especially clearly in the TP (Figure S2(c)), with smaller magnitude in CMIP6 models than in CMIP5 models. The bias over parts of Northwest China is reduced by 18% in CMIP6 relative to CMIP5. The area-weighted mean ID bias over China is 25.42 days from CMIP6 and 27.47 days from CMIP5. For FD, CMIP6 models produce smaller systematic biases than CMIP5 models over parts of the TP and the Sichuan Basin (Figure S2(d)). The average bias over China is 8.45 days from CMIP6 and 12.27 days from CMIP5. In summary, CMIP6 models perform better in spatial distributions for the four indices TXx, TNn, ID, and FD.
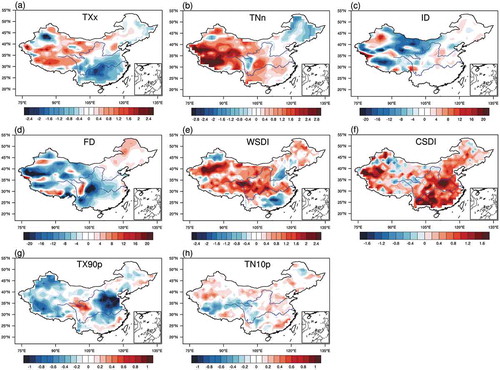
In general, using percentile indices to assess model skill is difficult due to the threshold exceedance rate in the given period, which is nearly consistent for models, observations, and reanalyses (Sillmann et al. Citation2014). The WSDI shows large values ()) over parts of the TP and Northwest China, and small values over parts of northern China and the Huanghuai area. CMIP5 and CMIP6 models simulate similar patterns of WSDI ()), with negative biases over Northwest China, Northeast China, and so on, where CMIP6 models have smaller biases than CMIP5 models (Figure S2(e)). For instance, the bias over Northwest China is reduced by 13% in CMIP6 when compared with CMIP5. The average bias over the whole of China is −2.33 days from CMIP6 and −2.8 days from CMIP5. The observed CSDI has large values ()) in South China and parts of Xinjiang, but mainly small values in the TP, Sichuan Basin, and North China. CMIP5 models ()) underestimate values over most regions of China, while CMIP6 models ()) overestimate CSDI over parts of North China, parts of South China, and parts of Xinjiang. The bias of CMIP6 models over parts of the middle and lower Yangtze River is obviously lower than that of CMIP5 models, with the bias reduced by 52% (Figure S2(f)). The average bias over China is −0.04 days from CMIP6 and −0.55 days from CMIP5. –, ) show a regional discrepancy in TX90p and a consistent overestimation of TN10p for CMIP5 and CMIP6 models in China. For TX90p, positive biases are found over parts of Southwest China, Xinjiang, Huanghuai area, Jianghuai area, and South China. CMIP6 models have notably smaller biases than CMIP5 models for TX90p over some regions (Figure S2(g)), such as South China, the north of Sichuan Province, and the Huanghuai area, while both sets of models show comparable biases in magnitude for TN10p (Figure S2(h)), with an average bias of 1.7 days over China from CMIP6 and 1.67 days from CMIP5.
Figure 2. Mean of observed WSDI, CSDI, TX90p, and TN10p indices (left column; see Table 1 for definitions) during 1979–2005. Middle and right columns display biases of CMIP5 and CMIP6 multimodel median ensembles when compared with observations. Units of WSDI and CSDI are days; TX90p and TN10p are %

The Taylor diagram (Taylor Citation2001) in Figure S3 shows that CMIP6 multimodel medians perform better than CMIP5 multimodel medians. It is also clear that the median ensemble is generally more skillful than the individual models for extreme temperature indices. From the results for TS (Figure S4), CMIP6 models show some improvements in CMIP5 models for temperature indices. Both CMIP5 and CMIP6 models show high skills for TXx, TNn, and FD, with TS above 0.9. Note that, for TX90p and TN10p, all models (CMIP6 and CMIP5) display obviously low skills, with TS below 0.3. In addition, the box and whisker plots (Figure S5) indicate that the root-mean-square errors (RMSEs) of the multimodel medians of CMIP6 are generally smaller than those of CMIP5 for most temperature indices. The uncertainties in CMIP6 are reduced for some indices as indicated by the interquartile model ranges. We also note that the magnitude of RMSEs of indices for reanalyses is comparable to the values of CMIP5 and CMIP6 models. However, the spread for the three reanalyses is similar to, or even larger than, that in the models. Therefore, caution should be exercised when using these reanalyses for assessing models.
3.2. Temporal characteristics of extreme temperature indices
The temporal variations of indices over China for the observations, reanalyses, and models are displayed in for 1979–2005. We note that the multimodel medians in both CMIP5 and CMIP6 have approximately the same magnitude. There are clear differences in the temporal characteristics of indices between models and observations for China. Compared with the observations, the multimodel median ensembles show smaller values for TXx and TNn (–d)), but larger values for ID and FD.
Figure 3. Spatial means of extreme temperature indices over China from 1979 to 2005 based on multimodel median ensembles of CMIP5 and CMIP6 models. Shading indicates the interquartile model range (between the 25th and 75th quartiles). Light pink indicates the CMIP6 multimodel ensemble and light blue indicates the CMIP5 multimodel ensemble. The observations from 1979 to 2005 are shown in black. Also shown are the reanalyses from 1979 to 2005: ERA5, NCEP-1, and NCEP-2. Units of TXx and TNn are °C; ID, FD, WSDI, and CSDI are days; TX90p and TN10p are %

The trends of indices for reanalyses and models are qualitatively similar to the observations, but differences remain (–d)). The reanalyses display some differences that are equal to, or larger than, the interquartile model spread. This result is similar to a previous study (Sillmann et al. Citation2013a). We also note that CMIP5 and CMIP6 models show better consistency with ERA5 than with NCEP-1 and NCEP-2 for some indices, such as TXx and TNn.
The temporal characteristics of the percentile indices (–h)) are clearly consistent with those of the indices TXx, TNn, ID, and FD for observations, reanalyses, and models. WSDI and TX90p show an increase, while CSDI and TN10p exhibit a decrease in models and reanalyses, consistent with the observations. Overall, the cold temperature indices decrease with time and the warm temperature indices increase with time. CMIP5 and CMIP6 models also show high intermodel agreement (Figure S6). Similar results can also be found in a previous study (Zhou et al. Citation2016).
3.3. Relative model skills
The abilities of models in simulating the eight temperature indices vary from one model to another (Figure S7(a) summarizes the relative errors of each model in simulating the temperature indices in the form of a ‘portrait’ diagram). No models perform well relative to the observations for all indices. For instance, the model NorESM2-MM outperforms other typical models for most indices, but has a large relative error in TX90p. Some CMIP5 models reveal large biases for most temperature indices, such as INMCM4. Additionally, consistent with the results of a previous multimodel study (Sillmann et al. Citation2013a), the median ensembles of the two CMIP sets of models generally outperform individual models, due to offsetting of the systematic errors of individual models in the multimodel median ensembles. CMIP6 median ensembles show a better agreement with the observations than CMIP5 median ensembles for most temperature indices. A comparison between a subset of 13 CMIP6 models and their 12 CMIP5 predecessors was also conducted (Figure S8). We found that most of the 13 affiliated CMIP6 simulations show no obvious difference from their CMIP5 counterparts for climate simulations.
The top 20 models that present a relatively smaller MVI consist of almost equal numbers of CMIP6 models and CMIP5 models (Figure S7(b)). CESM1(BGC) and CCSM4 perform best among all models (both CMIP5 and CMIP6). Compared with CMIP5 models, their corresponding updated versions in CMIP6 (such as IPSL-CM6A-LR corresponds to IPSL-CM5A-LR, UKESM1-0-LL correspond to HadGEM2-ES, GFDL-ESM4 corresponds to GFDL-ESM2G and GFDL-ESM2M) show no obvious improvement in simulating interannual variability. Some updated models display poorer performance than the old models. For example, CanESM5 performs worse than CanESM2.
4. Conclusions
In this study, we have analyzed the performance of CMIP5 and CMIP6 models in reproducing extreme temperature over China by comparing the results with observations and three reanalyses. The main results may be summarized as follows.
The trends and spatial features of the temperature indices over China are reproduced reasonably well by the CMIP6 multimodel median ensembles. However, there are some discrepancies for models relative to the observations. For instance, there is a cold bias of TXx and TNn apparent over the TP, while positive biases of ID are found over most areas in China. Nevertheless, the observed decreases in ID and FD are captured well by the models. Increases are simulated for TXx and TNn, in agreement with the observations. These good skills are also found in percentile indices. Similar results are obtained with the CMIP5 simulations, but CMIP6 models outperform CMIP5 models for most temperature indices.
The median ensembles in both CMIP5 and CMIP6 models appear to perform better than individual models. However, intermodel uncertainties in spatial and temporal variations have comparable magnitude between CMIP6 and CMIP5.
Three reanalysis datasets show relatively good agreement with the observations, although there are obvious discrepancies. The difference between reanalyses is larger than, or similar to, the interquartile model spread of CMIP5 and CMIP6 models for some indices. Therefore, caution should be exercised when using these reanalysis datasets for model evaluations at the regional scale.
The performance of individual models was measured using the MCPI and MVI for extreme temperature indices. We found that the updated CMIP6 models show no significant difference from their counterparts from CMIP5.
Note that we have not analyzed the physical processes. Extreme temperature can be affected by land-use or land-cover changes (Avila et al. Citation2012). We have also not discussed the results of the projected changes of these indices over China for CMIP6 models. These aspects need to be studied further.
Supplemental Material
Download PDF (2.1 MB)Acknowledgments
We sincerely thank the three anonymous reviewers whose valuable suggestions helped us to improve our manuscript. We also thank Dr. Zhenyu Han and Dr. Xianghui Kong for advice.
Disclosure statement
No potential conflict of interest was reported by the authors.
Supplementary material
Supplemental data for this article can be accessed here.
Additional information
Funding
References
- Avila, F., A. J. Pitman, M. G. Donat, L. V. Alexander, and G. Abramowitz. 2012. “Climate Model Simulated Changes in Temperature Extremes Due to Land Cover Change.” Journal of Geophysical Research Atmospheres 117 (4): 1–19. doi:10.1029/2011JD016382.
- Chen, H. P., and J. Q. Sun. 2014. “Changes in Climate Extreme Events in China Associated with Warming.” International Journal of Climatology 35 (10): 2735–2751. doi:10.1002/joc.4168.
- Chen, H. P., and J. Q. Sun. 2015. “Assessing Model Performance of Climate Extremes in China: An Intercomparison between CMIP5 and CMIP3.” Climatic Change 129 (1–2): 197–211. doi:10.1007/s10584-014-1319-5.
- Dong, S. Y., Y. Xu, B. T. Zhou, and Y. Shi. 2015. “Assessment of Indices of Temperature Extremes Simulated by Multiple CMIP5 Models over China.” Advances in Atmospheric Sciences 32 (8): 1077–1091. doi:10.1007/s00376-015-4152-5.
- Eyring, V., S. Bony, G. A. Meehl, C. A. Senior, B. Stevens, R. J. Stouffer, and K. E. Taylor. 2016. “Overview of the Coupled Model Intercomparison Project Phase 6 (CMIP6) Experimental Design and Organisation.” Geoscientific Model Development Discussions 8 (12): 10539–10583. doi:10.5194/gmdd-8-10539-2015.
- Flato, G., J. Marotzke, B. J. Abiodun, P. Braconnot, S. C. Chou, W. J. Collins, P. M. Cox, et al. 2013. “Evaluation of Climate Models.” In: Climate Change 2013: The Physical Science Basis. Contribution of Working Group I to the Fifth Assessment Report of the Intergovernmental Panel on Climate Change. 741–866. https://doi.org/10.1017/CBO9781107415324.020.
- Frich, P., L. V. Alexander, P. M. Della-Marta, B. E. Gleason, M. R. Haylock, A. M. G. Klein Tank, and T. C. Peterson. 2002. “Observed Coherent Changes in Climatic Extremes during the Second Half of the Twentieth Century.” Climate Research 19 (3): 193–212. doi:10.3354/cr019193.
- Gleckler, P. J., K. E. Taylor, and C. M. Doutriaux. 2008. “Performance Metrics for Climate Models.” Journal of Geophysical Research Atmospheres 113 (6): 1–20. doi:10.1029/2007JD008972.
- Guo, Y., W. J. Dong, F. M. Ren, Z. C. Zhao, and J. B. Huang. 2013. “Assessment of CMIP5 Simulations for China Annual Average Surface Temperature and Its Comparison with CMIP3 Simulations.” Climate Change Research 9: 181–186. (in Chinese).
- Hersbach, H., B. D. Bell, P. Berrisford, S. Hirahara, A. Horányi, J. Muñoz-Sabater, J. P. Nicolas, et al. 2020. “The ERA5 Global Reanalysis.” Quarterly Journal of the Royal Meteorological Society, 146: 1999–2049. doi:10.1002/qj.3803.
- Hou, W., Y. Chen, Y. Li, Y. M. Wang, Z. Y. Wang, X. J. Zhu, B. Zhou et al. 2014. “Climatic Characteristics over China in 2013.” Meteorological Monthly 4: 482–493.
- IPCC (Intergovernmental Panel on Climate Change). 2012. “Changes in Climate Extremes and Their Impacts on the Natural Physical Environment.” In Managing the Risks of Extreme Events and Disasters to Advance Climate Change Adaptation. A Special Report of Working Groups I and II of the Intergovernmental Panel on Climate Change, edited by, C. B. Field, V. Barros, T. F. Stocker, D. H. Qin, D. J. Dokken, K. L. Ebi, M. D. Mastrandrea et al., 109–230. Cambridge:Cambridge University Press.
- Kalnay, E., M. Kanamitsu, R. Kistler, W. Collins, D. Deaven, L. Gandin, M. Iredell, et al. 1996. “The NCEP/NCAR 40-year Reanalysis Project”. Bulletin of the American Meteorological Society 77: 437–470. doi:10.1175/1520-0477(1996)077<0437:TNYRP>2.0.CO;2.
- Kanamitsu, M., W. Ebisuzaki, J. S. Woollen, S. K. Yang, J. J. Hnilo, M. Fiorino, and G. Potter. 2002. “NCEP-DOE AMIP-II Reanalysis (R-2).” Bulletin of the American Meteorological Society 83: 1631–1643. doi:10.1175/BAMS-83-11-1631.
- Kong, X. H., A. H. Wang, X. Q. Bi, and D. Wang. 2019. “Assessment of Temperature Extremes in China Using RegCM4 and WRF.” Advances in Atmospheric Sciences 36 (4): 363–377. doi:10.1007/s0037-6-018-8144-0.
- Liu, B. H., M. Henderson, and M. Xu. 2008. “Spatiotemporal Change in China’s Frost Days and Frost-free Season, 1955–2000.” Journal of Geophysical Research Atmospheres 113 (12): 1–15. doi:10.10-29/2007JD009259.
- O’Neill, B. C., C. Tebaldi, D. P. Van Vuuren, V. Eyring, P. Friedlingstein, G. C. Hurtt, R. Knutti, et al. 2016. “The Scenario Model Intercomparison Project (Scenariomip) for CMIP6.” Geoscientific Model Development 9 (9): 3461–3482. doi:10.5194/gmd-9-3461-2016.
- Ren, L. W., D. Q. Wang, N. An, S. Y. Ding, K. Yang, N. Freychet, S. F. B. Tett, B. W. Dong, and F. C. Lott. 2020. “Anthropogenic Influences on the Persistent Night-Time Heat Wave in Summer 2018 over Northeast China.” Bulletin of the American Meteorological Society 101 (1): S83–S88. doi:10.1175/BAMS-D-19-0152.1.
- Sillmann, J., V. Kharin, X. B. Zhang, F. W. Zwiers, and D. Bronaugh. 2013a. “Climate Extremes Indices in the CMIP5 Multimodel Ensemble: Part 1. Model Evaluation in the Present Climate.” Journal of Geophysical Research Atmospheres 118 (4): 1716–1733. doi:10.1002/jgrd.50203.
- Sillmann, J., V. V. Kharin, F. W. Zwiers, X. B. Zhang, D. Bronaugh, and M. G. Donat. 2014. “Evaluating Model-simulated Variability in Temperature Extremes Using Modified Percentile Indices.” International Journal of Climatology 34 (11): 3304–3311. doi:10.1002/joc.3899.
- Sillmann, J., V. V. Kharin., F. W. Zwiers, X. B. Zhang, and D. Bronaugh. 2013b. “Climate Extremes Indices in the CMIP5 Multimodel Ensemble: Part 2. Future Climate Projections.” Journal of Geophysical Research: Atmospheres 118 (6): 2473–2493. doi:10.1002/jgrd.50188.
- Taylor, K. E. 2001. “Summarizing Multiple Aspects of Model Performance in a Single Diagram.” Journal of Geophysical Research 106 (D7): 7183–7192. doi:10.1029/2000JD900719.
- Taylor, K. E., R. J. Stouffer, and G. A. Meehl. 2012. “An Overview of CMIP5 and the Experiment Design.” Bulletin of the American Meteorological Society 93 (4): 485–498. doi:10.1175/BAMS-D-11-00094.1.
- Wang, B., L. H. Zheng, D. L. Liu, F. Ji, A. Clark, and Q. Yu. 2018. “Using Multi-model Ensembles of CMIP5 Global Climate Models to Reproduce Observed Monthly Rainfall and Temperature with Machine Learning Methods in Australia.” International Journal of Climatology 38 (13): 4891–4902. doi:10.1002/joc.5705.
- Wang, J. X., Y. Chen, S. F. B. Tett, Z. W. Yan, P. M. Zhai, J. M. Feng, and J. J. Xia. 2020. “Anthropogenically-driven Increases in the Risks of Summertime Compound Hot Extremes.” Nature Communications 11 (1): 528. doi:10.1038/s41467-019-14233-8.
- Wang, Z. Y., S. Yang, Z. J. Ke, and X. W. Jiang. 2014. “Large-scale Atmospheric and Oceanic Conditions for Extensive and Persistent Icing Events in China.” Journal of Applied Meteorology and Climatology 53 (12): 2698–2709. doi:10.1175/JAMC-D-14-0062.1.
- Wu, J., and X. J. Gao. 2013. “A Gridded Daily Observation Dataset over China Region and Comparison with the Other Datasets.” Chinese Journal of Geophysics 56 (4): 1102–1111. doi:10.6038/cjg20130406.
- Zhou, B. T., Q. Z. Wen, Y. Xu, L. C. Song, and X. B. Zhang. 2014. “Projected Changes in Temperature and Precipitation Extremes in China by the CMIP5 Multimodel Ensembles.” Journal of Climate 27 (17): 6591–6611. doi:10.1175/JCLI-D-13-00761.1.
- Zhou, B. T., Y. Xu, J. Wu, S. Y. Dong, and Y. Shi. 2016. “Changes in Temperature and Precipitation Extreme Indices over China: Analysis of a High-resolution Grid Dataset.” International Journal of Climatology 36 (3): 1051–1066. doi:10.1002/joc.4400.