
ABSTRACT
This study explores the model performance of the Coupled Model Intercomparison Project Phase 6 (CMIP6) in simulating precipitation extremes over the mid–high latitudes of Asia, as compared with predecessor models in the previous phase, CMIP5. Results show that the multimodel ensemble median generally outperforms the individual models in simulating the climate means of precipitation extremes. The CMIP6 models possess a relatively higher capability in this respect than the CMIP5 models. However, discrepancies also exist between models and observation, insofar as most of the simulated indices are positively biased to varying degrees. With respect to the temporal performance of indices, the majority are overestimated at most time points, along with large uncertainty. Therefore, the capacity to simulate the interannual variability needs to be further improved. Furthermore, pairwise and multimodel ensemble comparisons were performed for 12 models to evaluate the performance of individual models, revealing that most of the new-version models are better than their predecessors, albeit with some variance in the metrics amongst models and indices.
GRAPHICAL ABSTRACT
摘要
本文基于亚洲中高纬地区逐日降水观测资料和CMIP6中12个全球模式资料, 采用泰勒图等方法, 系统评估CMIP6模式对该地区极端降水的模拟能力, 并与CMIP5结果进行对比。结果表明, 相较于CMIP5模式, CMIP6模式能够更好地模拟极端降水指数气候平均态以及趋势变化特征, 与观测相关系数更高。多模式集合平均在模拟极端降水方面普遍优于单个模式。为进一步评估单个模型的性能, 与CMIP5中的旧版本模式进行了两两比较。尽管针对不同的模式和评估指标结果存在一些差异, 但大多数新版本模式模拟极端降水能力较CMIP5有所增强。
1. Introduction
In recent decades, the frequency and intensity of climate extreme events (for instance, precipitation extremes, drought, floods, etc.) induced by global warming has increased significantly, exerting severe impacts on the development of society as well as ecosystems (Sun et al. Citation2019; Xu et al. Citation2019; Zhai, Zhou, and Chen Citation2018; Zhou et al. Citation2019). Hence, exploring climate extreme events and changes thereof is of paramount importance for climate change mitigation and decision-making.
Climate models represent one of the best tools available to simulate the characteristics of climate systems (Rivera and Arnould Citation2020; Li et al. Citation2018; Gao et al. Citation2018; Zhou et al. Citation2014; Giorgi and Gao Citation2018). In particular, the models of the Coupled Model Intercomparison Project (CMIP) have become the central elements of national and international efforts to assess climate changes and attribute how external drivers have influenced these changes (Eyring et al. Citation2016; Chen et al. Citation2020; Xu et al. Citation2018). Generally, it is quite necessary to assess the model performance of extreme events before the attribution and projection implementation. Several studies have used the CMIPs to calculate the extreme indices recommended by the Expert Team on Climate Change Detection and Indices (ETCCDI) and evaluate the global and regional changes in precipitation and temperature extremes (Sillmann et al. Citation2013; Xu, Wu, and Hu Citation2019; Thibeault and Seth Citation2014; Wang, Jiang, and Lang Citation2017). Among them, there have been evaluation and intercomparison studies via the comparison of previous CMIP models and new ones—for example, between phase 3 (CMIP3) and phase 5 (CMIP5) in terms of precipitation and temperature extremes (Chen and Sun Citation2015; Kumar, Kodra, and Ganguly Citation2014). Results generally show that the new versions outperform the old ones in temperature extremes, but performances vary with respect to indices of precipitation extremes.
The latest generation of models in phase 6 of CMIP (i.e. CMIP6) have been improved on the basis of CMIP5. CMIP6 models mainly focus on the Earth system as a whole, including the carbon and nitrogen cycles, with most having realized bidirectional coupling of atmospheric chemical processes and substantial improvements in the resolutions of their atmospheric and oceanic component models (Eyring et al. Citation2016). Therefore, it is imperative to leverage the CMIP6 dataset to evaluate, detect, and attribute extreme weather events—information that will play a critical role in long-term climate projections and policymaking.
The region of the mid–high latitudes of Asia (MHA; 34.5°–90°N, 60°–180°E), covered by snow and permafrost, is one of the most sensitive and vulnerable areas around the world in response to global warming, in which climate changes have begun to exert adverse impacts on local society, ecosystems, and human health (Tang, Zhang, and Francis Citation2013; Zhang et al. Citation2019, Citation2020). It is thus urgent to evaluate model performance in simulating climate extremes in this region, such that valuable information can be provided to the public and local governments toward climate change mitigation and adaptation. In this context, the aim of the present paper is to provide a comprehensive evaluation of the latest CMIP6 models in simulating precipitation extremes over MHA, as compared with their predecessors in CMIP5.
2. Data and methods
The performance of CMIP6 models in simulating precipitation extremes over MHA was evaluated using 11 precipitation extreme indices constructed by ETCCDI and comparing the results to those of their predecessors in CMIP5. The analysis leveraged the 12 CMIP6 models available at the time of analysis and their predecessors in CMIP5 (Table S1), and only the first ensemble member of each model, referred to as r1i1p1 in CMIP5 and r1i1p1f1 in CMIP6, were employed. The 11 ETCCDI precipitation-related indices are summarized in Table S2.
In addition, observed gridded daily precipitation data, with a resolution of 0.5° latitude × 0.5° longitude, spanning from 1979 to 2018, acquired from the National Oceanic and Atmospheric Administration’s Climate Prediction Center (CPC), were employed. This dataset was developed from around 16 000 stations via the optimal interpolation method (Chen et al. Citation2008). For comparison, all indices, both simulated and observed, were resampled to a common 1.5° × 1.5° grid using a first-order conservative remapping procedure implemented in the Climate Data Operators (CDO, Max Planck Institute for Meteorology, Germany. https://code.mpimet.mpg.de/projects/cdo).
3. Results
3.1. Spatial performance
First, the simulated climate means of 11 precipitation extreme indices for the reference period of 1986–2005 are compared with the observations over MHA. The CMIP6 medians of precipitation extreme indices, including total wet day precipitation (PRCPTOT), very heavy precipitation days (R20mm), very wet days (R95p), and maximum 1-day precipitation (RX1day), can explain the spatial coverage well, with pattern correlations greater than 0.86 (Figure S1). Additionally, the pattern correlations of the other indices are greater than 0.62, which are also much higher than in CMIP5, except for consecutive wet days (CWD). Although the CMIP5 model medians exhibit similar spatial coverages and high pattern correlations with the observations, they are still slightly inferior to those of CMIP6. Additionally, the simulated indices are overestimated to varying degrees, except for consecutive dry days (CDD). This overestimation mainly results from the increased bias of the CMIP6 models compared to that of the CMIP5 models, especially for GFDL-ESM4, INMCM5.0, IPSL-CM6A-LR, and MRI-ESM2-0 (for instance, IPSL-CM6A-LR and MRI-ESM2-0 produce a biased R95p that exceeds the CMIP5 one of 20.7 mm). However, CDD is evidently underestimated by both the CMIP6 and CMIP5 models, especially CMIP6, the value approximately 15.4 days (12.7 days in CMIP5). This high negative bias results from several specific models, including INMCM5.0 and MIROC6.
The Taylor diagram is a tool that can be used to concisely present model performances in simulating climate means, consisting of three parts: spatial correlation, the ratio of variances, and centralized root-mean-square differences between models and observations (Taylor Citation2001). compares the CMIP6 and CMIP5 models in simulating the precipitation-related extreme indices over MHA. The multimodel median ensemble (MME) generally outperforms the individual models, and CMIP6-MME shows a relatively higher performance than CMIP5-MME. However, model capability varies across the indices. For example, the climate means are reasonably simulated by both the CMIP5 and CMIP6 models, apart from that of CWD, which shows a dispersed and disorderly distribution in the Taylor diagram (Figure S2). Additionally, the CMIP6 models are better at simulating PRCPTOT, the number of wet days (R1mm), RX1day, the maximum 5-day precipitation (RX5day) than others indices; their spatial correlations are greater than 0.6 and their ratios of variance close to 1. In terms of root-mean-square error (RMSE), the medians of the CMIP6 models compare well with those of CMIP5, but a relatively larger interquartile model spread is generally apparent for the CMIP6 models across the various indices (Figure S3). Thus, further exploration is still needed in the future.
Figure 1. Taylor diagrams of the CMIP6 and CMIP5 simulated climate means (1986–2005) for precipitation extreme indices (total wet day precipitation (PRCPTOT), number of wet days (R1mm), maximum 1-day precipitation (RX1day), and maximum 5-day precipitation (RX5day)). The dots represent CMIP5 (blue) and CMIP6 (red) individual models, where each larger dot represents the multimodel ensemble median

3.2. Temporal performance
Next, we compare the temporal performances amongst the CMIP6, CMIP5 models and observations in terms of the precipitation extreme indices, as shown in Figure S4. From the results we can see relatively larger values of extreme indices in the CMIP6 medians than for CMIP5, as well as their quantile spreads, apart from CWD. Compared with the observations, almost all indices are overestimated in both the CMIP6 and CMIP5 models, except for CDD (Figure S4). Generally, there are large differences with the observation whatever index is overestimated or underestimated, suggesting large uncertainty still remains in the simulation of extremes; and this is also reflected in the values of RMSE (Figure S3). Nonetheless, R20mm and the simple daily intensity index (SDII) show little difference with their observations, as also depicted in Figure S4. With regard to the temporal performance of the precipitation extreme indices, there are no significant improvements in PRCPTOT from CMIP5 to CMIP6 (Figure S4). Moreover, the temporal anomaly series shown in the right-hand column of Figure S4 demonstrates that most of the simulated indices are more suitable for observation, except for CDD, even if there are biases between them. In particular, the increasing trend of extremely wet days (R99P) is totally in accordance with observation.
3.3. Relative model performances
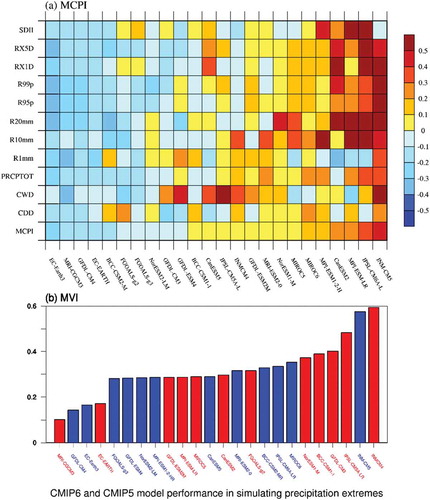
In order to further compare the performances of individual models, we implemented a comprehensive analysis using a ‘portrait’ diagram, as proposed by Gleckler, Taylor, and Doutriaux (Citation2008), which considers both the model capability in simulating the climatic mean and the variability via an exploratory model climate performance index (MCPI) and an exploratory model variability index (MVI), respectively (). The MCPI is defined as the relative error of each model relative to that of every ETCCDI extreme index, and the MVI is a metric that analyzes the interannual variability of each model relative to the 11 ETCCDI extreme indices. In general, when MCPI tends toward a negative value, and the smaller the value of MVI, the indication is that the model being evaluated can simulate the extremes well. Overall, it is clear that the metrics vary across models and indices, as discussed below.
Figure 2. (a) Portrait diagram of relative spatially averaged RMSEs in the 1986–2005 climatology of the precipitation extreme indices simulated by CMIP5 and CMIP6 individual models. (b) Model variability index, referring to the multivariable mean of the ratio of simulated to observed variance for both CMIP6 (blue) and CMIP5 (red) individual models

According to the MCPI values, the CMIP6 models EC-Earth3, GFDL-CM4 and the CMIP5 models MRI-CGCM3, EC-EARTH possess relatively stronger capabilities in simulating the precipitation extreme indices, whilst INM-CM5.0 performs poorly ()). The other models show some differences for the various indices. For example, BCC-CSM2-MR presents a relatively lower reproducibility for R1mm and CDD, but with a relatively higher performance for the other indices. The family comparison between CMIP6 and CMIP5 shows that most of the new models in CMIP6 show better performance than their predecessors—for example, EC-Earth3 vs. EC-EARTH, GFDL-CM4 vs. GFDL-CM3, etc. In contrast, some models, such as IPSL-CM6A-LR, display a relatively lower capability than its predecessors (IPSL-CM5A-LR), despite the model reported to be substantially improved.
The model performance in simulating the interannual variability is shown in ) on the basis of MVI. The CMIP6 models GFDL-CM4, EC-Earth3 and the CMIP5 models MRI-CGCM3, EC-EARTH perform better than other models in simulating the interannual variability ()), as also reflected in the analysis of MCPI. However, INM-CM5.0 (CMIP6) and INM-CM4 (CMIP5) are relatively poor performances. Additionally, the results of the pairwise comparison of model families show some differences between the values of MCPI and MVI. For instance, FGOALS-g2 and FGOALS-g3, in which there is almost no improvement for MCPI, but for MVI the improvement is far clearer.
Further comparison was implemented using the metric S advocated by Taylor (Citation2001). Generally, a high value of S (toward 1) indicates high skill. Clearly, CMIP6-MME (0.92) shows higher performance than CMIP5-MME (0.87), and most of the indices were improved in the new version, except for CDD (Table S3). The total improvement of model families can reach 62%, as estimated from the improvement of the CMIP6 new versions compared with the CMIP5 old versions on the basis of 11 precipitation extreme indices (i.e. the number of red S values divided by the total S). According to the mean value of S, 70% of models have been improved. The improvement of RX1day index is the best, and the ratio of improvement reaches 92.3% among models, with only one model family showing no obvious change (IPSL-CM6A-LR vs. IPSL-CM5A-LR). In contrast, the indices of CDD and heavy precipitation days (R10mm) are poorly simulated, with a ratio of just 42%. Among the models, there are three that possess 100% improvement rates for all indices—namely, BCC-CSM2-MR, GFDL-CM4, and GFDL-ESM4—for which the S values increase for all indices as compared to their predecessors in CMIP5, which can also be seen in . For INMCM5.0, there are also 10 indices for which its skill is higher in the new version. However, MRI-ESM2-0/MRI-CGCM3 presents almost no improvement for all precipitation extreme indices over MHA, except for RX1day.
4. Conclusions
The aim of this study was to quantitatively and objectively evaluate the performance of CMIP6 models in simulating the precipitation extreme indices over the MHA region and compare the results with their predecessor models in CMIP5. Generally, the MME results outperform the individual model results, and CMIP6-MME shows better skill than CMIP5-MME. However, most of the indices are overestimated, and large uncertainties still exist, which needs further exploration in the future.
Additionally, a comparison of model families was also implemented between CMIP6 and CMIP5 models, with the results showing that most of the new-version models are better than their predecessors in terms of their simulation performance. Moreover, to comprehensively assess individual model performances, the S index metric was employed. The results suggest that CMIP6-MME (0.92) is better than CMIP5-MME (0.87), and the total ratio of improvement of model families reaches 62%. In particular, with respect to mean values, the rate of improvement reaches 70% for the overall mean of all models, and the higher skill is also exhibited in the new versions of individual models.
Supplemental Material
Download PDF (1.6 MB)Disclosure statement
No potential conflict of interest was reported by the authors.
Supplementary material
Supplemental data for this article can be accessed here.
Additional information
Funding
References
- Chen, H. P., and J. Q. Sun. 2015. “Assessing Model Performance of Climate Extremes in China: An Intercomparison between CMIP5 and CMIP3.” Climatic Change 129 (1–2): 197–211. doi:10.1007/s10584-014-1319-5.
- Chen, H. P., J. Q. Sun, W. Q. Lin, and H. W. Xu. 2020. “Comparison of CMIP6 and CMIP5 Models in Simulating Climate Extremes.” Science Bulletin 65: 1415–1418. doi:10.1016/j.scib.2020.05.015.
- Chen, M. Y., W. Shi, P. P. Xie, V. B. S. Silva, V. E. Kousky, R. W. Higgins, and J. E. Janowiak. 2008. “Assessing Objective Techniques for Gauge-based Analyses of Global Daily Precipitation.” Journal of Geophysical Research 113: D4. doi:10.1029/2007jd009132.
- Eyring, V., S. Bony, G. A. Meehl, C. A. Senior, B. Stevens, R. J. Stouffer, and K. E. Taylor. 2016. “Overview of the Coupled Model Intercomparison Project Phase 6 (CMIP6) Experimental Design and Organization.” Geoscientific Model Development 9 (5): 1937–1958. doi:10.5194/gmd-9-1937-2016.
- Gao, X. J., J. Wu, Y. Shi, J. Wu, Z. Y. Han, D. F. Zhang, Y. Tong, R. K. Li, Y. Xu, and F. Giorgi. 2018. “Future Changes in Thermal Comfort Conditions over China Based on multi-RegCM4 Simulations.” Atmospheric and Oceanic Science Letters 11 (4): 291–299. doi:10.1080/16742834.2018.1471578.
- Giorgi, F., and X. J. Gao. 2018. “Regional Earth System Modeling: Review and Future Directions.” Atmospheric and Oceanic Science Letters 11 (2): 189–197. doi:10.1080/16742834.2018.1452520.
- Gleckler, P. J., K. E. Taylor, and C. Doutriaux. 2008. “Performance Metrics for Climate Models.” Journal of Geophysical Research 113: D6. doi:10.1029/2007jd008972.
- Kumar, D., E. Kodra, and A. R. Ganguly. 2014. “Regional and Seasonal Intercomparison of CMIP3 and CMIP5 Climate Model Ensembles for Temperature and Precipitation.” Climate Dynamics 43 (9–10): 2491–2518. doi:10.1007/s00382-014-2070-3.
- Li, H. X., H. P. Chen, H. J. Wang, and E. T. Yu. 2018. “Future Precipitation Changes over China under 1.5 Degrees C and 2.0 Degrees C Global Warming Targets by Using CORDEX Regional Climate Models.” Science of the Total Environment 640–641: 543–554. doi:10.1016/j.scitotenv.2018.05.324.
- Rivera, J. A., and G. Arnould. 2020. “Evaluation of the Ability of CMIP6 Models to Simulate Precipitation over Southwestern South America: Climatic Features and Long-term Trends (1901–2014).” Atmospheric Research 241. doi:10.1016/j.atmosres.2020.104953.
- Sillmann, J., V. V. Kharin, X. Zhang, F. W. Zwiers, and D. Bronaugh. 2013. “Climate Extremes Indices in the CMIP5 Multimodel Ensemble: Part 1. Model Evaluation in the Present Climate.” Journal of Geophysical Research: Atmospheres 118 (4): 1716–1733. doi:10.1002/jgrd.50203.
- Sun, C., Z. N. Xiao, J. Q. Sun, and E. T. Yu. 2019. “Projection of Temperature Change and Extreme Temperature Events in the Lancang–Mekong River Basin.” Atmospheric and Oceanic Science Letters 13 (1): 16–25. doi:10.1080/16742834.2020.1696143.
- Tang, Q. H., X. J. Zhang, and J. A. Francis. 2013. “Extreme Summer Weather in Northern Mid-latitudes Linked to a Vanishing Cryosphere.” Nature Climate Change 4 (1): 45–50. doi:10.1038/nclimate2065.
- Taylor, K. E. 2001. “Summarizing Multiple Aspects of Model Performance in a Single Diagram.” Journal of Geophysical Research: Atmospheres 106 (D7): 7183–7192. doi:10.1029/2000jd900719.
- Thibeault, J. M., and A. Seth. 2014. “Changing Climate Extremes in the Northeast United States: Observations and Projections from CMIP5.” Climatic Change 127 (2): 273–287. doi:10.1007/s10584-014-1257-2.
- Wang, X. X., D. B. Jiang, and X. M. Lang. 2017. “Future Extreme Climate Changes Linked to Global Warming Intensity.” Science Bulletin 62 (24): 1673–1680. doi:10.1016/j.scib.2017.11.004.
- Xu, K., R. Y. Lu, J. Y. Mao, and R. D. Chen. 2019. “Circulation Anomalies in the Mid–high Latitudes Responsible for the Extremely Hot Summer of 2018 over Northeast Asia.” Atmospheric and Oceanic Science Letters 12 (4): 231–237. doi:10.1080/16742834.2019.1617626.
- Xu, K., C. H. Wu, and B. X. Hu. 2019. “Projected Changes of Temperature Extremes over Nine Major Basins in China Based on the CMIP5 Multimodel Ensembles.” Stochastic Environmental Research & Risk Assessment 33 (1): 321–339. doi:10.1007/s00477-018-1569-2.
- Xu, Y., X. J. Gao, F. Giorgi, B. T. Zhou, Y. Shi, J. Wu, and Y. X. Zhang. 2018. “Projected Changes in Temperature and Precipitation Extremes over China as Measured by 50-yr Return Values and Periods Based on a CMIP5 Ensemble.” Advances in Atmospheric Sciences 35 (4): 376–388. doi:10.1007/s00376-017-6269-1.
- Zhai, P. M., B. Q. Zhou, and Y. Chen. 2018. “A Review of Climate Change Attribution Studies.” Journal of Meteorological Research 32 (5): 671–692. doi:10.1007/s13351-018-8041-6.
- Zhang, M., H. Yu, J. Huang, Y. Wei, X. Liu, and T. Zhang. 2019. “Comparison of Extreme Temperature Response to 0.5°C Additional Warming between Dry and Humid Regions over East–central Asia.” International Journal of Climatology 39 (7): 3348–3364. doi:10.1002/joc.6025.
- Zhang, M., H. Yu, A. D. King, Y. Wei, J. Huang, and Y. Ren. 2020. “Greater Probability of Extreme Precipitation under 1.5°C and 2°C Warming Limits over East-Central Asia.” Climatic Change. doi:10.1007/s10584-020-02725-2.
- Zhou, B. T., Q. H. Wen, Y. Xu, L. C. Song, and X. B. Zhang. 2014. “Projected Changes in Temperature and Precipitation Extremes in China by the CMIP5 Multimodel Ensembles.” Journal of Climate 27 (17): 6591–6611. doi:10.1175/jcli-d-13-00761.1.
- Zhou, B. T., J. Wu, Y. Xu, Z. Y. Han, and Y. Shi. 2019. “Projected Changes in Autumn Rainfall over West China: Results from an Ensemble of Dynamical Downscaling Simulations.” International Journal of Climatology 39 (12): 4869–4882. doi:10.1002/joc.6115.