
 ?Mathematical formulae have been encoded as MathML and are displayed in this HTML version using MathJax in order to improve their display. Uncheck the box to turn MathJax off. This feature requires Javascript. Click on a formula to zoom.
ABSTRACT
Evolution of the autumn snowpack has been considered as a potential source for the subseasonal predictability of winter surface air temperature, but its linkage to precipitation variability has been less well discussed. This study shows that the snow water equivalent (SWE) over the Urals region in early (1–14) November is positively associated with precipitation in southern China during 15–21 November and 6–15 January, based on the study period 1979/80–2016/17. In early November, a decreased Urals SWE warms the air locally via diabatic heating, indicative of significant land–atmosphere coupling over the Urals region. Meanwhile, a stationary Rossby wave train originates from the Urals and propagates along the polar-front jet stream. In mid (15–21) November, this Rossby wave train propagates downstream toward East Asia and, combined with the deepened East Asian trough, reduces the precipitation over southern China by lessening the water vapor transport. Thereafter, during 22 November to 5 January, there are barely any obvious circulation anomalies owing to the weak land–atmosphere coupling over the Urals. In early (6–15) January, the snowpack expands southward to the north of the Mediterranean Sea and cools the overlying atmosphere, suggestive of land–atmosphere coupling occurring over western Europe. A stationary Rossby wave train trapped in the subtropical westerly jet stream appears along with anomalous cyclonic circulation over Europe, and again with a deepened East Asian trough and less precipitation over southern China. The current findings have implications for winter precipitation prediction in southern China on the subseasonal timescale.
Graphical abstract
摘要
众多研究表明, 秋季积雪的时空演变是次季节尺度气温预测的重要依据, 然而其与降水变化的关系还未得到充分研究。本文分析发现, 在1979/80至2016/17时期, 11月前期 (1至14日) 乌拉尔山地区雪水当量与该年11月15至21日及次年1月6至15日中国南方降水有显著的正相关关系。乌拉尔山雪水当量在11月前期 (1至14日) 偏少时, 可以通过非绝热加热过程增暖其上空大气, 表现为显著的陆–气耦合。同时乌拉尔山地区出现准定常Rossby波列, 并沿极锋急流向东传播。在11月中期 (15至21日), 该波列向下游传播至东亚地区, 增强了东亚大槽强度, 使得中国南方水汽输送强度减弱, 降低了该地区的降水强度。在其后的11月22日至次年1月5日, 乌拉尔山地区陆–气耦合较弱, 其上空环流异常也较弱。在次年1月前期 (6至15日), 积雪向南扩展至地中海北侧地区, 并通过陆–气耦合作用冷却其上方大气。气旋性环流异常出现在欧洲上空, 同时伴随着沿副热带西风急流传播的准定常Rossby波列。该波列加深东亚大槽, 并减弱了中国南方地区的降水强度。本文研究结果可用于中国南方冬季次季节尺度降水的预测。
1. Introduction
The Snowpack over Eurasia is an active component in the climate system. It rapidly accumulates in autumn, expands westward from eastern Siberia in September to northern Europe in November, and gradually invades southward to the north of the Mediterranean Sea during wintertime (Ye and Wu Citation2017; Yeo, Kim, and Kim Citation2017). Increasing attention has been given to the role of the Eurasian snowpack in controlling the land–atmosphere coupling via the snow‐albedo feedback (Qu and Hall Citation2006a, Citation2006b), i.e., increased snow water equivalent (SWE) leads to diabatic cooling of the air via reduced surface absorbed shortwave radiation, emitted longwave radiation, and upward turbulent heat flux (Cohen and Entekhabi Citation1999; Fletcher et al. Citation2009). The evolution of the Eurasian snowpack and its coupling with the atmosphere is recognized as a potential source for subseasonal-to-seasonal predictability. Realistic snow initialization contributes to the predictive skill for surface air temperature (SAT) in the midlatitude transition regions on the southern flanks of the snow-covered land areas at lead times of longer than 30 days (Li et al. Citation2019; Orsolini et al. Citation2013; Sun Citation2017).
Besides, anomalous atmospheric cooling coupled with an extensive snowpack could stretch up to the mid-troposphere, inducing overlying cyclonic circulation anomalies and triggering Rossby wave trains that propagate along westerly jet streams across Eurasia (Chen and Sun Citation2002; Luo and Wang Citation2019). Winter precipitation variability in East Asia has also been found to be related to complex interactions between the Eurasian snowpack and circulation processes, which modulate the East Asian trough and surface winds, altering water vapor transport toward East Asia (Ao and Sun Citation2016). However, recent studies point out that the precipitation variability over East Asia possesses distinct subseasonal characteristics. Yao, Lin, and Wu (Citation2015) found the dominant winter precipitation pattern on the pentad time scale is a monopole center over southern China, which propagates southeastward to the coastal area of southern China one pentad later, along with East Asian cold surges modulated by a traveling Rossby wave train originated from Europe. Moreover, extreme precipitation events, such as the snowstorm over southern China in January 2008 (Xiong Citation2013; Zhe, Li, and Mu Citation2011), further confirm the robust subseasonal precipitation variability during wintertime. Therefore, analysis on the subseasonal time scale is necessary to better understand the winter precipitation variability in East Asia.
Considering that the Eurasian snowpack develops rapidly in autumn and is closely correlated with overlying Rossby wave activities during the following months, whether the evolution of the Eurasian snowpack exerts an impact upon subseasonal precipitation variability in East Asia deserves further investigation. This study pays special attention to the impact from Urals snow anomalies in early (first two weeks) November, as considerable SWE variability concurs with climatologically significant land–atmosphere coupling in this region (), green rectangular box). Daily datasets are adopted to explore the potential subseasonal precipitation responses to the long-lasting Urals snow anomalies during wintertime. Our findings are helpful for winter precipitation prediction in southern China on the subseasonal time scale.
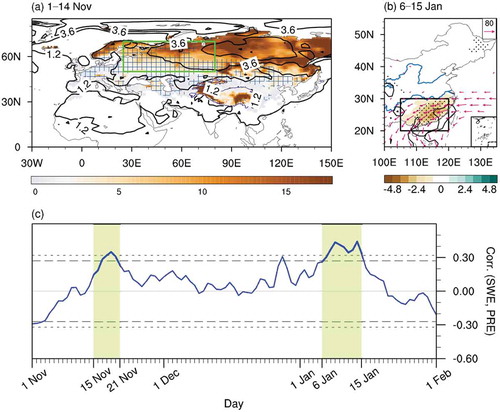
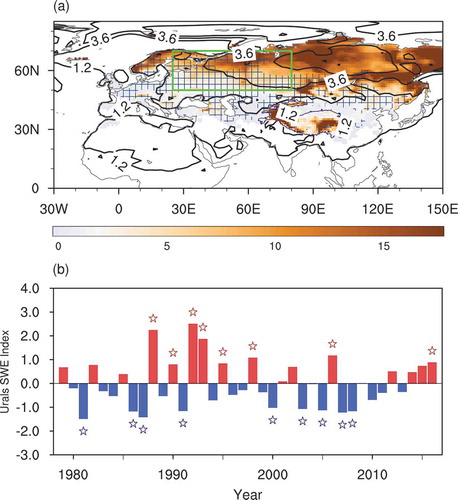
Figure 1. (a) Interannual variation of SWE (shaded; units: mm) and SAT (contours; units: °C) during 1–14 November 1979–2016. The region gridded in blue denotes that the correlation coefficients of SWE and SAT during 1–14 November (14-day mean) exceed the 99% confidence level, which represents the land–atmosphere coupling. (b) Temporal evolution of Urals SWE index during 1–14 November 1979–2016. Blue and red stars mark the years with decreased and increased Urals SWE, respectively. The green rectangular box in (a) denotes the Urals region used to define the Urals SWE index in (b)
2. Data and methods
Three datasets are employed in this study. The daily atmospheric data, including geopotential height, zonal and meridional winds, 2-m air temperature (SAT), and specific humidity, with a resolution of 2° × 2° and covering the period 1979–2019, are from the European Centre for Medium-Range Weather Forecasts (ECMWF) interim reanalysis (ERA-Interim; Dee et al. Citation2011). The observed daily precipitation data, with a 0.25° × 0.25° resolution and covering the period 1979–2017, are from the CN05.1 dataset (Wu and Gao Citation2013), which assimilates 2400 station measurements in China. The daily SWE data (resolution, 1° × 1°; timespan, 1979–2018) are from ERA-Interim/Land (Balsamo et al. Citation2015). The study period of the current research is 1979/80–2016/17.
The Urals SWE index is defined as the SWE averaged over (50°–70°N, 25°–80°E) during 1–14 November, where/when it displays large SWE variability and strong land–atmosphere coupling, as denoted by the green rectangular box in ). To achieve a robust sample size for composite analysis, eight increased (i.e., 1988, 1990, 1992, 1993, 1995, 1998, 2006, and 2016) and nine decreased (i.e., 1981, 1986, 1987, 1991, 2000, 2003, 2005, 2007, and 2008) Urals SWE years are selected based on the normalized Urals SWE index being above 0.8 and below −0.8, respectively ()). The precipitation index in southern China is calculated as the precipitation average over (20°–30°N, 105°–120°E). Water vapor transport is calculated as , where g is gravitational acceleration, q is specific humidity,
is horizontal wind,
is pressure, and the integration ranges from the surface to 300 hPa. In order to better exhibit the circulation features associated with precipitation anomalies in East Asia, the wave activity flux (WAF) is calculated along with the geopotential height anomaly (Takaya and Nakamura Citation2001). The axes of the polar and subtropical westerly jets are the maxima of the 300-hPa westerlies over mid–high latitudes. Given that El Niño–Southern Oscillation (ENSO) is a long-lasting ocean–atmosphere coupling over the tropical Pacific that greatly impacts the East Asian winter climate (Su, Zhang, and Zhu Citation2013; Yi, Zheng, and Luo Citation2019), the linear influence of ENSO in November is excluded to distinguish the atmospheric responses to the Urals SWE anomalies. Besides, linear trends have been removed from all indices and fields to isolate the interannual variability. The Student’s t-test is employed when evaluating the significance of correlations and composite results.
3. Results
The snowpack on land, a slowly evolving component of the climate system, is intimately involved in the land–atmosphere coupling (Dutra et al. Citation2011; Xu and Dirmeyer Citation2011). During 1–14 November, robust variability of SWE appears over Eurasian high latitudes, including Scandinavia, the Urals, western Siberia and the Russian Far East, and the Tibetan Plateau (), shaded). Large variability of SAT occurs over the Barents–Kara seas, due to rapid sea-ice loss, and over Siberia owing to snowpack accumulation (Liu et al. Citation2012), which decreases toward midlatitudes (), contours). Interestingly, significant land–atmosphere coupling coincides with the SWE variability center over the Urals region along 50°–70°N, while that over Asia is mainly located over the snow transition regions at the southern edge of the snow-covered region along 40°−60°N (), gridded). Thus, when exploring the snow forcing upon the atmosphere, we define the Urals SWE index as the area-averaged SWE over the region (50°–70°N, 25°–80°E; denoted by the green rectangular box in )) during 1–14 November, where/when it is characterized by large SWE variability and strong land–atmosphere coupling.
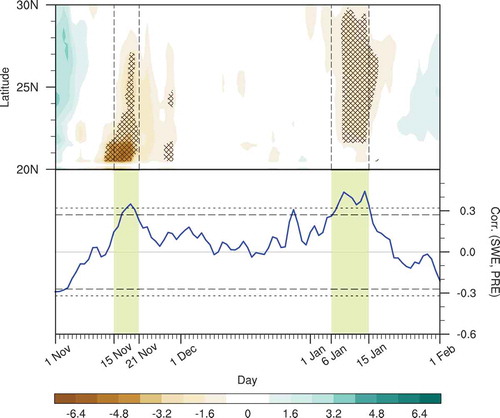
To identify the winter precipitation response to Urals SWE anomalies in southern China on the subseasonal time scale, we depict the 7-day running mean daily precipitation anomaly composited between low and high Urals SWE years (, top). Along 20°–30°N, a significant negative precipitation anomaly is observed only during 15–21 November and 6–15 January. Quantitative analysis by calculating the correlation coefficients between the early November Urals SWE index and the 7-day running mean daily precipitation index in southern China further confirms the result (, bottom). There is a potential linkage between the early November Urals SWE anomaly and precipitation variability over southern China in boreal winter on the subseasonal time scale.
Figure 2. Top: Composite difference of 7-day running-mean daily precipitation (units: mm d−1) averaged over 105°–120°E from 1 November to 1 February between decreased and increased Urals SWE years. Crossed regions denote values exceeding the 95% confidence level. Bottom: Correlation coefficients of Urals SWE index during 1–14 November with 7-day running-mean daily precipitation index in southern China (20°–30°N, 105°–120°E; denoted by the rectangular box in ). Dashed and dotted lines represent the correlation coefficients at the 90% and 95% confidence level, respectively
Next, we carry out further investigations during four periods (1–14 November, 15–21 November, 22 November to 5 January, and 6–15 January), based on the unstable relationship between the Urals SWE and southern China precipitation mentioned above. In the first period (1–14 November), a decreased Urals SWE collocates with a regionally increased SAT, suggesting diabatic heating caused by a decreased Urals snowpack ()). The overlying anomalous anticyclonic circulation centered at 65°N ()) is indicative of an enhanced Urals ridge. Moreover, a Rossby wave train originated from the Urals region propagates along the polar-front jet stream ()), which is associated with a cyclonic anomaly over Lake Baikal and an anticyclonic anomaly over Japan, shifting the East Asian tough more to the west. In the second period (15–21 November), although there is still a persistent negative SWE anomaly over the Urals, the local SAT response is suppressed, agreeing with the southward shrinkage of the land–atmosphere coupling area south to 60°N (), gridded). Meanwhile, the Rossby wave train propagates downstream with a large negative anomaly of 300-hPa geopotential height over Japan, which intensifies the East Asian trough ()). In the third period (22 November to 5 January), weak Rossby wave activities appear over high-latitude Eurasia north of 50°N ()). Interestingly, more moisture is transported toward western Europe, favoring the snowpack extending more to the south ()). In the fourth period (6–15 January), with continuous water vapor transport toward western Europe, a positive SWE anomaly develops across the north of the Mediterranean Sea and serves to cool the overlying atmosphere ()). WAFs are emitted from western Europe and Rossby waves propagate along the subtropical westerly waveguide, inducing negative 300-hPa geopotential height anomalies over the East China Sea and deepening the East Asian trough.
Figure 3. (a–d) Composite difference of vertically integrated water vapor transport (from the surface to 300 hPa; vectors; units: kg m−1 s−1), SWE (shaded; units: mm), and SAT (contours; units: °C) during (a) 1–14 November, (b) 15–21 November, (c) 22 November to 5 January, and (d) 6–15 January, between decreased and increased Urals SWE years. The contour interval is 2.5°C, with negative values in dashed contours. Regions gridded blue represent land–atmosphere coupling, calculated as the correlation coefficients between SWE and SAT averaged in each period. (e–h) Composite difference of 300-hPa meridional wind (shaded; units: m s−1), geopotential height (contours; units: 10 gpm), and WAFs (vectors; units: m2 s−2). Thick brown curves denote climatological westerly jet axes at 300 hPa. Dotted regions denote values exceeding the 95% confidence level
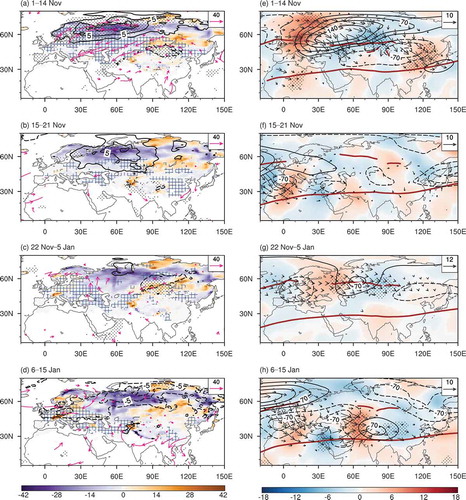
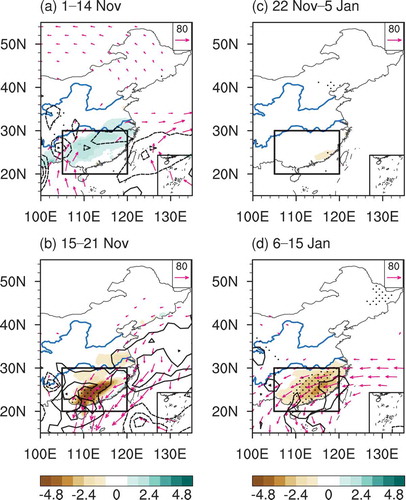
With respect to the variation of precipitation and water vapor transport, in the first period, along with the westward-shifted East Asian trough, a northward water vapor transport anomaly appears over Southeast Asia, but with little of it reaching southern China (); Yang et al. Citation2012). Thus, there is no significant precipitation anomaly in southern China. In addition, in the third period, almost no climate response occurs in southern China ()), which might result from the weak snow-related circulation anomaly over East Asia ()). Whereas, concurrent with the strengthened East Asian trough in the second and fourth periods, anomalous northerlies induce a southward water vapor transport anomaly over southern China, which lessens the water vapor content and reduces precipitation there (,d)).
Figure 4. Composite difference of precipitation (shaded; units: mm d−1), vertically integrated water vapor transport (from the surface to 300 hPa; vectors; units: kg m−1 s−1), and its divergence (contours; units: 10−6 kg m−2 s−1) during (a) 1–14 November, (b) 15–21 November, (c) 22 November to 5 January, and (d) 6–15 January, between decreased and increased Urals SWE years. The contour interval is 25 × 10−6 kg m−2 s−1, with negative values as dashed contours. The blue curves denote the Yangtze River and Yellow River, respectively. The region marked by the rectangular box denotes southern China. Dotted regions denote values exceeding the 95% confidence level
4. Conclusions and discussion
This study reveals that anomalous Urals SWE during 1–14 November is significantly associated with subseasonal precipitation variability in southern China in the following two months, in which land–atmosphere coupling plays an important role in triggering Rossby wave trains propagating toward East Asia. During 1–14 November, decreased Urals SWE warms the overlying atmosphere via diabatic heating, which triggers a stationary Rossby wave train propagating along the polar-front jet stream, enhancing the Urals ridge and shifting the East Asian trough more to the west. In the following week (15–21 November), the Rossby wave train propagates downstream, deepening the East Asian trough. Consequently, stronger boreal winds weaken the water vapor supply and decrease precipitation over southern China.
During 22 November to 5 January, weak Rossby wave activities occur over high-latitude Eurasia north of 50°N, which tend to transport more water vapor toward western Europe and increase the regional snowpack. During 6–15 January, a positive SWE anomaly develops across the north of the Mediterranean Sea and cools the overlying atmosphere. A Rossby wave train is stimulated and travels along the subtropical westerly waveguide toward East Asia. The Rossby wave train induces an anomalous cyclone over the East China Sea and intensifies the East Asian trough, again decreasing the precipitation over southern China.
The prediction of precipitation variability and extremes is a continual and critical problem of great concern in current research. Previous studies have revealed that the Madden–Julian Oscillation, tropical Maritime Continent convection, and North Atlantic Oscillation may modulate the subseasonal variability of winter precipitation in China (Bollasina and Messori Citation2018; Yao, Lin, and Wu Citation2015). This study provides a new perspective that Urals SWE in early November also exerts an impact upon the subseasonal precipitation variability, and should be taken into consideration in winter subseasonal precipitation prediction.
Disclosure statement
No potential conflict of interest was reported by the authors.
Additional information
Funding
References
- Ao, J., and J. Q. Sun. 2016. “Connection between November Snow Cover over Eastern Europe and Winter Precipitation over East Asia.” International Journal of Climatology 36 (5): 2396–2404. doi:10.1002/joc.4484.
- Balsamo, G., C. Albergel, A. Beljaars, S. Boussetta, E. Brun, H. Cloke, D. Dee, et al. 2015. “ERA-Interim/Land: A Global Land Surface Reanalysis Data Set.” Hydrology and Earth System Sciences 19 (1): 389–407. doi:10.5194/hess-19-389-2015.
- Bollasina, M. A., and G. Messori. 2018. “On the Link between the Subseasonal Evolution of the North Atlantic Oscillation and East Asian Climate.” Climate Dynamics 51 (9–10): 3537–3557. doi:10.1007/s00382-018-4095-5.
- Chen, H. S., and Z. B. Sun. 2002. “Response of the Atmospheric General Circulation to Winter Snow Cover Anomaly.” Acta Meteorologica Sinica 16: 133–149.
- Cohen, J., and D. Entekhabi. 1999. “Eurasian Snow Cover Variability and Northern Hemisphere Climate Predictability.” Geophysical Research Letters 26 (3): 345–348. doi:10.1029/1998GL900321.
- Dee, D. P., S. M. Uppala, A. J. Simmons, P. Berrisford, P. Poli, S. Kobayashi, U. Andrae, et al. 2011. “The ERA-Interim Reanalysis: Configuration and Performance of the Data Assimilation System.” Quarterly Journal of the Royal Meteorological Society 137 (656): 553–597.
- Dutra, E., C. Schär, P. Viterbo, and P. M. A. Miranda. 2011. “Land‐atmosphere Coupling Associated with Snow Cover.” Geophysical Research Letters 38 (15): L15707. doi:10.1029/2011GL048435.
- Fletcher, C. G., S. C. Hardiman, P. J. Kushner, and J. Cohen. 2009. “The Dynamical Response to Snow Cover Perturbations in a Large Ensemble of Atmospheric GCM Integrations.” Journal of Climate 22 (5): 1208–1222. doi:10.1175/2008JCLI2505.1.
- Li, F., Y. J. Orsolini, N. Keenlyside, M. L. Shen, F. Counillon, and Y. G. Wang. 2019. “Impact of Snow Initialization in Subseasonal‐to‐seasonal Winter Forecasts with the Norwegian Climate Prediction Model.” Journal of Geophysical Research Atmospheres 124 (17–18): 10033–10048. doi:10.1029/2019JD030903.
- Liu, J. P., J. A. Curry, H. J. Wang, M. R. Song, and R. M. Horton. 2012. “Impact of Declining Arctic Sea Ice on Winter Snowfall.” Proceedings of the National Academy of Sciences of the United States of America 109 (11): 4074–4079. doi:10.1073/pnas.1114910109.
- Luo, X., and B. Wang. 2019. “How Autumn Eurasian Snow Anomalies Affect East Asian Winter Monsoon: A Numerical Study.” Climate Dynamics 52 (1–2): 69–82. doi:10.1007/s00382-018-4138-y.
- Orsolini, Y. J., R. Senan, G. Balsamo, F. J. Doblas-Reyes, F. Vitart, A. Weisheimer, A. Carrasco, and R. E. Benestad. 2013. “Impact of Snow Initialization on Sub-seasonal Forecasts.” Climate Dynamics 41 (7–8): 1969–1982. doi:10.1007/s00382-013-1782-0.
- Qu, X., and A. Hall. 2006a. “What Controls the Strength of Snow-Albedo Feedback?” Journal of Climate 20 (15): 3971–3981. doi:10.1175/JCLI4186.1.
- Qu, X., and A. Hall. 2006b. “Assessing Snow Albedo Feedback in Simulated Climate Change.” Journal of Climate 19 (11): 2617–2630. doi:10.1175/JCLI3750.1.
- Su, J. Z., R. H. Zhang, and C. W. Zhu. 2013. “ECHAM5-Simulated Impacts of Two Types of El Niño on the Winter Precipitation Anomalies in South China.” Atmospheric and Oceanic Science Letters 6 (5): 360–364. doi:10.3878/j.issn.1674-2834.13.0013.
- Sun, B. 2017. “Seasonal Evolution of the Dominant Modes of the Eurasian Snowpack and Atmospheric Circulation from Autumn to the Subsequent Spring and the Associated Surface Heat Budget.” Atmospheric and Oceanic Science Letters 10 (3): 191–197. doi:10.1080/16742834.2017.1286226.
- Takaya, K., and H. Nakamura. 2001. “A Formulation of A Phase-Independent Wave-Activity Flux for Stationary and Migratory Quasigeostrophic Eddies on A Zonally Varying Basic Flow.” Journal of the Atmospheric Sciences 58 (6): 608–627. doi:10.1175/1520-0469(2001)058<0608:AFOAPI>2.0.CO;2.
- Wu, J., and X. J. Gao. 2013. “A Gridded Daily Observation Dataset over China Region and Comparison with the Other Datasets (In Chinese).” Chinese Journal of Geophysics 56: 1102–1111.
- Xiong, Z. 2013. “Simulation of a Freezing Rain and Snow Storm Event over Southern China in January 2008 Using RIEMS 2.0.” Atmospheric and Oceanic Science Letters 6 (1): 27–32. doi:10.1080/16742834.2013.11447054.
- Xu, L., and P. Dirmeyer. 2011. “Snow-atmosphere Coupling Strength in a Global Atmospheric Model.” Geophysical Research Letters 38 (13): L13401.
- Yang, J., D. Y. Gong, W. S. Wang, M. Hu, and R. Mao. 2012. “Extreme Drought Event of 2009/2010 over Southwestern China.” Meteorology & Atmospheric Physics 115 (3–4): 173–184. doi:10.1007/s00703-011-0172-6.
- Yao, Y. H., H. Lin, and Q. G. Wu. 2015. “Subseasonal Variability of Precipitation in China during Boreal Winter.” Journal of Climate 28 (16): 6548–6559. doi:10.1175/JCLI-D-15-0033.1.
- Ye, K. H., and R. G. Wu. 2017. “Autumn Snow Cover Variability over Northern Eurasia and Roles of Atmospheric Circulation.” Advances in Atmospheric Sciences 34 (7): 847–858. doi:10.1007/s00376-017-6287-z.
- Yeo, S., W. M. Kim, and K. Y. Kim. 2017. “Eurasian Snow Cover Variability in Relation to Warming Trend and Arctic Oscillation.” Climate Dynamics 48 (1–2): 499–511. doi:10.1007/s00382-016-3089-4.
- Yi, S. J., F. Zheng, and H. Luo. 2019. “ENSO Combination Mode and Its Influence on Seasonal Precipitation over Southern China Simulated by ECHAM5/MPI-OM.” Atmospheric and Oceanic Science Letters 12 (3): 184–191. doi:10.1080/16742834.2019.1589366.
- Zhe, H., S. L. Li, and M. Mu. 2011. “The Role of Warm North Atlantic SST in the Formation of Positive Height Anomalies over the Ural Mountains during January 2008.” Advances in Atmospheric Sciences 28 (2): 246–256. doi:10.1007/s00376-010-0069-1.