
Abstract
In this work, we studied the effect of silver nanoparticles on the IR absorption mechanism in Ag/Ag2O composites. Ag/Ag2O composites were prepared by exposing silver films prepared by thermal evaporation to oxygen plasma afterglow. The infrared spectra of these samples were analysed. The results obtained showed that, the individual silver nanoparticles affect the vibrations of chemical bonds in Ag/Ag2O composites, and this is inferred from the gradual decrease in intensity when moving towards lower wavenumbers. In addition, it was found that the effect of individual silver nanoparticles is greatest in the frequency range of Ag–O bond vibrations and becomes weaker in the case of bonds with higher vibration energies.
1. Introduction
Many techniques used in the fabrication of thin films enable under special conditions to obtain metal/metal oxide composites that have important applications in many modern industries such as optoelectronics, solar cells, surface photochromic optics, imaging, photocatalysis and surface enhanced Raman scattering and data storage media, sensors, etc. [Citation1–12]. The use of surface plasmons from materials saturated with metal nanoparticles in specific applications requires studying the mutual interactions between these nanoparticles, in addition to studying the effect of their size, shape and the nature of the incubating material on the response of surface plasmons [Citation5–9]. One of the most important of these structures is the Ag/Ag2O composites, which has been studied extensively by many research groups and has many important and unique applications [Citation5–11].
In our previous work [Citation13], the Ag/Ag2O composites prepared by exposing thin films of metallic silver to streams of oxygen plasma have distinctive properties due to their unique structural composition, as they contain significant proportions of individual and non-individual silver nanoparticles. The results showed that the oxygen plasma power (W) has important effects on the properties of the absorbance peaks of silver nanoparticles (intensity, position and spectral width). Furthermore, we observed a slight degradation in the individual silver nanoparticles peaks. It has been suggested that this degradation occurs due to the mutual interaction between the individual silver nanoparticles located near the shell of Ag2O grains and the larger nanoparticles located in the adjacent grains.
In the current work, we attempt to take advantage of the distinct structural composition of our Ag/Ag2O composites to investigate the effect of silver nanoparticles on the infrared absorption spectra of these structures. The results we have obtained here complement those of our previous research so that optimal conditions for the synthesis of samples useful in specific applications can be identified.
2. Experimental
2.1. Sample preparation
The process of preparing Ag/Ag2O composites included two main stages:
The stage (1): Deposition of thin films of silver metal on substrates of specific materials (glass and Si (100)) using the thermal evaporation method. The deposition processes took place at room temperature, where we obtained silver films with a thickness of 316 nm.
The stage (2): Each deposited Ag film was exposed to a reactive stream of oxygen plasma afterglow at specific plasma power (w) in order to oxidise the Ag atoms. The oxygen plasma was generated using the system: Microwave SAIREM GMP 20 KEDS. contains plasma exposure conditions for each sample.
Table 1. The plasma exposure conditions for each sample.
More information about the method of preparing silver thin films and plasma generation system is available in our previous works [Citation13–16].
2.2. Sample characterisation
Crystallite structure of the Ag/Ag2O composites was measured by using the system: Stoe StadiP transmission X-ray diffractometer supplied with a Cu Kα1 source (λ = 1.54060 Å). The Vibrational modes of the chemical bonds present in the Ag/Ag2O composites were determined using a FTIR spectrophotometer (JASCO- 4200) in the range (400–3900 cm−1), with resolutions of 4 cm−1. The optical transmittance and absorption spectra were recorded using a UV–Vis spectrophotometer (Cary 5000).
3. Results and discussion
The FTIR spectra of the prepared Ag/Ag2O composites are shown in . The order of the spectra from top to bottom is consistent with the increasing oxygen content in the film. Samples A and E have relatively low oxygen content and exhibit metallic properties. Sample D has the highest oxygen content and exhibits semiconductor properties. A number of features can be distinguished in the spectra, which appear most clearly in the spectrum of sample F. The large peak near 2375 cm−1 is due to the carbon dioxide in the atmosphere [Citation16]. The appearance of a broad band at the range 3600–3900 cm−1 is associated with the stretching modes of hydrocarbon and hydroxyl groups commonly encountered in oxide semiconductors and isolated SiOH groups [Citation17]. The peaks between 1100 and 1900 cm−1 are characteristics of hydroxyl group and the absorbance of water [Citation18]. Distinctive features of silver oxide appear in the range 400–1100 cm1. Within this range, a sharp peak appears in the narrow range 585–620 cm−1 (the peak ɑ). This peak was assigned to the stretching vibration of Ag and Ag–O–Ag [Citation19]. The appearance of this peak is evidence of the formation of silver nanoparticles (AgNPs) [Citation20,Citation21].
Figure 1. The FTIR spectra of the prepared Ag/Ag2O composites.
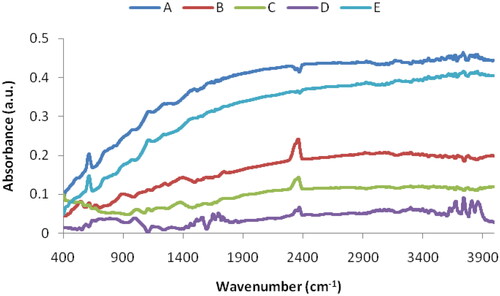
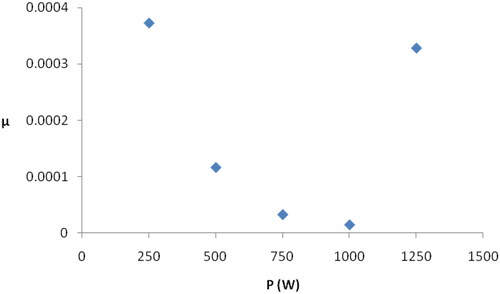
A unique behaviour that can be observed in each FTIR spectrum in is the gradual and consistent decrease in intensity when moving from high to low wavenumbers. As we mentioned above, our samples are rich in silver nanoparticles, so it can be assumed that this decrease in intensity is due to the effects of silver nanoparticles on the vibrations of all chemical bonds in the film. This interpretation is supported by the fact that several studies [Citation22–25] found that the attachment of Ag NPs to a chemical group clearly affects the features of this group in the infrared spectra, and this is manifested by a decrease in intensity and band shifting. When coupling occurs between silver nanoparticles and a chemical group, the FTIR band of this group shifts towards lower wavenumbers due to the slowing down of the vibration of chemical bonds because of the increase in molecular weight [Citation24,Citation25]. The behaviour of the spectra in indicates that, the effect of silver nanoparticles is greatest in the case of the bonds with low vibration energies (Ag–O) bonds and becomes weaker in the case of bonds that have higher vibration energies. On the other hand, it can be noticed that the baseline of each spectrum in the wavenumber range of silver–oxygen bonds (400–1200 cm−1) is almost straight. We denote the slope of this line with the symbol ‘µ’.This coefficient is a measure of the decrease in the intensity of absorption caused by silver nanoparticles within the mentioned range. shows the coefficient µ as a function of the oxygen plasma power. The behaviour of the coefficient µ in this figure is similar to the behaviour of the films content of individual silver nanoparticles when the oxygen plasma power is increased from 250 to 1250 W, which was studied in previous work [Citation13]. This result confirms that the gradual decrease in intensity in each infrared spectrum is the result of the association of individual silver nanoparticles with chemical groups in the sample.
Figure 2. The coefficient µ as a function of the oxygen plasma power.
In our previous work [Citation13], we used XRD spectra data to calculate the size of silver oxide (Ag2O) grains of our samples using the Scherrer equation [Citation26]. In another work [Citation14], we calculated the optical energy band gap of the prepared samples using Tauc method [Citation27]. contains the values of grain size and optical band gap for all samples.
Table 2. The grain size and optical band gap for all samples.
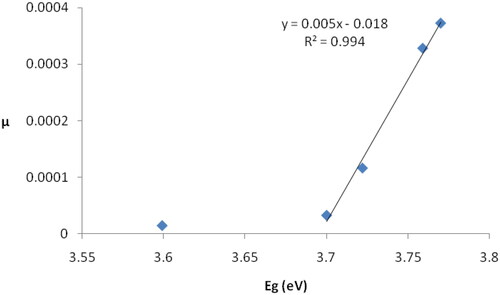
displays the coefficient µ as a function of the energy band gap of prepared samples. We notice that the coefficient µ increases with the increase in the energy band gap, and the relationship between them is linear, with the exception of sample D, which has the highest oxygen content and the lowest content of individual silver nanoparticles. The increase in the energy gap leads to a decrease in the electrical conductivity of the film, which in turn leads to a decrease in the polarity of the Ag–O bonds. This decrease appears in the form of a decrease in the intensity of the peak corresponding to these bonds in the infrared spectra because the intensity of an absorption band depends on the polarity of the bond [Citation28].
Figure 3. The coefficient µ as a function of the energy band gap.
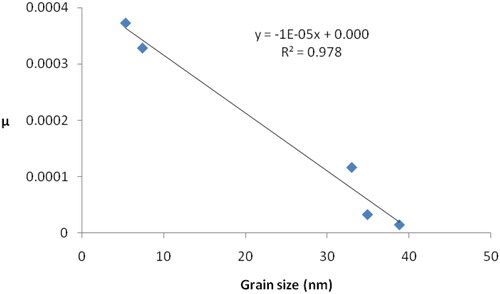
The silver oxide nanoparticles grain size has an important effect on the overall spectral and structural properties of the prepared Ag/Ag2O composites [Citation13]. Accordingly, we studied the effect of silver oxide grain size on the coefficient µ (). We notice that the coefficient µ decreases linearly with increasing grain size. The explanation for this is contained in our previous results [Citation13], where we found that increasing grain size is accompanied by an increase in the silver oxide content in the film, which in turn is accompanied by a decrease in the content of individual silver nanoparticles in the film. The decrease in the concentration of these nanoparticles will limit the decrease in the intensities of the peaks in the infrared spectra, and this in turn leads to obtaining smaller values of the coefficient µ. The effect of particle size is implicit in the linear relationship, as taking into account the data in , it can be seen that an increase in the energy gap is accompanied by a decrease in grain size
Figure 4. The coefficient µ as a function of the silver oxide grain size.
The effects of the attachment of the individual silver nanoparticles to a chemical group in the film also include the shift of the positions of the peaks of these bonds in the infrared spectra, especially the peak ɑ that we indicated in . displays the ɑ peak position as a function of the oxygen plasma power.
Figure 5. The peak ɑ position as a function of the oxygen plasma power.
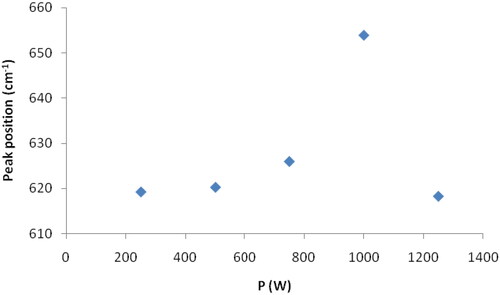
displays the peak α position as a function of the oxygen plasma power. We notice that, the peak position shifts towards higher wavenumbers (blue shift) when the oxygen plasma power increases, as the shift reaches its maxima when w = 1000 W. This is followed by a shift towards lower wavenumbers (red shift) when the power value becomes equal to 1250w. This behaviour is similar to that obtained in our previous work [Citation13] when studying the film content of individual silver nanoparticles as a function of the oxygen plasma power. This result is conclusive evidence that the shift of the peak α and the decrease in its intensity is a result of the attachment between silver oxide molecules and individual silver nanoparticles.
4. Conclusions
In this work we developed an understanding of the mechanism of the effect of silver nanoparticles on the infrared absorption spectra of silver oxide. Infrared absorption measurements were carried out on Ag/Ag2O composites rich in silver nanoparticles, which were prepared by treating thin films of silver with oxygen plasma afterglow of various powers. Important results obtained included the following:
The formation of individual silver nanoparticles Ag/Ag2O composites greatly affects the infrared spectra of these composites.
The effect of individual silver nanoparticles is greatest in the frequencies range of Ag–O bonds vibration and becomes weaker in the case of the bonds that have higher vibration energies.
The formation of individual silver nanoparticles leads to a decrease in the intensity of the infrared spectra and a shift of the peaks towards lower wavenumbers.
The coefficient µ, which expresses the decrease in intensity resulting from individual nanoparticles, is directly proportional to the band gap and inversely proportional to the size of the silver oxide grains.
The position of the peak ɑ is a convenient index to measure the effect of individual silver nanoparticles on the infrared spectra of silver oxide films.
Disclosure statement
No potential conflict of interest was reported by the author(s).
Data availability statement
All the data are included in the manuscript.
References
- Biswanath M, Moumita M. Nonvolatile memory device based on Ag nanoparticle: characteristics improvement. Appl Phys Lett. 2009;94:233–236.
- Li S, Gao B, Wang Y, et al. Antibacterial thin film nanocomposite reverse osmosis membrane by doping silver phosphate loaded graphene oxide quantum dots in polyamide layer. Desalination. 2019;464:94–104. doi: 10.1016/j.desal.2019.04.029.
- Dubas ST, Pimpan V. Humic acid assisted synthesis of silver nanoparticles and its application to herbicide detection. Mater Lett. 2008;62(17-18):2661–2663. doi: 10.1016/j.matlet.2008.01.033.
- Ravichandran S, Paluri V, Kumar G, et al. A novel approach for the biosynthesis of silver oxide nanoparticles using aqueous leaf extract of Callistemon lanceolatus (Myrtaceae) and their therapeutic potential. J Exp Nanosci. 2016;11(6):445–458. doi: 10.1080/17458080.2015.1077534.
- Hossain MK, Drmosh QA. Silver nanoparticles and nanorings for surface-enhanced Raman scattering. Plasmonics. 2022;17(3):1051–1064. doi: 10.1007/s11468-021-01572-w.
- Ling L, Feng Y, Li H, et al. Microwave induced surface enhanced pollutant adsorption and photocatalytic degradation on Ag/TiO2. Appl Surf Sci. 2019;483:772–778. doi: 10.1016/j.apsusc.2019.04.039.
- Wadayama H, Okabe T, Taniguchi J. Fabrication of multilayered structure of silver nanorod arrays for plasmon memory. Microelectron Eng. 2018;193:47–53. doi: 10.1016/j.mee.2018.02.020.
- Uğur Ş, Akaoğlu C, Küçükkahveci E. A study on film formation and fluorescence enhancement of PS latex/AgNPs composites depending on AgNPs content and annealing. Colloids Surf A. 2019;573:40–56. doi: 10.1016/j.colsurfa.2019.04.041.
- Li M, Wang Y, Xing Y, et al. P123-assisted preparation of Ag/Ag2O with significantly enhanced photocatalytic performance. Solid State Sci. 2020;99:106062. doi: 10.1016/j.solidstatesciences.2019.106062.
- Deepika, Dixit M, Singh H, et al. Recent innovations in properties of nanostructured glasses and composites. J Exp Nanosci. 2021;16(1):180–211. doi: 10.1080/17458080.2021.1940221.
- Deepika, Singh H, Saxena NS. Optical characterization of nanostructured Ge1 − xSnxSe2.5 (x = 0, 0.3, 0.5) films. Opt Quant Electron. 2019;51(1):11. doi: 10.1007/s11082-018-1717-4.
- Deepika, Singh H, Rathore KS. Study of the electrical and optical properties of Ge27Se58Pb15 chalcogenide glass. J Asian Ceram Soc. 2018;6(1):30–36. doi: 10.1080/21870764.2018.1439612.
- Kayed K. The optical properties of individual silver nanoparticles in Ag/Ag2O composites synthesized by oxygen plasma treatment of silver thin films. Plasmonics. 2020;15(5):1439–1449. doi: 10.1007/s11468-020-01169-9.
- Kayed K, Issa M, Alsoki E. The band gap of silver nanoparticles in Ag/Ag2O composites synthesized by oxygen plasma treatment of silver thin films. Plasmonics. 2023;18(2):711–717. doi: 10.1007/s11468-023-01800-5.
- Alkhawwam A, Abdallah B, Kayed K, et al. Effect of nitrogen plasma afterglow on amorphous carbon nitride thin films deposited by laser ablation. Acta Phys Pol A. 2011;120(3):545–551. doi: 10.12693/APhysPolA.120.545.
- Wang S, Wang Q, Hu YM, et al. Study on the synergistic co-pyrolysis behaviors of mixed rice husk and two types of seaweed by a combined TG-FTIR technique. J Anal Appl Pyrolysis. 2015;114:109–118. doi: 10.1016/j.jaap.2015.05.008.
- Paukshtis EA, Yaranova MA, Batueva IS, et al. A FTIR study of silanol nests over mesoporous silicate materials. Microporous Mesoporous Mater. 2019;288:109582.
- Devi RS, Venckatesh R, Sivaraj R. Synthesis of titanium dioxide nanoparticles by sol-gel technique. IJIRSET. 2014;03(08):15206–15211. doi: 10.15680/IJIRSET.2014.0308020.
- Rahman MM, Khan SB, Jamal A, et al. Fabrication of highly sensitive acetone sensor based on sonochemically prepared as-grown Ag2O nanostructures. Chem Eng J. 2012;192:122–128. doi: 10.1016/j.cej.2012.03.045.
- Tunç S, Duman O. The effect of different molecular weight of poly (ethylene glycol) on the electrokinetic and rheological properties of Na-bentonite suspensions. Colloids Surf A Physicochem Eng Aspects. 2008;317(1-3):93–99. doi: 10.1016/j.colsurfa.2007.09.039.
- Nasab NK, Sabouri Z, Ghazal S, et al. Greenbased synthesis of mixed-phase silver nanoparticles as an effective photocatalyst and investigation of their antibacterial properties. J Mol Struct. 2020;1203:127411–127420. doi: 10.1016/j.molstruc.2019.127411.
- Hassan Afandy H, Sabir DK, Aziz SB. Antibacterial activity of the green synthesized plasmonic silver nanoparticles with crystalline structure against gram-positive and gram-negative bacteria. Nanomaterials. 2023;13(8):1327. doi: 10.3390/nano13081327.
- Yan J-K, Cai P-F, Cao X-Q, et al. Green synthesis of silver nanoparticles using 4-acetamido-TEMPO-oxidized curdlan. Carbohydr Polym. 2013;97(2):391–397. doi: 10.1016/j.carbpol.2013.05.049.
- Aziz B, Hussein S, Brza G, et al. Fabrication of interconnected plasmonic spherical silver nanoparticles with enhanced localized surface plasmon resonance (LSPR) peaks using quince leaf extract solution. Nanomaterials. 2019;9(11):1557. doi: 10.3390/nano9111557.
- Zhou Y, Tang RC. Facile and eco-friendly fabrication of colored and bioactive silk materials using silver nanoparticles synthesized by two flavonoids. Polymers. 2018;10(4):404. doi: 10.3390/polym10040404.
- Scherrer P. Bestimmung der inneren struktur und der größe vonKolloidteilchen mittels röntgenstrahlen. In: Kolloidchemie ein lehrbuch. Springer; 1912. pp. 387–409.
- Mott NF, Davis EA. Electronic properties in non-crystalline materials. London: Oxford University Press; 1971.
- Liu X. Organic chemistry I. Kwantlen Polytechnic University; 2021.