
 ?Mathematical formulae have been encoded as MathML and are displayed in this HTML version using MathJax in order to improve their display. Uncheck the box to turn MathJax off. This feature requires Javascript. Click on a formula to zoom.
ABSTRACT
We used the model output to explore relationships between EEEV occurrence and environmental factors, as well as generated risk maps for each season. We also introduced a normalized difference risk index to identify locations with high risk during both seasons. LULC variables were better predictors of EEEV than bioclimatic or topographic variables. Summer cases occurred in locations that were in or near rural lands at high elevations that were near woody wetlands and coniferous forests, while winter cases occurred primarily in areas with large proportions of evergreen forests and rural land. Because EEEV is often fatal to both horses and humans, the goal was to provide more accurate EEEV risk maps for each season to guide disease management and vector control efforts.
KEYWORDS:
Introduction
Eastern equine encephalitis virus (EEEV) is the most pathogenic mosquito-borne virus in the United States, affecting humans, horses, and a variety of wild and domestic animals in eastern North America (Bigler et al., Citation1976; Honnold et al., Citation2015; Wilson et al., Citation1986). Florida historically carries a high proportion of the nation’s caseload, averaging two human cases and over 60 equine cases annually (Bingham et al., Citation2014; Lindsey et al., Citation2018). While the majority of EEEV infections in humans present as self-resolving febrile illnesses or asymptomatic cases, about 70% of neuroinvasive infections lead to mortality with the remainder typically associated with life-long complications (Armstrong & Andreadis, Citation2013). Likewise, mortality rates in unvaccinated horses have been estimated upwards of 90% (Barba et al., Citation2019; Rocheleau et al., Citation2017).
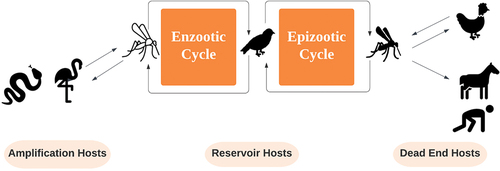
EEEV is transmitted by mosquitoes through a complex cycle involving avian, mammalian, and reptilian hosts (Burkett-Cadena et al., Citation2022; Heberlein-Larson et al., Citation2019) (). EEEV transmission is observed most often during summer but occurs year-round in Florida, involving multiple vectors and hosts that can vary both seasonally and spatially. EEEV is maintained in an enzootic cycle through transmission to birds by the mosquito Culiseta melanura (Bingham et al., Citation2014; Molaei et al., Citation2006), with this cycle supporting the overwintering of the virus in birds and reptiles. The epizootic cycle is largely carried out by mosquitoes of the genera Aedes, Culex, and Coquillettidia, which feed on both birds and mammals, including humans, especially during the summer (C. Mitchell et al., Citation1992; C. J. Mitchell et al., Citation1993; Reeves et al., Citation2019). Case counts in the state have been associated with warm temperatures, fluctuating precipitation patterns, and shifts in the southern oscillation index (Miley et al., Citation2020; Mundis et al., Citation2022), as well as vector abundance (Blosser et al., Citation2017; Miley et al., Citation2021). Transmission in Florida is also associated with rural landcover which is more likely to support horses; wetlands, which support mosquito vectors; and forests, which support abundant wild bird hosts (Burkett-Cadena et al., Citation2015; P. T. Vander Kelen, Downs, Stark et al., Citation2012). As research links most of the EEEV strains circulating across the eastern United States to progenitor isolates from Florida during wintertime via migratory birds (White et al., Citation2011), predicting the seasonal, spatial distribution of EEEV in Florida is a critical for preventing its spread.
Figure 1. Transmission cycle of EEEV in Florida.
Two approaches have been used map the spatial distribution of EEEV across the state. P. Vander Kelen et al. (Citation2014) and Downs et al. (Citation2018) developed and tested a risk index model to map EEEV using estimated linear relationships between land use/land cover (LULC) factors associated with horse cases. This model was used to design disease surveillance networks (Downs et al., Citation2020) and assess transmission risk on equestrian trails (Downs et al., Citation2021), though improvements might be possible by using more robust modelling approaches that do not assume linear relationships between occurrence and environmental factors. For example, maximum entropy, or Maxent, models presence based upon quantified relationships with environmental factors that can be expressed as linear, quadratic, product, threshold, or hinge features (Ansari et al., Citation2022; Phillips & Dudík, Citation2008; Phillips et al., Citation2006; Stevens & Pfeiffer, Citation2011). Burch et al. (Citation2020) used Maxent to map EEEV in Florida using bioclimatic data. Maxent is one of the most successfully applied approaches to map arthropod-borne disease distributions using solely bioclimatic variables (e.g. Pramanik et al., Citation2021; Slater et al., Citation2012; Thameur et al., Citation2019), because populations of vectors like mosquitoes and ticks often respond to continuous climatological variables like temperature and precipitation (Desrochers, Citation2015; Lippi et al., Citation2023). However, the accuracy of that model was relatively low, suggesting improvement is needed. Maxent models like these can often be improved by including additional factors, such as those related to habitat or topography (Beeman et al., Citation2021; Rodgers et al., Citation2022), or by running separate models by season (Manyangadze et al., Citation2016; Suárez-Seoane et al., Citation2008). In this study, we used Maxent with bioclimatic, LULC, and topographic variables to map EEEV transmission to horses, and by proxy humans, during both summer and winter seasons. The goal was to provide more accurate EEEV risk maps for each season to guide disease management and vector control efforts across the state.
Methods
Study area
Florida is located in the southeastern United States, bordered by the Gulf of Mexico on the west and Atlantic Ocean on the east, and bounded approximately by latitudes of 24.5 and 30.7 degrees North and longitudes of 82.5° and 87.4° West. Florida is also characterized by flat, low-lying topography with elevations mostly below 100 meters. Florida exhibits hot, humid summers that extend from April to October and mild winters encompassing November through March. Florida supports sub-tropical ecosystems in the north which transition into tropical ecosystems in the southernmost tip of the state. Land use/land cover is approximately 30% forest, 30% wetland, 20% agricultural, and 16% urban, with smaller amounts of other upland types (Volk et al., Citation2017).
Occurrence data
EEEV is a reportable disease in the United States. We used reported cases of EEE in horses as our occurrence data, as obtained by the Florida Department of Health. The dataset contained 676 individual cases reported during 2010–2018, of which 610 were from summer (April through October) and 66 from winter (November through March). Cases spanned the state, though cases were more concentrated in the north and central regions compared to the south (). Case information included date and geographic coordinates of known or suspected location of infection.
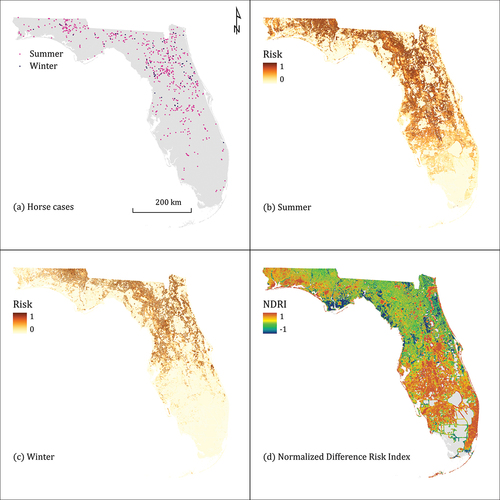
Figure 2. Summer and winter horse cases of EEEV in Florida during 2010–2018 (a) and their associated predicted summer risk (b), winter risk (c), and normalized difference risk index (d).
Environmental data
We compiled bioclimatic, LULC, and topographic variables from several sources. We used bioclimatic variables from WorldClim (WorldClim.org) which includes 19 standard measurements based upon temperature and precipitation data. Many of the bioclimatic variables are highly correlated with one another since they are derived from the same input data. As collinearity can make relationships between occurrence and environmental factors difficult to discern in Maxent models, we chose to include one precipitation variable, one temperature variable, and one measure of seasonality to facilitate clearer interpretation of model results. To select these variables, we ran single-variable Maxent models using each of the 19 bioclimatic factors and choose the ones that produced the highest AUC in each category. The selected factors included annual precipitation, mean temperature driest quarter, and isothermality.
We used LULC data from the 2016 National Land Use/Land Cover database for Florida (www.mrlc.gov) which recorded LULC types using an Anderson Level II classification at a 30-m resolution. We utilized five LULC variables that have previously been associated with EEEV in Florida: rural land (agricultural, crops and pasture, and low density residential), emergent wetlands, woody wetlands, open water, and evergreen forest. First, we generated proximity variables from the LULC data by calculating the Euclidean distance between each raster cell and the nearest cell classified as one of the five LULC types. Second, we derived habitat composition variables by calculating the proportion of habitat within 1500 m of each raster cell that was comprised of each of those same LULC types. A window of 1500 m was used since that is a commonly accepted estimate of EEEV mosquito flight distances. Additionally, we used a canopy coverage layer as a measure of relative forest cover. A canopy cover layer was obtained from the United States Forest Service and smoothed using a 100-m moving window so the values more closely aligned with tree cover in the LULC map. Finally, we included elevation as a topographic variable, using elevation data from the University of Florida GeoPlan Center, as archived at the Florida Digital Geographic Data Library (www.fgdl.org). We converted all layers to a 30-m spatial resolution and ensured their extents matched the NLCD layer in preparation for analysis. All data processing was completed in a geographic information system (ArcGIS Pro 3.0, ESRI, Inc.).
Analysis
We applied Maxent to our occurrence data and 15 environmental layers using utilizing Maxent software version 3.4 (http://biodiversityinformatics.amnh.org). We ran separate Maxent models for winter and summer data. We specified a logistic transformation for the output because it is easy to interpret in terms of probability of presence and it does not tend to over amplify high presence areas. We allowed the model to use any standard feature functions (linear, quadratic, product, and hinge). All other default values were accepted. We tested the predictive performance of the model using a cross-validation procedure using 70% of the occurrence points as training data and 30% of points as test data. We assessed model accuracy using an AUC value from a receiver operating characteristics (ROC) curve, which measures the model’s ability to separate presences from absences on a relative scale of 0 to 1. We evaluated the model’s performance by plotting testing and training omission versus predicted area. We measured the contributions of each variable to the final model using permutation importance, which is calculated by randomly permuting the values for each variable for both the training and testing data and measuring the corresponding decrease in AUC. We ran a jackknife test of variable importance to identify variables that contributed the most useful information to the model in terms of providing the highest gains when used in isolation. We then reported the percent contribution of each variable to the final model. Finally, we interpreted the relationships between variables and predicted presence using the resulting response curves.
Finally, we mapped the summer and winter predictions to understand the spatial distribution of risk across Florida. We considered the predicted occurrence as an index of EEEV risk. We also created an index to measure the differences in risk by season. For this purpose, we introduced a Normalized Difference Risk Index (NDRI), calculated for each raster cell in the map as eq. (1):
where is the summer risk value and
is the winter risk value. This index allows us to map all combinations of seasonal risk, i.e. where risk is high in both seasons, low in both seasons, or high in one and low in the other.
Results
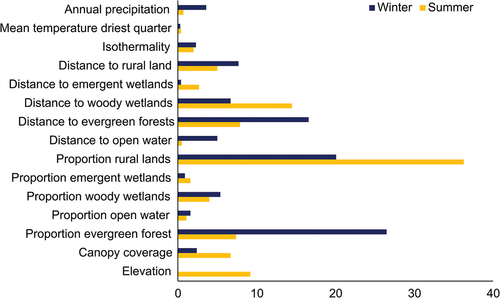
The overall AUC values were 0.86 for training and 0.84 for testing for the summer model, and 0.94 and 0.88, respectively, for the winter model. The jackknife tests identified the proportion of rural land as the variable most important to the summer model and distance to evergreen forest for the winter model (). In both seasons, the bioclimatic variables produced relatively little in terms of model gain in comparison to the LULC variables. Variables that contributed the most to the summer model, measured according to percent contribution, were proportion rural lands, distance to woody wetlands, elevation, and distance to evergreen forests, while the least influential included distance to open water and the three bioclimatic variables (). Proportion evergreen, proportion rural, and distance to evergreen forests contributed the most to the winter model, with mean temperature driest quarter, distance to emergent wetlands, and proportion emergent the contributing the least. The factors contributing the least in summer were the three bioclimatic variables and two variables related to open water, all contributing ≤ 2% to the model. During winter, elevation, mean temperature driest quarter, distance to emergent wetland, proportion emergent wetland, and proportion emergent wetlands contributed ≤ 2% to the model.
Figure 3. Jackknife regularized training gain for 15 environmental variables used to predict EEEV occurrence in horses in Florida using maxent during summer (a) and winter (b).
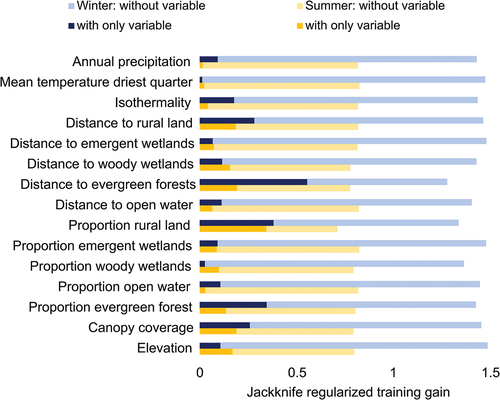
Figure 4. Percent contribution of 15 environmental variables used to predict summer and winter occurrence of eastern equine encephalitis virus cases in horses in Florida using a maxent model.
Response curves showed how each variable in isolation affects the Maxent predictions when all other factors are held constant (). The response curves showed similar relationships between environmental factors and occurrence across seasons, though the shapes and magnitudes of the curves differed somewhat. The largest observed difference between seasons was for mean temperature driest quarter, where risk was highest in summer where values were in the middle of the range and highest in winter where they were coldest. Predicted risk was highest in moderate values of annual precipitation and isothermality. Across both seasons, risk was predicted to be highest in areas near moderate proportions of rural lands and close to high proportions of evergreen forests and wetlands. There was also a positive association with higher elevations during both seasons.
Figure 5. Single variable response curves for 15 environmental variables used to predict EEEV occurrence in horses in Florida using maxent during summer (dotted lines) and winter (solid lines).
The resulting maps showed differences in predicted risk in Florida, both geographically and seasonally. Summertime risk was widespread, with relatively high risk throughout much of the north and central regions (). Risk was generally low in the southern portion of the state. Wintertime risk was more concentrated northward, with the highest areas in the central and upper panhandle areas (). The NDRI map highlights similarities and differences in risk by season (). Areas mapped in green had relative high risk during both seasons, covering much of the northern part of the state. Areas mapped in red had higher risk in the summer compared to winter; these areas occurred primarily in western Florida and the south. Areas mapped in blue had higher risk in winter compared to summer, and these mostly occurred in coastal regions in the panhandle and central portions of the state, with some isolated inland locations. Areas in grey indicate risk was measured as zero during both seasons, which resulted in a null value for the NDRI.
Discussion
Investigation of LULC and climate variables is integral in evaluating vector-borne illnesses such as EEEV, as predictive models can allow preventative actions that reduce risk (Cheong et al., Citation2013; Huang et al., Citation2015; Lowe et al., Citation2018; Ludwig et al., Citation2019). Environmental data, like LULC and topography, provide information for mapping where habitats associated with vectors and hosts occur (Acheson, Citation2002; Blosser et al., Citation2017; Skaff et al., Citation2017), while climatological variables can describe environmental conditions that are associated with disease transmission, particularly for those that are associated with particular patterns of rainfall and temperature (Ciota & Keyel, Citation2019; Mundis et al., Citation2022). Collectively, environmental and climatological data can describe the conditions that are conducive to creating optimal breeding habitats for vector populations to thrive and transmit viruses to hosts.
The results from the seasonal Maxent models support previous research on the importance of certain LULC types for EEEV transmission, including rural lands, coniferous forests, and woody wetlands (Burkett-Cadena et al., Citation2015; Miley et al., Citation2021; P. T. Vander Kelen, Downs, Burkett-Cadena, et al., Citation2012). Although the bioclimatic variables contributed only small amounts to the final Maxent models, this does not imply those variables are not important to EEEV transmission. It could suggest that either broad scale patterns of temperature and precipitation are not very good predictors of EEEV cases in comparison to fine-scale weather patterns that occur in a given year, or that there are unmeasured spatial associations between LULC and climate. The differences between the summer and winter models suggest that there is a linkage between LULC and seasonal climatic patterns. Specifically, the output suggests that different forested habitats are the major sites of EEEV transmission in the winter versus summer months. Winter cases were more associated with evergreen forests, while summer cases were more commonly associated with woody wetlands and coniferous forests. The biological and ecological reasons for this shift will need additional study. However, previous work may shed some light on the biological and ecological underpinnings of this shift, offering testable hypotheses for why this occurs.
The major enzootic vector for EEEV, Cs. melanura, is known to be found throughout many forested habitats in Florida, where it lays its eggs primarily in small acidic pools of rainwater on the forest floor (Burkett-Cadena et al., Citation2015). As Florida usually has a wet season in the summer driven by seasonal thunderstorms and a dry season in the winter, it is possible that the differences in rainfall result in changes in the location of pools of rainwater, thereby shifting the location of Cs. melanura breeding sites. Cs. melanura also feeds primarily on birds, with passerine birds being preferred hosts through much of the year (Burkett-Cadena et al., Citation2015; Molaei et al., Citation2013). Several migratory passerine species over winter in Florida and previous studies have shown that these migratory species are fed upon by Cs. melanura (West et al., Citation2020), the changes in host use may be associated with the shifts in EEEV transmission seen. Changes in avian host behaviour may also drive the shift in EEEV transmission. For example, the Northern Cardinal is a major host species for Cs. melanura and has been implicated as an important avian host for the virus (Estep et al., Citation2013). Cardinals exhibit different behaviours during the summer and winter months. In the winter, cardinals congregate in flocks that feed together. In the late winter, the flocks disperse and display regularly by calling from visible high branches, such those found in evergreen forests, to attract a mate. Once they pair up, they retreat to more densely vegetated habitats, like woody wetlands, to build nests and raise their young (Conservancy, Citation2024). Such behavioural shifts may also be responsible for the habitat shifts uncovered by the Maxent model. More field research, including Cs. melanura collections and analyses in both woody wetland and evergreen forested habitats throughout the year, will be necessary to test these multiple hypotheses.
Despite uncertainties in the seasonal mechanisms driving patterns of EEEV transmission in Florida, the overall performance of our winter and summer models of EEEV risk in Florida is considered excellent based on AUC values ≥ 0.85 (Mandrekar, Citation2010). Because Burch et al. (Citation2020) model produced an AUC of 0.77, the risk maps produced in this study are likely more reliable. Including LULC and topographic variables in addition to the bioclimatic ones, modelling nonlinear relationships, and running separate models for each season explain the improved accuracy. Ultimately, accurate risk maps provide practical information to health officials, researchers, and land managers who need to understand the spatial distribution of EEEV. These maps can help identify priority locations for mosquito control, disease surveillance, or public outreach during each season of the year. In addition to seasonal maps, we developed an NDRI map that aggregates the seasonal information into a single map that identifies where risk is highest during both seasons. This might be useful when designing labour intensive EEEV surveys, because it may be more efficient to sample in areas where activity is expected during both seasons. Future work might aim to connect spatial assessment of risk with those that use meteorological data to predict the timing of increased disease transmission or explore how changes in LULC affect the distribution of EEEV across the state. For example, climatic factors and the potential for a change in habitat suitability via warming trends may allow for EEEV establishment in naive areas, providing a new habitat for the primary vector Cs. melanura and alternative bridge vector species mosquitoes to thrive, so risk maps can help predict future areas of concern (Slater et al., Citation2012).
Disclosure statement
No potential conflict of interest was reported by the author(s).
References
- Acheson, D.W. (2002). Food safety: Bovine spongiform encephalopathy (mad cow disease). Nutrition Today, 37(1), 19–25. https://doi.org/10.1097/00017285-200201000-00007
- Ansari, M., Soriano-Paños, D., Ghoshal, G., & White, A.D. (2022). Inferring spatial source of disease outbreaks using maximum entropy. Physical Review E, 106(1), 014306. https://doi.org/10.1103/PhysRevE.106.014306
- Armstrong, P.M., & Andreadis, T.G. (2013). Eastern equine encephalitis virus–old enemy, new threat. The New England Journal of Medicine, 368(18), 1670–1673. https://doi.org/10.1056/NEJMp1213696
- Barba, M., Fairbanks, E.L., & Daly, J.M. (2019). Equine viral encephalitis: Prevalence, impact, and management strategies. Veterinary Medicine (Auckl), 10, 99–110. https://doi.org/10.2147/vmrr.S168227
- Beeman, S.P., Morrison, A.M., Unnasch, T.R., Unnasch, R.S., & Silva, D.D.P. (2021). Ensemble ecological niche modeling of West Nile virus probability in Florida. Public Library of Science ONE, 16(10), e0256868. https://doi.org/10.1371/journal.pone.0256868
- Bigler, W.J., Lassing, E.B., Buff, E.E., Prather, E.C., Beck, E.C., & Hoff, G.L. (1976). Endemic eastern equine encephalomyelitis in Florida: A twenty-year analysis, 1955-1974. The American Journal of Tropical Medicine and Hygiene, 25(6), 884–890. https://doi.org/10.4269/ajtmh.1976.25.884
- Bingham, A.M., Burkett-Cadena, N.D., Hassan, H.K., McClure, C.J., & Unnasch, T.R. (2014). Field investigations of winter transmission of eastern equine encephalitis virus in Florida. The American Journal of Tropical Medicine and Hygiene, 91(4), 685. https://doi.org/10.4269/ajtmh.14-0081
- Blosser, E.M., Lord, C.C., Stenn, T., Acevedo, C., Hassan, H.K., Reeves, L.E., Unnasch, T.R., & Burkett-Cadena, N.D. (2017). Environmental drivers of seasonal patterns of host utilization by culiseta melanura (diptera: Culicidae) in Florida. Journal of Medical Entomology, 54(5), 1365–1374. https://doi.org/10.1093/jme/tjx140
- Burch, C., Loraamm, R., Unnasch, T., & Downs, J. (2020). Utilizing ecological niche modelling to predict habitat suitability of eastern equine encephalitis in Florida. Annals of GIS, 26(2), 133–147. https://doi.org/10.1080/19475683.2020.1730962
- Burkett-Cadena, N.D., Bingham, A.M., Hunt, B., Morse, G., & Unnasch, T.R. (2015). Ecology of culiseta melanura and other mosquitoes (diptera: Culicidae) from Walton County, Florida during Winter period 2013-2014. Journal of Medical Entomology, 52(5), 1074–1082. https://doi.org/10.1093/jme/tjv087
- Burkett-Cadena, N.D., Day, J.F., Unnasch, T.R., & Andreadis, T. (2022). Ecology of eastern equine encephalitis virus in the southeastern United States: Incriminating vector and host species responsible for virus amplification, persistence, and dispersal. Journal of Medical Entomology, 59(1), 41–48. https://doi.org/10.1093/jme/tjab076
- Cheong, Y.L., Burkart, K., Leitao, P.J., & Lakes, T. (2013). Assessing weather effects on dengue disease in Malaysia. International Journal of Environmental Research and Public Health, 10(12), 6319–6334. https://doi.org/10.3390/ijerph10126319
- Ciota, A.T., & Keyel, A.C. (2019). The role of temperature in the transmission of zoonotic arboviruses. Viruses, 11(11), 1013. https://doi.org/10.3390/v11111013
- Conservancy, A.B. (2024). Northern Cardinal https://abcbirds.org/bird/northern-cardinal/#:~:text=During%20the%20winter%2C%20however%2C%20Northern,often%20be%20spotted%20feeding%20together.
- Desrochers, R. (2015). Increasing capacity in disease vector modelling to improve malaria and arbovirus mitigation strategies: Final technical progress report (May 1, 2013-march 30, 2015).
- Downs, J., Vaziri, M., Deskins, G., Kellner, W., Miley, K., & Unnasch, T.R. (2020). Optimizing arbovirus surveillance using risk mapping and coverage modelling. Annals of GIS, 26(1), 13–23. https://doi.org/10.1080/19475683.2019.1688391
- Downs, J., Vaziri, M., Jenkins, A., & Unnasch, T. (2018). Validation of a risk index model for predicting eastern equine encephalitis virus transmission to horses in Florida. Journal of Medical Entomology, 55(5), 1143–1149. https://doi.org/10.1093/jme/tjy067
- Downs, J., Vaziri, M., Lavallin, A.V., Miley, K., & Unnasch, T.R. (2021). Mapping eastern equine encephalitis virus risk on equestrian trails in Florida state parks. Journal of Park Recreation Administration, 39(4), 170–180. https://doi.org/10.18666/JPRA-2021-10447
- Estep, L.K., McClure, C.J., Vander Kelen, P., Burkett-Cadena, N.D., Sickerman, S., Hernandez, J., Jinright, J., Hunt, B., Lusk, J., Hoover, V., Armstrong, K., Stark, L.M., Hill, G.E., Unnasch, T.R., & Coffey, L.L. (2013). Risk of exposure to eastern equine encephalomyelitis virus increases with the density of northern cardinals. Public Library of Science ONE, 8(2), e57879. https://doi.org/10.1371/journal.pone.0057879
- Heberlein-Larson, L.A., Tan, Y., Stark, L.M., Cannons, A.C., Shilts, M.H., Unnasch, T.R., & Das, S.R. (2019). Complex epidemiological dynamics of eastern equine encephalitis virus in Florida. The American Journal of Tropical Medicine and Hygiene, 100(5), 1266–1274. https://doi.org/10.4269/ajtmh.18-0783
- Honnold, S.P., Mossel, E.C., Bakken, R.R., Lind, C.M., Cohen, J.W., Eccleston, L.T., Spurgers, K.B., Erwin-Cohen, R., Glass, P.J., & Maheshwari, R.K. (2015). Eastern equine encephalitis virus in mice II: Pathogenesis is dependent on route of exposure. Virology Journal, 12(1), 154. https://doi.org/10.1186/s12985-015-0385-2
- Huang, X., Clements, A.C., Williams, G., Devine, G., Tong, S., & Hu, W. (2015). El Niño-Southern Oscillation, local weather and occurrences of dengue virus serotypes. Scientific Reports, 5(1), 16806. https://doi.org/10.1038/srep16806
- Lindsey, N.P., Staples, J.E., & Fischer, M. (2018). Eastern equine encephalitis virus in the United States, 2003-2016. The American Journal of Tropical Medicine Hygiene, 98(5), 1472–1477. https://doi.org/10.4269/ajtmh.17-0927
- Lippi, C.A., Mundis, S.J., Sippy, R., Flenniken, J.M., Chaudhary, A., Hecht, G., Carlson, C.J., & Ryan, S.J. (2023). Trends in mosquito species distribution modeling: Insights for vector surveillance and disease control. Parasites & Vectors, 16(1), 302. https://doi.org/10.1186/s13071-023-05912-z
- Lowe, R., Gasparrini, A., Van Meerbeeck, C.J., Lippi, C.A., Mahon, R., Trotman, A.R., Rollock, L., Hinds, A.Q.J., Ryan, S.J., Stewart-Ibarra, A.M., & Thomson, M. (2018). Nonlinear and delayed impacts of climate on dengue risk in Barbados: A modelling study. PloS Medicine, 15(7), e1002613. https://doi.org/10.1371/journal.pmed.1002613
- Ludwig, A., Zheng, H., Vrbova, L., Drebot, M.A., Iranpour, M., & Lindsay, L.R. (2019). Increased risk of endemic mosquito-borne diseases in Canada due to climate change. Canada communicable disease report = Releve des maladies transmissibles au Canada. Canada Communicable Disease Report, 45(4), 91–97. https://doi.org/10.14745/ccdr.v45i04a03
- Mandrekar, J. (2010). Receiver operating characteristic curve in diagnostic test assessment. Journal of Thoracic Oncology: Official Publication of the International Association for the Study of Lung Cancer, 5(9), 1315–1316. https://doi.org/10.1097/JTO.0b013e3181ec173d
- Manyangadze, T., Chimbari, M.J., Gebreslasie, M., Ceccato, P., & Mukaratirwa, S. (2016). Modelling the spatial and seasonal distribution of suitable habitats of schistosomiasis intermediate host snails using maxent in Ndumo area, KwaZulu-Natal Province, South Africa. Parasites & Vectors, 9(1), 1–10. https://doi.org/10.1186/s13071-016-1834-5
- Miley, K.M., Downs, J., Beeman, S.P., Unnasch, T.R., & van den Hurk, A. (2020). Impact of the Southern Oscillation index, temperature, and precipitation on eastern equine encephalitis virus activity in Florida. Journal of Medical Entomology, 57(5), 1604–1613. https://doi.org/10.1093/jme/tjaa084
- Miley, K.M., Downs, J., Burkett-Cadena, N.D., West, R.G., Hunt, B., Deskins, G., Kellner, B., Fisher-Grainger, S., Unnasch, R.S., Unnasch, T.R.J., & Fonseca, D. (2021). Field analysis of biological factors associated with sites at high and low to moderate risk for eastern equine encephalitis virus winter activity in Florida. Journal of Medical Entomology, 58(6), 2385–2397. https://doi.org/10.1093/jme/tjab066
- Mitchell, C.J., McLean, R.G., Nasci, R.S., Crans, W.J., Smith, G.C., & Caccamise, D.F. (1993). Susceptibility parameters of aedes albopictus to per oral infection with eastern equine encephalitis virus. Journal of Medical Entomology, 30(1), 233–235. https://doi.org/10.1093/jmedent/30.1.233
- Mitchell, C., Niebylski, M., Smith, G., Karabatsos, N., Martin, D., Mutebi, J., Craig, G., Jr., & Mahler, M. (1992). Isolation of eastern equine encephalitis virus from aedes albopictus in Florida. Science, 257(5069), 526–527. https://doi.org/10.1126/science.1321985
- Molaei, G., Andreadis, T.G., Armstrong, P.M., Thomas, M.C., Deschamps, T., Cuebas-Incle, E., Montgomery, W., Osborne, M., Smole, S., Matton, P., Andrews, W., Best, C., Cornine, F. 3rd, Bidlack, E., & Texeira, T. (2013). Vector-host interactions and epizootiology of eastern equine encephalitis virus in Massachusetts. Vector Borne and Zoonotic Diseases (Larchmont, NY), 13(5), 312–323. https://doi.org/10.1089/vbz.2012.1099
- Molaei, G., Oliver, J., Andreadis, T.G., Armstrong, P.M., & Howard, J.J. (2006). Molecular identification of blood-meal sources in Culiseta melanura and Culiseta morsitans from an endemic focus of eastern equine encephalitis virus in New York. The American Journal of Tropical Medicine and Hygiene, 75(6), 1140–1147. https://doi.org/10.4269/ajtmh.2006.75.1140
- Mundis, S.J., Harrison, S., Pelley, D., Durand, S., Ryan, S.J., & Andreadis, T. (2022). Spatiotemporal environmental drivers of eastern equine encephalitis virus in central Florida: Towards a predictive model for a lethal disease. Journal of Medical Entomology, 59(5), 1805–1816. https://doi.org/10.1093/jme/tjac113
- Phillips, S.J., Anderson, R.P., & Schapire, R.E. (2006). Maximum entropy modeling of species geographic distributions. Ecological Modelling, 190(3), 231–259. https://doi.org/10.1016/j.ecolmodel.2005.03.026
- Phillips, S.J., & Dudík, M. (2008). Modeling of species distributions with maxent: New extensions and a comprehensive evaluation. Holarctic Ecology, 31(2), 161–175. https://doi.org/10.1111/j.0906-7590.2008.5203.x
- Pramanik, M., Singh, P., & Dhiman, R.C. (2021). Identification of bio-climatic determinants and potential risk areas for Kyasanur forest disease in southern India using MaxEnt modelling approach. BMC Infectious Diseases, 21(1), 1–15. https://doi.org/10.1186/s12879-021-06908-9
- Reeves, L.E., Hoyer, I., Acevedo, C., & Burkett-Cadena, N.D. (2019). Host associations of Culex (melanoconion) atratus (diptera: Culicidae) and Culex (melanoconion) pilosus from Florida, USA. Insects, 10(8), 239. https://doi.org/10.3390/insects10080239
- Rocheleau, J.P., Arsenault, J., Ogden, N.H., Lindsay, L.R., Drebot, M., & Michel, P. (2017). Characterizing areas of potential human exposure to eastern equine encephalitis virus using serological and clinical data from horses. Epidemiology & Infection, 145(4), 667–677. https://doi.org/10.1017/s0950268816002661
- Rodgers, M.D.S.M., Fonseca, E., Del Mar Nieto, P., Malone, J.B., Luvall, J.C., McCarroll, J.C., Avery, R.H., Bavia, M.E., Guimaraes, R., Wen, X., Silva, M.M.N., Carneiro, D.D.M.T., & Cardim, L.L. (2022). Use of soil moisture active passive satellite data and WorldClim 2.0 data to predict the potential distribution of visceral leishmaniasis and its vector Lutzomyia longipalpis in Sao Paulo and Bahia states, Brazil. Geospatial Health, 17(1). https://doi.org/10.4081/gh.2022.1095
- Skaff, N.K., Armstrong, P.M., Andreadis, T.G., & Cheruvelil, K.S. (2017). Wetland characteristics linked to broad-scale patterns in Culiseta melanura abundance and eastern equine encephalitis virus infection. Parasites & Vectors, 10(1), 501. https://doi.org/10.1186/s13071-017-2482-0
- Slater, H., Michael, E., & Baylis, M. (2012). Predicting the current and future potential distributions of lymphatic filariasis in Africa using maximum entropy ecological niche modelling. Public Library of Science ONE, 7(2), e32202. https://doi.org/10.1371/journal.pone.0032202
- Stevens, K.B., & Pfeiffer, D.U. (2011). Spatial modelling of disease using data-and knowledge-driven approaches. Spatial Spatio-Temporal Epidemiology, 2(3), 125–133. https://doi.org/10.1016/j.sste.2011.07.007
- Suárez-Seoane, S., de la Morena, E.L.G., Prieto, M.B.M., Osborne, P.E., & de Juana, E. (2008). Maximum entropy niche-based modelling of seasonal changes in little bustard (tetrax tetrax) distribution. Ecological Modelling, 219(1–2), 17–29. https://doi.org/10.1016/j.ecolmodel.2008.07.035
- Thameur, B.H., Salah, H., & Soufiène, S. (2019). Predicting current and future distribution of West Nile disease in Tunisia. International Journal of Mosquito Research, 6(5), 48–56.
- Vander Kelen, P.T., Downs, J.A., Burkett-Cadena, N.D., Ottendorfer, C.L., Hill, K., Sickerman, S., Hernandez, J., Jinright, J., Hunt, B., Lusk, J., Hoover, V., Armstrong, K., Unnasch, R.S., Stark, L.M., & Unnasch, T.R. (2012). Habitat associations of eastern equine encephalitis transmission in Walton County Florida. Journal of Medical Entomology, 49(3), 746–756. https://doi.org/10.1603/ME11224
- Vander Kelen, P.T., Downs, J.A., Stark, L.M., Loraamm, R.W., Anderson, J.H., & Unnasch, T.R. (2012). Spatial epidemiology of eastern equine encephalitis in Florida. International Journal of Health Geographics, 11(1), 47. https://doi.org/10.1186/1476-072X-11-47
- Vander Kelen, P., Downs, J.A., Unnasch, T., & Stark, L. (2014). A risk index model for predicting eastern equine encephalitis virus transmission to horses in Florida. Applied Geography, 48, 79–86. https://doi.org/10.1016/j.apgeog.2014.01.012
- Volk, M.I., Hoctor, T.S., Nettles, B.B., Hilsenbeck, R., Putz, F.E., & Oetting, J. (2017). Florida land use and land cover change in the past 100 years. Florida’s Climate: Changes, Variations, Impacts. Retrieved from http://purl.flvc.org/fsu/fd/FSU_libsubv1_scholarship_submission_1515440747_56b1ed92
- West, R.G., Mathias, D.K., Day, J.F., Acevedo, C., Unnasch, T.R., Burkett-Cadena, N.D., & Andreadis, T. (2020). Seasonal changes of host use by culiseta melanura (diptera: Culicidae) in central Florida. Journal of Medical Entomology, 57(5), 1627–1634. https://doi.org/10.1093/jme/tjaa067
- White, G.S., Pickett, B.E., Lefkowitz, E.J., Johnson, A.G., Ottendorfer, C., Stark, L., & Unnasch, T.R. (2011). Phylogenetic analysis of eastern equine encephalitis virus isolates from Florida. Journal of Tropical Medicine and Hygeine, 84(5), 709–717. https://doi.org/10.4269/ajtmh.2011.10-0267
- Wilson, J.H., Rubin, H.L., Lane, T.J., & Gibbs, E.P.J. (1986). A survey of eastern equine encephalomyelitis in Florida horses: Prevalence, economic impact, and management practices, 1982–1983. Preventive Veterinary Medicine, 4(3), 261–271. https://doi.org/10.1016/0167-5877(86)90028-0