
ABSTRACT
In this article, we present a collective research agenda for mobile-first and responsive cartographic design. The research agenda explicitly focuses on challenges regarding design, and we begin by establishing a partial design space for mobile-first and responsive maps and visualizations, situating these design considerations within the constraints, enablements, and consequences of mobile technology. Specifically, we present 20 research challenges facing mobile-first and responsive cartography and visualization, with research challenges organized by five dimensions (i.e., sets of design decisions) of the design space: (1) scale and generalization, (2) projections, (3) symbolization and visual hierarchy, (4) toponymy and typography, and (5) user interaction. The agenda crosses and organizes a range of research foci in cartography and visualization – such as augmented/mixed reality, indoor/outdoor mapping, egocentrism, focus+context techniques, energy-aware design, glanceable visualization, visual storytelling, UI/UX design, multi-modal and embodied interaction, and inclusive design – centering conceptual, practical, and critical questions for design throughout.
Introduction: What is mobile-first and responsive cartographic design?
In this article, we present a collective research agenda for mobile-first and responsive cartographic design. More maps are viewed on mobile devices today than in any other format, media, or platform (see Lella and Lipsman Citation2014; Ricker, Schuurman, and Kessler Citation2015; Smith et al. Citation2015; Anderson Citation2016; Abraham Citation2019, for some projections), although deep inequities in mobile access persist (Taylor and Silver Citation2019; Kraak et al. Citation2020). Yet, much of the cartographic canon we teach and practice was established for the design of printed maps, where ink is immutable but precise, map sheets are big but foldable or bound in an atlas volume, and map design bends to the mapmakers’ intentions rather than the map users’ individual needs and context. Even contemporary treatments explicitly on interactive and web-based cartography rarely consider mobile as the primary design platform (see Zipf Citation2002; Reichenbacher Citation2004; Meng, Zipf, and Reichenbacher, Citation2005; Muehlenhaus Citation2013, for notable exceptions), instead imagining widescreens, external input devices, and reliable networks and bandwidth. How must cartographic design adapt to consider the mobile context first?
Mobile cartography and visualization intersect several emerging research foci and design practices in user experience (UX) design, or the iterative set of decisions leading to a successful outcome with an interface, mobile or otherwise, as well as a productive and satisfying process while arriving at this outcome (Garrett Citation2010; Roth Citation2017a). Mobile first describes an approach to UX design that is optimized for the technological constraints of mobile devices, such as smartphones, tablets, smartwatches, and heads-up displays (Mullins Citation2015; Ricker and Roth Citation2018). Mobile-first constraints include: small screen viewing, limited wireless connectivity and costly data plans, limited battery life, and touch-based user interaction, among others (see below for more detail). However, these constraints give mobile devices their fundamental utility: the physical mobility of the device in the landscape and resulting ubiquity of mobile computing in society (Satyanarayanan Citation2001; Gartner, Bennett, and Morita Citation2007). Accordingly, mobile first is a design philosophy that considers the most constrained user experience before others (Roth Citation2019b) and, therefore, reinforces tenets of the broader inclusive design movement that prioritizes support for marginalized users and use cases throughout the design process (Shum et al. Citation2016; D’Ignazio and Klein Citation2020). Mobile-first design serves as the anchor point for a broader responsive design strategy that dynamically adapts the content, layout, and styling from the constrained, mobile use case to flexible, non-mobile use cases (Marcotte Citation2010).
The article proceeds with seven sections. Next, we review relevant background on cartographic design decisions and workflows, situating these design considerations within the constraints, enablements, and consequences of mobile technology. We then build upon this review in subsequent sections to present 20 research challenges facing mobile-first and responsive cartography and visualization (). The research agenda was derived from presentations and discussions held during a two-day workshop on ‘Mobile Map UX’ preceding the 2019 International Cartography Conference that was attended by 70 scholars from nine countries; Roth, Griffin, and Huang (Citation2024) details the collective process for identifying these research challenges. Sections include research and development needs for mobile-first and responsive: (1) scale and generalization, (2) projections, (3) symbolization and visual hierarchy, (4) toponymy and typography, and (5) user interaction. We conclude by summarizing our proposed research agenda and providing an outlook for mobile-first and responsive cartographic design.
Table 1. Research challenges for mobile-first and responsive cartographic design.
Background: A partial design space for mobile maps and visualizations
Design can be used in cartography and visualization to refer to both a map or visualization product as well as the process executed to arrive at this product (Nestel Citation2019a). As a product, design refers to the map or visualization as a visual, sonic, haptic, etc., representation of real-world phenomena and processes, and descriptions of the product may include the manner by which depicted data are generalized, projected, symbolized, or annotated with labels as well as the overall visual harmony and balance or the overarching aesthetics and style (Kraak et al. Citation2020). With the move to an interactive and digital medium, treating design as a product also can refer to the functional scope of the map or visualization, such as the implemented interaction operators and their direct or indirect manipulation interface styles, as well as other non-functional yet valuable characteristics to the overall user experience, such as accessibility, interoperability, reliability, and usability (Roth Citation2019a).
As a process, design refers to the range of decisions a cartographer must first plan and then execute to move from initial concept to final product (Buckingham Citation2019). Design is an intentional activity, representing how the cartographers and designers assert their positionalities and worldviews onto their products, and therefore how maps and visualizations become authored and subjective (extending Harley Citation1989). Further, treating design as a process acknowledges that any map or visualization is in a continual state of becoming, landing with each user differently based on their unique lived experiences, mapping needs, and enveloping cultural, political, and technological practices (Kitchin and Dodge Citation2007). Accordingly, mobile-first and responsive design together present a critical arena in cartography and visualization for uniting new understandings of both product and process in support of a highly-dynamic, mobile user experience.
Following this line of thinking, we treat design as a flexible solution space – acknowledging that some design alternatives may be superior to others in a specific use and user context – and assert that much of the existing guidance in cartography and visualization for navigating this design space needs to be fundamentally rethought or expanded for mobile maps and visualizations. Specifically, we call for a comprehensive reevaluation of the established cartographic canon to explicitly adapt design thinking across mobile and non-mobile contexts (Rowe Citation1991). Empirical research can inform dimensions of this expanded mobile-first and responsive design space, including both controlled experiments seeking generalizable and reproducible insights as well as design case studies seeking transferable and contextual insights (Sedlmair, Meyer, and Munzner Citation2012; Roth Citation2019a). Artistic, computational, and critical ways of knowing also can contribute to this expanded design space (Robinson et al. Citation2017).
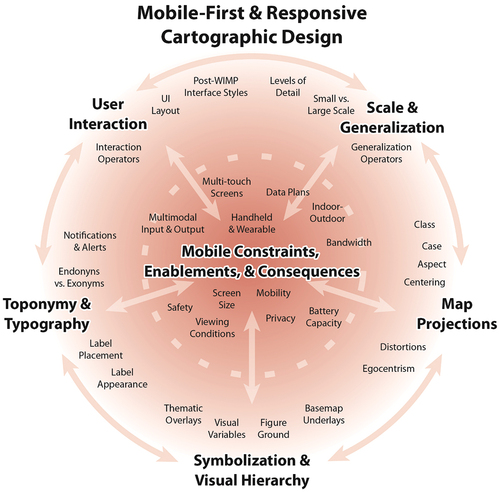
presents five dimensions (i.e., sets of design decisions) of the cartographic design space requiring future research for adaptation to mobile. The demarcation of five dimensions is based on a general design workflow capturing clusters of similar cartographic design decisions to organize discussion, and these dimensions could be sliced at different granularities. We detail each dimension below.
Figure 1. A partial design space for mobile maps & visualizations. Specific mobile constraints, enablements, and consequences are placed qualitatively, and may impact all topics in the design space.
Scale & Generalization: Scale is a fundamental, yet multifaceted concept in geography and related disciplines broadly referring to the resolution and extent of a phenomenon (Goodchild Citation2011). In cartography, scale specifically describes distance relationships between the map and Earth, with a smaller versus larger cartographic scale map depicting more regional versus more local phenomena, respectively (Raposo Citation2017).Generalization, in contrast, is the meaningful removal of detail when setting or changing scale (Robinson et al. Citation1995), and thus is an intentional design process aimed at maintaining legibility at the given scale and for the intended context. Like interactive web maps, mobile maps and visualizations often are generalized across many scales at multiple levels of detail (LODs), supplying multiple representations of variable visual complexity for the same map feature (Weibel and Dutton Citation1999; Sarjakoski Citation2007; see Elias, Hampe, and Sester Citation2005; Chen and Clarke Citation2020 for adaptations to mobile). Common multiscale generalization operators (i.e., generalization design decisions) include: select, simplify, smooth, exaggerate, displace, collapse, aggregate, merge, resymbolize, and enhance, among others (e.g., Brewer and Buttenfield Citation2007; Roth, Brewer, and Stryker Citation2011; Kraak et al. Citation2020).
Map Projections: Map projection is the process of imperfectly translating geospatial data from a three-dimensional model of the Earth to the two-dimensional map, with the projection always distorting map properties in some way, such as areas, angles, or distances (Battersby Citation2017). While mathematically calculated by computers today, selecting and configuring projections remains an intentional design process aimed at managing distortions across the map based on its purpose and mapped location. Traditional projection design decisions include: class (e.g., cylindrical, conic, planar), case (e.g., tangent, secant), aspect (e.g., normal, transverse, oblique), centering, and the preserved map properties (e.g., conformal, equal-area, azimuthal, equidistant) (Kessler and Battersby Citation2019). The Web Mercator projection – a non-conformal variant of the conformal and cylindrical Mercator projection originally intended for sea navigation – remains the common solution for multiscale digital mapping given its deconstruction into interlocking square tilesets, despite its limitations for many mapping contexts, mobile or otherwise (Battersby et al. Citation2014).
Symbolization & Visual Hierarchy: Symbolization describes the meaningful encoding of information using visuals, sounds, haptics, etc. (White Citation2017), and is conceptually similar to using an alphabet, dictionary lexicon, and grammatical syntax for written communication. Far from an arbitrary choice, symbolization is an intentional design process aimed at choosing encodings from a finite set of sensory channels while taking into consideration cultural, political, and technological connotations and constraints that influence their interpretation. Graphic symbolization relies on the visual variables, or basic building blocks of a visual scene, which include: location, size, shape, color hue, color value, color saturation, orientation, texture, arrangement, transparency, crispness, and resolution (Bertin Citation1967/1983; MacEachren Citation1995).Visual hierarchy describes the order that map symbols and other labels and elements are perceived visually (Tait Citation2018). Intentionally designed visual hierarchy results in some symbols rising to the figure, which might include quantitative data symbolized through thematic map overlays (e.g., choropleth, proportional symbol, dot density, isoline/surface), and some symbols falling to the ground, which might include basemap tilesets at variable generalizations and levels of detail (e.g., streets, satellite, terrain). We collapse symbolization with visual hierarchy – commonly separate design topics in cartography and visualization – given their combined impact on visual complexity, which typically needs to be reduced for mobile maps and visualizations rendered on small screens with variable environmental viewing conditions.
Toponomy & Typography: Toponyms are place names and can originate from within a named place (endonym) or from outside a named place (exonym), with toponyms sometimes requiring transliteration or transcription between languages and character sets for interpretation across geographies, histories, and cultures (Ormeling Citation2000). Intentional design of toponyms is particularly important to support a diverse audience when moving across cultural, political, and social boundaries, and choosing appropriate toponyms requires a careful balance between familiarity for users and sovereignty of Indigenous and local communities (Berg and Vuolteenaho Citation2009; Rose-Redwood, Alderman, and Azaryahu Citation2010).Typography then describes the placement and appearance of these place names as labels on maps (Guidero Citation2017). Drawing on toponomy and typography, labeling is an intentional design processes aimed at adding important details back into the map that are otherwise lost through generalization, symbolization, and other abstraction. Conventionally, labels are styled to evoke congruence with the labeled feature, using variations in typeface (serif, sans serif), type size, type style (roman, bold, italics), type color, and type spacing to evoke nominal or ordinal differences, whereas labels are placed to minimize overprinting while maintaining graphic association between symbol and label, with recommendations specific to point, line, and polygon feature dimensionalities (Imhof Citation1975). Finally, mobile-first label considerations may be expanded beyond text directly on the map to include text-based alerts and notifications when moving.
User Interaction: Interaction describes the two-way question-answer sequence between a user and map mediated through a computing device (Roth Citation2012). Interaction enables the user to change the display in real-time based on their needs and interests (MacEachren and Monmonier Citation1992), and therefore user interface (UI) design is an intentional process aimed at implementing functionality that empowers users to do more with their maps and visualizations while constraining functionality that may lead to confusing or misleading views. UI design relies on interaction operators, or interactions generic across maps and visualizations that serve as the basic building blocks of an interface similar to the visual variables in symbolization. Interaction operators include: those that change the design (reexpress, overlay, sequence, resymbolize); those that change the user’s perspective (zoom, pan, reproject, arrange); and those change or derive content (search, filter, retrieve, calculate) (see Roth Citation2013a; Kraak et al. Citation2020 for complete definitions). While research and practice on UI design in cartography remains in its infancy broadly (MacEachren Citation2013), mobile-first interaction is a unique design context for maps and visualizations given reliance on multi-touchscreens and other post-WIMP (windows, icons, menus, pointers) interfaces (Van Dam Citation1997; Shneiderman and Plaisant Citation2020). Further, mobile-first interaction design also requires new, creative UI designs and layouts to implement interaction operators intuitively on constrained screen sizes.
There is a small but growing literature in cartography and visualization on strategies to adapt and expand the cartographic design space for mobile use cases. Some of this work focuses on the constraints that mobile technology imposes on design, which include: small screen sizes (with screen resolution becoming less of an issue on recent mobile devices), reduced or less reliable bandwidth (with processing power becoming less of an issue on recent mobile devices), costly data plans (exacerbated by the continued digital divide), limited battery capacity, and variable viewing conditions (Chittaro Citation2006; Çöltekin and Reichenbacher Citation2011; Nagi Citation2014). Because these technological and economic constraints also impact non-mobile digital maps, but generally to a lesser degree, understanding the relative impact of these constraints on maps and visualizations is important for both mobile-first and responsive cartographic design (Roth Citation2013b). Abraham (Citation2019) provides a comprehensive review on historical and contemporary mobile technology, and the constraints therein on cartographic design.
In contrast, a subset of research approaches design enablements specific to mobile-first design only. Such enablements include: handheld or wearable use while moving in the environment (e.g., Clarke Citation2004; Goodchild et al. Citation2004), direct manipulation interaction through touchscreens (e.g., Muehlenhaus Citation2011; Newbury et al. Citation2021), multimodal voice, gesture, and gaze-based input and multimodal haptic, sonic, and tactile output (Huang et al. Citation2018), the possibility of seamless maps between indoor and outdoor environments (e.g., Huang and Gartner Citation2009; Chen and Clarke Citation2020), and the ability to deliver customized maps and visualizations using location-based services based on the device’s GPS receiver and other spatial sensors (e.g., Dao, Rizos, and Wang Citation2002; Tsou Citation2004; Meng Citation2005). Huang et al. (Citation2018) provide a research agenda specific to location-based services, with the Huang et al. (Citation2024) research agenda in this special issue expanding this overview to opportunities at the intersection of location-based services and mobile-first cartography and visualization.
Finally, a subset of research explores the unintended consequences of mobility and location-based services on the users of mobile maps and visualizations. Possible consequences include diminished spatial cognition and memory (e.g., Ishikawa et al. Citation2008; Dillemuth Citation2009), eroded location privacy and increased surveillance (e.g., Wilson Citation2012; Ricker, Schuurman, and Kessler Citation2015), and personal safety concerns related to split attention and other environmental hazards (e.g., Reichenbacher Citation2001; Roth et al. Citation2018). Griffin et al. (Citation2024) address these cognitive and cultural challenges related to mobile cartography, and are repeated here only when explicitly linked to design considerations.
summarizes the evolving recommendations in the literature for explicitly-cartographic mobile-first and responsive design (updated from Roth et al. Citation2018; Ricker and Roth Citation2018), relating the design space to the aforementioned constraints, enablements, and consequences of mobile technology. illustrates how some of the design decisions may respond to mobile (expanding upon Kraak et al. Citation2020). The purpose of the following research agenda is not to repeat this summary of existing work beyond the summary, but to use it as a foundation for identifying and contextualizing the research and design gaps facing mobile-first and responsive design outlined in .
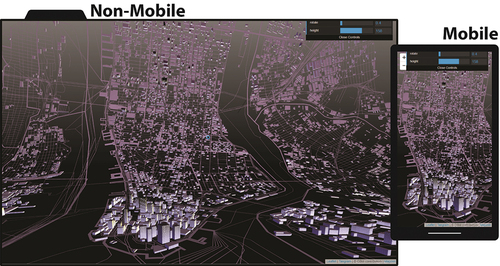
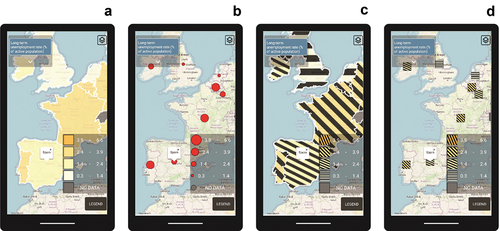
Figure 2. Mobile-first and responsive design illustrated (adapted from Kraak et al. Citation2020). Both the non-mobile (left) and mobile (right) interactive maps depict Indicator 9c1 (Percentage of population covered by a 2 G mobile network; 2017) from the United Nations Sustainable Development Goals (SDG). global indicator framework. The mobile design illustrates several of the recommendations, for instance: (Scale & Generalization) a generalized basemap and larger default cartographic scale for local context; (Projections) centering on the user’s location; (Symbolization & Visual Hierarchy) a hidden legend and response to a vertical layout; (Toponymy & Typography) increased text size (relative to the total screen footprint) and audio search; (User Interaction) post-WIMP widgets arranged for thumb-based interaction, with advanced functionality minimized behind a bottom pull-up menu.
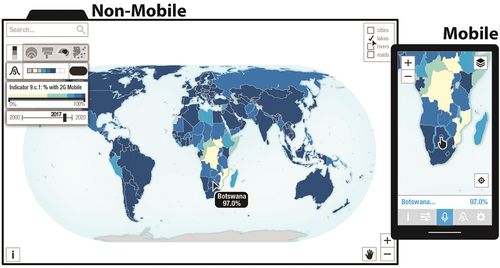
Table 2. Summary of evolving design guidelines for explicitly-cartographic mobile-first and responsive design, updated from Roth et al. (Citation2018) and Ricker and Roth (Citation2018). While these guidelines emphasize how cartographic design principles adapt from non-mobile to mobile constraints, a truly mobile-first approach would adapt from mobile to non-mobile, or not consider non-mobile use cases at all. Although some design recommendations are derived from empirical evidence, all need further investigation across map use and user contexts.
Mobile-first and responsive scale and generalization
Should generalization be speed- or cost-dependent rather than scale-dependent for mobile-first cartography and visualization?
Perhaps no design consideration for mobile-first cartography and visualization has received more attention over the past two decades than the level of detail (LOD) in the representation, or the number and complexity of features in the map or visualization (Bozkurt et al. Citation2005). Convention in cartography suggests that the optimal number of features and LOD primarily are dependent upon the selected (or for interactive maps, the default) cartographic scale (e.g., Töpfer and Pillewizer Citation1966; Ratajski Citation1967; see Edwardes, Burghardt, and Weibel Citation2005 for adaptation to mobile). Early discussions on mobile-first cartography and visualization warned that supplying detailed representations when moving in the landscape may overwhelm the user’s cognitive abilities and divert attention away from the environment (e.g., Meng and Reichenbacher Citation2005; Reichenbacher Citation2005; Meilinger et al. Citation2007). Constraints of mobile technology such as screen size, bandwidth, and processing power also logically suggest that less detail or retrieving details only on demand is better for mobile devices (Chittaro Citation2006).
However, results from empirical research on mobile-first default scale and associated LOD are varied. For instance, a larger default scale for mobile devices depicting immediate environmental surroundings may help with the accuracy of identifying nearby landmarks and navigating a local landscape (e.g., Dillemuth Citation2005; van Tonder and Wesson Citation2009; Davidson Citation2014), but a smaller default scale showing a broader overview may help with the efficiency and accuracy of distance and direction estimates across wider regions (e.g., MacEachren Citation1992; Dillemuth Citation2009; Willis et al. Citation2009). Bartling et al. (Citation2021, 14) found no performance difference on mobile devices by default scale and LOD, suggesting an optimal amount of generalization that follows an ‘inverted U-shape’ curve by task and that ‘Neither low nor high levels of map detail complexities aid the users’, a finding triangulated by other studies on non-mobile maps and visualizations (e.g., Bestgen et al. Citation2017; Lokka et al. Citation2018; Liao et al. Citation2019; Vincent et al. Citation2019; Keil et al. Citation2020).
While mobile users still may require variable levels of detail by scale and task (as first suggested by Harrie, Sarjakoski, and Lehto Citation2002), the default scale and LOD for a given mobile map or visualization actually may be contingent on several unique conditions of mobile devices. First, different modes of travel result in very different experiences of the environment, with speed of travel in particular impacting the salience of features in and overall depth of engagement with the landscape (Edwardes, Burghardt, and Weibel Citation2005; Winter, Raubal, and Nothegger Citation2005). Nearly all contemporary mobile devices are equipped with an accelerometer to detect speed and infer mode of travel (Abraham Citation2019). Arguably a mobile map (and users of these maps) traveling at higher speeds (e.g., walking vs. driving vs. flying) needs more overview and less detail, as it can access a greater region within a given amount of time. Thus, we need generalization strategies based on the user’s travel range – a mobile concept consistent with the space-time prism in time geography (see Miller Citation1991 on; Hägerstrand Citation1970) – not the cartographic scale, with the travel range modeled using spatial buffers, network analysis, or novel techniques calibrated for specific modes of travel (Loeffler et al. Citation2021; ). There also is potential to integrate other mobile sensors, such as the barometer, compass, and gyroscope, as well as crowdsourced mobile datasets to infer more about the user’s travel and further restrict the travel range, improving selection and rendering of relevant features onscreen (Ricker, Schuurman, and Kessler Citation2015; Ricker Citation2019). The default scale even may suggest the intended mode of travel for the mobile map or visualization, ‘immers[ing] the users into a specific geographic scale, context, or story’ (Abraham Citation2019, 107), or respond based on the user’s initial or current speed (van Tonder and Wesson Citation2009; Davidson Citation2014; Loeffler et al. Citation2021).
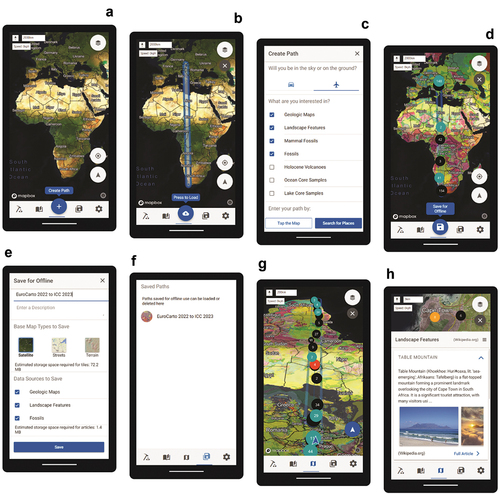
Figure 3. Mobile-first user experience design of Flyover Country (adapted from Loeffler et al. Citation2021). Flyover Country (http://flyovercountry.io/) is a free, mobile-first mobile mapping application that visualizes public data resources about the Earth’s geology and history as users observe the landscape from an airplane window seat, during a road trip, or while on a field trip. A: The default map view upon opening Flyover Country, emphasizing its global coverage. B: Users can request data along a path by directly tapping on the map, and while this is a novel interaction, there is no visual affordance for the post-WIMP interaction; users also can create a path by tapping the floating action button (FAB) at the bottom, supporting interaction flexibility for the post-WIMP, mobile-first interaction strategy. C: Tapping the FAB activates a screen allowing users to switch between driving and flying mode and select desired layers on the map. D: Loading a route renders available records within the selected drive or flight path, using a dark basemap and light UI to preserve battery life and overall energy consumption. E: Users can save selected paths for offline use, with Flyover Country providing an affordance about estimated download sizes to give users a sense of the potential costs of the data download. F: Previously saved paths also are available for viewing offline, and can be deleted to free storage space. G: Users can activate an oblique, egocentric view while driving or flying to improve recognition of landscape features. H: Selecting a point on the map activates a bottom pull-up menu with information about the selected record.
Second, the amount of detail loaded into and rendered on the mobile map or visualization has a cost (Loeffler et al. Citation2021). The cost of adding more detail is at least three-fold: a financial cost on mobile data plans, a battery cost with increased connecting, processing, and screen rendering, and a carbon cost from the accumulated energy consumption across all users (the latter is treated in more detail below). While unlimited data plans are common in developed and developing countries, unequal access to mobile technology and data services (i.e., a digital divide) persists across and within all countries (Taylor and Silver Citation2019; Kraak et al. Citation2020). Even with a data plan, added detail wears on battery life and, combined with potential gaps in connectivity while moving, may leave the user lost or stranded in the landscape (Roth et al. Citation2018). Common data conservation solutions do not consider the resulting design of the map itself, potentially imposing illegible color distortions in ‘Low Power’ or ‘Battery Saver’ mode (Wu et al. Citation2018; see discussion of below), or require caching all information at once for an offline mode (Loeffler et al. Citation2021; ; Roth et al. Citation2018; ). We need a better understanding of the relative financial, battery, and carbon costs of different generalization operators for maintaining legible mobile maps and visualizations. A simple strategy may be to relate speed or cost breakpoints to specific levels of details in existing multiscale databases. However, speed-dependent or cost-dependent generalization may result in new strategies for multiscale map design altogether, as less commonly automated generalization operators including displace, exaggerate, resymbolize, and enhance may effectively emphasize relevant features when moving and avoid complex server-side pre-processing (Brewer and Buttenfield Citation2007).
How should mobile maps and visualizations be generalized at the vista scale?
The possibility of mobile enables maps and visualizations to serve as interactive information repositories accessed when directly situated in the places they represent (Roth et al. Citation2018). While maps and visualizations as mental abstractions are unbounded by scale (MacEachren Citation1995), most cartographic generalization principles were developed to abstract phenomena that exist on a scale larger than what could be observed directly by a person at any given time, with such ‘act of generalization giv[ing] the map its raison d’etre’ (Robinson et al. Citation1995, 42). However, emerging environmental and social sensing technologies have enabled the creation of an LOD consistent with the vista scale, or the scale of the human body and the immediately observable vicinity (Montello Citation1993). This includes the possibility of extended reality discussed below, with maps and visualizations at the vista scale potentially replicating surrounding reality with hyper-realism (e.g., Mathews and Frazier Citation2017; Huang Citation2018; Yanow Citation2018). But, why reconstruct and retain details at the vista scale that we already can observe directly through our senses? We need to rethink principles of selection, simplification, etc., to support meaningful abstraction at the vista scale.
Generalization at the vista scale also requires asking whose vantage points are and are not included in the mapped and visualized data (D’Ignazio and Klein Citation2020; Kelly Citation2020), and thus which data traces are captured in or erased from the digital landscape. Location-based services were triumphed early in mobile cartography and visualization as an opportunity to level the playing field through ‘amateur cartography’ (McConchie Citation2015), ‘citizen science’ (Haklay Citation2013), ‘crowdsourced cartography’ (Dodge and Kitchin Citation2013), ‘democratized cartography’ (Rød, Ormeling, and van Elzakker Citation2001), ‘neogeography’ (Turner Citation2006), and ‘volunteered’ (Goodchild Citation2007) or ‘contributed’ (Harvey Citation2013) geographic information. Yet, ‘[w]hile these services can be harnessed for the collection and digitization of local knowledge, bringing attention to places and issues that may not receive notice otherwise, other communities may go under represented making digital divides (in)visible digitally’ (Ricker, Schuurman, and Kessler Citation2015, 639).
For instance, mobile-first generalization at the vista scale intersects the quantified-self movement (Swan Citation2012, Citation2013), and selection and other generalization operators could be tied to biometric and environment sensors, such as heart rate, temperature, and humidity, as well as other bluetooth-support external devices, to further personalize the mobile map or visualization to the user’s current activity (Nelson and MacEachren Citation2020). Yet, such continuous self-quantification cannot be divorced from its economic, political, and social implications on privacy, surveillance, and marginalization (Wilson Citation2015). Accordingly, we need an ethics of generalization for the vista scale that encourages equity and diversity in selection (see Zook and Graham Citation2007; Crampton Citation2009; Wilson Citation2011; Elwood and Leszczynski Citation2013; Cinnamon and Schuurman Citation2013; Stephens Citation2013; Ricker, Daniel, and Hedley Citation2014 for relevant critiques), legitimizes affect and emotion as relevant rubrics for selection (as initially proposed for mobile-first design by Meng Citation2005; Gartner Citation2012), and finally acknowledges the act of generalization does ‘not reflect the world as it actually is, but actively frame[s] and produce[s] the world’ (to borrow from Kitchen, Lauriault, and McArdle Citation2015, 7).
How do we consistently generalize mobile maps and visualizations for both indoor and outdoor use?
Designing mobile maps and visualizations at a human scale requires mobile maps that work seamlessly between indoor and outdoor environments. Li (Citation2008, 1) defines indoors for mobile maps and visualizations as places constrained by ‘architectural components, such as doors, corridors, floors, walls, and stairs’, and Chen and Clarke (Citation2020, 97) note most definitions relevant to mobile cartography ‘contain the notions of full enclosure created by physical constraints, a finite size as opposed to the unboundedness of the outdoors, and greater levels of complexity’ (e.g., Jensen, Lu, and Yang Citation2009; Giudice, Walton, and Worboys Citation2010; Zhu et al. Citation2016; Zlatanova and Isikdag Citation2016; Yan, Diakité, and Zlatanova Citation2018). Notably, a given space may hold characteristics of both indoors and outdoors, further complicating selection of features relevant to blended indoor and outdoor wayfinding (Zhou et al. Citation2012; Yan, Diakité, and Zlatanova Citation2018; Chen and Clarke Citation2020).
Designing indoor-outdoor mobile maps and visualizations is both a technical challenge (Huang et al. Citation2018), requiring sensor integration between GPS and less standardized IPS (indoor positioning systems; see Liu et al. Citation2007; Koyuncu and Yang Citation2010; Mautz Citation2012; Hossain and Soh Citation2015; Grejner-Brzezinska et al. Citation2016 for reviews of IPS alternatives), as well as a cognitive challenge (Griffin et al. Citation2024), with wayfinding within indoor environments potentially relying on a different set of spatial skills and visual cues than outdoor navigation (e.g., Gärling, Lindberg, and Mäntylä Citation1983; Winter, Raubal, and Nothegger Citation2005). Blended indoor-outdoor mobile cartography also raises a number of questions about design (the focus of this article), including best practices for integrating coordinate system and projections, indoor-outdoor and multi-floor symbolization and user interaction, and privacy protection and public safety ().
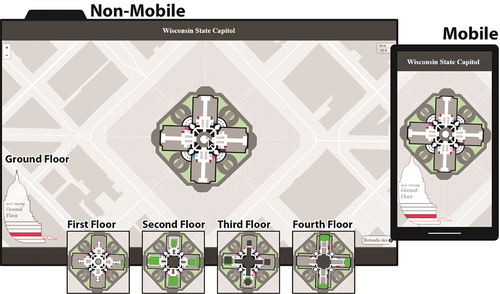
Figure 4. Responsive design solution for indoor-outdoor and multi-floor cartographic design of the Wisconsin State Capitol Building (USA) (adapted from Rose, Roth, and Woodward Citation2013). The Wisconsin State Capitol Building tileset combines digitized public floorplans of the Capitol Building with OpenStreetMap road and building footprints, using a profile view of the Capitol to navigate across floors. Creation of the tileset led to a number of questions about indoor-outdoor mobile map design, for instance: How effective is projection of indoor floorplans in Web Mercator, and what alternatives exist? Should indoor floorplans be generalized differently across scales to match the LOD of outdoor multiscale OpenStreetMap base data? At what scales should doors be depicted as a continuation of a wall versus an opening in a wall? At what scales should thicker walls and other inaccessible voids be depicted as lines versus polygons? Should multi-floor atrium spaces be occluded from all but the bottom floor of the atrium, or draw content from across floors to match the user experience at the vista scale (i.e., what is visible versus what is navigable from a given floor)? What is the best interaction metaphor for navigating between floors while moving?
Generalization arguably is the most pressing challenge facing blended indoor-outdoor maps and visualizations. Indoor maps and visualizations often are presented at the vista scale, and may be more difficult to navigate due to smaller viewsheds and fewer salient landmarks in complex indoor structures (Li and Klippel Citation2016). Accordingly, a first challenge is acquiring and harmonizing high-resolution indoor and outdoor datasets that match the necessary LOD for indoor navigation (Chen and Clarke Citation2020), possibly higher-resolution environmental data than available in many places. Drones and other emerging environmental and social sensors offer potential data inputs for achieving outdoor LODs consistent with indoor LODs, although substantial (but so far untested) generalization workflows are necessary to derive meaningful indoor-outdoor maps and visualizations from the raw point cloud (Chen Citation2018a). While a high resolution ‘digital twin’ may be the ultimate goal for blended indoor-outdoor mobile cartography (Shahat, Hyun, and Yeom Citation2021), promoting and advancing interoperability may be a more tenable strategy to support consistent generalization to consistent LODs (Giudice, Walton, and Worboys Citation2010).
Importantly, we need to adapt common point or (poly)line generalization operators – and possibly invent new operators – to account for increased feature dimensionalities in 3D and 4D representations now possible on indoor mobile maps and visualizations (Zlatanova et al. Citation2013; Zlatanova and Isikdag Citation2016). We also need better integration of vector and raster generalization techniques given the potential of layering image textures on both the inside and outside of 3D data models when viewed at the finest levels of detail (Chen Citation2018b), which in turn requires greater cooperation between cartography and remote sensing knowledge areas broadly (Çöltekin, Griffin, and Robinson Citation2021). Further, and as with primarily outdoor mobile cartography, more complexity may not always be needed or even possible with blended indoor-outdoor maps and visualizations, and we need progressive 3D and 4D generalization solutions that account for bandwidth and data plan unevenness when transitioning between indoor wireless networks and outdoor cellular networks (Roth et al. Citation2018). Finally, it is unlikely that all aspects of map design can be, or even should be, fully resolved between indoor and outdoor use cases, with some aspects of the LOD and visual contrast remaining intentionally responsive to different indoor-outdoor viewing and use conditions (van Tonder and Wesson Citation2009).
What level of detail is appropriate for augmented and mixed reality on mobile devices?
Extended reality (XR) is a relatively recent umbrella term that refers to virtual reality (VR), augmented reality (AR), and mixed reality (MR). While VR is well understood and aspires to replace reality by ‘tricking’ the human senses, AR and MR are conceptually similar in that both aim at enhancing the real experiences while in place (for a more elaborate definition of each, see Çöltekin et al. Citation2020; Çöltekin et al. Citation2020). Accordingly, AR and MR increasingly are delineated by the presence of real-time spatial registration: In MR, virtual objects are shown in their correct positions to match real objects (sometimes described as spatial computing in MR), while in AR, a virtual object can be shown anywhere in the world, such as a text prompt popping up anywhere in one’s visual (Çöltekin et al. Citation2020; Çöltekin et al. Citation2020). Thus, AR and MR are explicitly cartographic and mobile technologies (Çöltekin Citation2019a).
AR and MR displays use mobile-first cartographic design not to abstract reality, per se, but instead either highlight features in a physical scene, guiding people’s attention to spatio-temporally relevant information, or overlay otherwise invisible information (e.g., commercial pricings or ratings, underground infrastructure, air temperature or pollution) onto reality (Wang, van Elzakker, and Kraak Citation2017). Thus, AR and MR represent a fundamental shift in the relationship between maps and generalization: rather than generalizing a map to cull meaning from the complexity of the real world, they augment a real scene by overlaying generalized layers atop this complexity to provide more detail than is directly observable. Countless mobile AR and MR applications have been proposed as proof-of-concepts (e.g., Narzt et al. Citation2006; Joshi et al. Citation2020; Murari et al. Citation2021) and some AR and MR applications already transitioned to real-world use such as indoor and outdoor navigation (e.g., Google AR and VR 2021) and infrastructure visualizations to assist field work (e.g., Schall et al. Citation2009; Mascarenas et al. Citation2021), among others.
Further, Çöltekin et al. (Citation2020) propose the possibility of ‘generalizing reality’ by occluding real information in the real world using partially transparent, blurred, or textured virtual curtains (i.e., a form of simplification); few examples of generalized reality in mobile AR and MR exist to-date, representing a fruitful new avenue of research. Potentially relevant work includes LOD management from computer graphics (Luebke et al. Citation2003), which comprises innovative image processing techniques (e.g., visibility culling and level of detail management based on distance, size, or velocity) that may enhance or expand geometric operators common in cartographic generalization (Çöltekin Citation2006), many of which have a perceptual (e.g., eccentricity LOD, depth of field LOD) or cognitive (e.g., priority LOD) basis. Modern XR devices often come equipped with eye tracking and foveated rendering options, both of which provide additional LOD management possibilities such as gaze-contingent displays (e.g., Bektaş et al. Citation2015) that could ultimately lead to useful and usable ‘generalizations of reality’ in mobile AR and MR.
Whether we augment or simplify our surrounding environment through mobile AR and MR, key questions remain on what additional details should be provided and why, which objects can be safely occluded, and with what level of detail the virtual objects must be rendered? As in cartographic generalization, these questions do not have a clear-cut answer because of their multi-factorial, ill-defined nature. Proposed solutions mostly build on the abovementioned LOD management concepts that date back decades (Park, Chou, and Hwang Citation2018; Keil et al. Citation2018), while many of the more sophisticated solutions remain dependent on inferring a user’s context and intentions. One way of approaching LODs for virtual objects integrated into real scenes is to characterize and control their visual complexity (Lokka and Çöltekin Citation2019), such as using real-time saliency (Tliba et al. Citation2022; Sutton et al. Citation2022) or visual clutter algorithms (Flittner and Gabbard Citation2021) to automatize mobile AR and MR generalization. If multi-factor automatization is achievable, such an approach could help overcome both computational and cognitive issues around information overload inherent to mobile AR and MR when more detail on an already complex and dynamic real-world scene as the user moves through it.
Mobile-first and responsive projections
What is the efficacy of egocentric designs and oblique projections?
Egocentrism describes an explicit interest in and viewpoint from the self (see Towler Citation1970 for early definition and connection to map use). Mobile devices also enable egocentric projection considerations at the vista scale introduced above, and may include centering the map projection on the user’s location, updating the user’s position while moving, and rotating and tilting the map so that ‘forward’ rather than ‘north’ is ‘up’ in the display (Meng Citation2005). Egocentric designs engender a ‘sense of place’ or ‘place attachment’ (see Lewicka Citation2011 for a synthesis and review) and may help users orient themselves on the map (e.g., Burigat, Chittaro, and Sioni Citation2017), relate salient landmarks between map and environment (e.g., Oulasvirta, Nurminen, and Nivala Citation2007), and wayfind using embodied routing directions (e.g., Klippel et al. Citation2005). However, egocentrism presents new challenges that cross all three research agendas in this special issue. Egocentric views have been critiqued by cartographers for shifting emphasis from configural to procedural knowledge and ultimately impeding environmental knowledge acquisition and spatial cognition (e.g., Richardson, Montello, and Hegarty Citation1999; Willis et al. Citation2009; Huang, Schmidt, and Gartner Citation2012; Wen, Ishikawa, and Sato Citation2013; Griffin et al. Citation2017). Further, egocentric projections are a technical challenge, as location-based services supporting egocentrism may be spatially imprecise or slow to update, leading to distracting or misleading information on the map or visualization (Davidson Citation2014; Huang et al. Citation2018). Location-based services supporting egocentrism such as a ‘tracking mode’ also quickly drain battery when continuously active, with a ‘dead’ mobile phone potentially leaving users lost or stranded in the landscape (Roth et al. Citation2018; ).
Regarding design, the efficacy of egocentric maps and visualizations hinge on oblique projections that orient the aspect of the developable surface to the reference global at an angle other than the Earth’s axis of rotation (a normal aspect) or orthogonally from the axis of rotation (a transverse aspect), resulting in a more pictorial representation of the landscape (Loeffler et al. Citation2021; ). Oblique projections historically were less common than alternatives because they were considered to serve a smaller range of specialist use cases (Ward Citation1979) and typically are more difficult to plot than normal or transverse aspects (Dent Citation1987). However, real-time oblique projections are now possible with vector tiling and WebGL mapping technology (Diamond Citation2019). Further, oblique projections have been lauded outside of a mobile-content as a visual storytelling technique for promoting voice and vantage point (Roth Citation2021) as well as in critical cartography for confronting the ‘God trick’ or ‘view from nowhere’ (after Haraway Citation1991) to present a view that is grounded from somewhere and someone (Kelly Citation2020; Underwood Citation2022).
Taken together, we need renewed research on oblique projections supporting egocentrism in mobile use cases. For instance, WebGL-based tools can adjust the pitch (0–90°) and bearing (+/ – 0–180°) of egocentric projections in addition to the projection centering and scale (Jenny et al. Citation2015), but few empirically-derived or time-tested recommendations exist for calibrating these novel settings for mobile contexts. Further, pitch and bearing settings often modify an already projected map render (often in Web Mercator even when using vector tiles) to speed performance on the mobile device, and may impose undesired distortions in the resulting map or visualization requiring alternatives that better balance performance with accuracy. The projection also may blend aspects of egocentrism and allocentrism (a view from multiple perspectives), such as plan oblique projections showing the ground plane in correct scale but relief in an oblique-like side view (Jenny and Patterson Citation2007), or composite projections of multiple pitch angles across the map based on distance from the user, starting from a steep angle and tapering towards a more traditional, planimetric map to produce the ‘horizonless’ focus+context projection distortion effect found in the movie Inception (Richardson Citation2018; ). In all scenarios, egocentric oblique projections may need additional depth cues (e.g., Çöltekin et al. Citation2016; Kubíček et al. Citation2017), distance scales (e.g., Halik Citation2012; Halik and Medyńska-Gulij Citation2017; Bartling et al. Citation2021), and environmental signage (e.g., Soh and Smith-Jackson Citation2004; Nestel Citation2019b) to support a wider range of map use tasks.
Figure 5. New York City (USA) in a ‘horizonless’ projection using the bendy-map interactive map (adapted from Richardson Citation2018). While the non-mobile version (left) produces a line-bending/mind-bending distortion reminiscent of the movie Inception, the mobile version (right) offers real utility as a focus+context visualization portraying immediately local context (assuming the user’s location is in Lower Manhattan) through an oblique, egocentric projection and more distance but potentially important wayfinding information through a more conventional, planimetric map projection.
Finally, it is unclear how oblique projections should respond from mobile to non-mobile devices. Default oblique projections have become common on non-mobile web maps for a stylistic ‘tilt-shift’ effect even when the perspective does not serve the map purpose, but a responsive oblique projection may be helpful for the aforementioned purpose of visual storytelling or inclusive design practices to support users who are unable to visit the mapped locations physically due to access, disabilities, or inconvenience (Roth Citation2019a). Potential responsive solutions may draw from existing solutions for virtual field trips supporting situated learning (see Armstrong and Bennett Citation2005 for a synthesis and review), such as pre-recorded flythroughs (e.g., Harrower and Seesley Citation2007), video gaming technology (e.g., Bursztyn et al. Citation2015), and immersive and augmented reality (e.g., Mead et al. Citation2019).
While egocentrism directly impacts map projections on mobile devices, supporting egocentrism also may impact a range of other design decisions, such symbolization of the self (going beyond the ‘reassuring blue dot’ symbol to encode additional dimensions of the self and its movement; Peterson Citation2014) and interaction with the map (including avatar-based embodied interactions discussed below; Thorn Citation2018).
Should projection selection adapt to device aspect ratio, space efficiency, orientation, and other dimensions of the mobile use context?
In static mapping, the projection and projection parameters often are determined by the map scale and extent undergoing projection as well as the map properties preserved or distorted as a result of the projection (Snyder Citation1987; Kessler and Battersby Citation2019). Conventionally in smaller-scale regional maps, for instance, normal cylindrical-, conic-, and planar-class projections are matched with equatorial, mid-latitude, and polar regions, respectively, using a secant case to align standard lines (i.e., where there is no distortion) with the mapped geography (Kraak et al. Citation2020). Similarly, conformal projections like Mercator are paired with reference maps to maintain angles at infinitely small points (an approximation of shape) to support orientation, feature identification, and navigation while equivalent projections are paired with most thematic map types (e.g., choropleth, dot density, heat maps, shaded isoline) to preserve the relative sizes of symbols to support general map reading tasks (after Battersby, Strebe, and Finn Citation2017). Šavrič, Jenny, and Jenny (Citation2016), Finn et al. (Citation2017), and Jenny et al. (Citation2017) provided useful resources for arriving at an acceptable projection based on the desired scale/extent and preserved map property, and Jenny (Citation2012) implemented these guidelines to flexibility adapt the map projection as users dynamically pan and zoom across scales and extents.
Arguably, the mobile use context should be a third consideration for choosing a projection and projection parameters. First, mobile maps and visualizations benefit if they match their aspect ratio – or relationship to the horizontal and vertical axes, different from projection ‘aspect’ used above – to the screen aspect ratio, allowing the map or visualization to be as large on the screen as possible. Abraham (Citation2019) found that aspect ratio varies considerably across mobile devices with a general trend of becoming more elongated and therefore more of a constraint on the design of mobile maps and visualizations. Projection aspect ratio is gaining increased attention in cartography and visualization, as it also impacts visual balance and user preference (e.g., Šavric et al. Citation2015; Jansen Citation2019), and similar decision logics as Jenny’s (Citation2012) solution for multiscale web map projections based on scale and extent can be extended for fully responsive web map projections based on screen size and aspect ratio. Second, small screen viewing may benefit from map projections with an increased space efficiency, or the percentage of map versus non-map within a bounding rectangle (Huffman Citation2019), here the viewport of the mobile device. Jansen (Citation2019) provides a useful web utility for visually comparing aspect ratio versus space efficiency to aid in projection selection for small scale maps (). Third, the map projection also may respond to the device orientation, switching from a normal to transverse aspect or changing projections altogether to optimize use of the small screen. While unconventional for thematic world maps, transverse projections may be particularly useful for visual storytelling and data journalism on mobile devices (as discussed below as part of mobile thematic cartography), aligning a portrait map orientation with the vertical scroll (). Finally, many specialty projections may have increased value for mobile maps and visualizations, such as the gnomonic projection for placing a straight great circle between an origin and destination during wayfinding or the equivalent dymaxion projection for tessellating multiscale thematic maps using triangular tilesets instead of the square tiles common to the Web Mercator.
Figure 6. A comparison of projections by aspect ratio and space efficiency (adapted from Jansen Citation2019). The Eckert IV (top; used in ) and Molleweide (bottom; used in ) projections are equal-area, pseudocylindrical projections, and therefore are recommended for thematic maps at a regional or world scale. While both projections have an aspect ratio of 20 (2:1 width:height)., the Eckert IV has a slightly higher space efficiency than the Molleweide (0.90925 versus 0.88539), resulting in the Eckert IV reserving roughly 2.5% more screen real-estate for the mobile map (each projection footprint is portrayed in light gray within the above charts). Thus, Eckert IV has an advantage over Molleweide for mobile-first projections and thematic map design, at least when viewing the map horizontally (see ). Jansen provides a useful web utility for visually comparing the aspect ratio and space efficiency of many projections, which could serve as the basis for a mobile-first design strategy that is responsive to the unique screen size of the user’s phone.
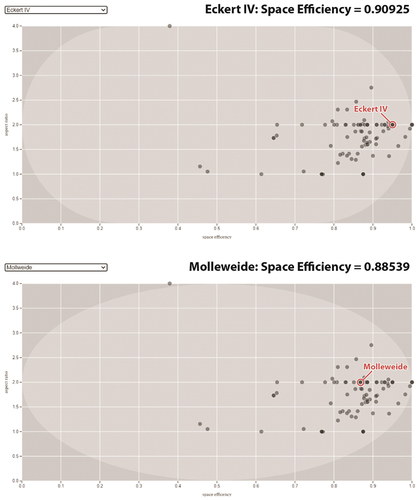
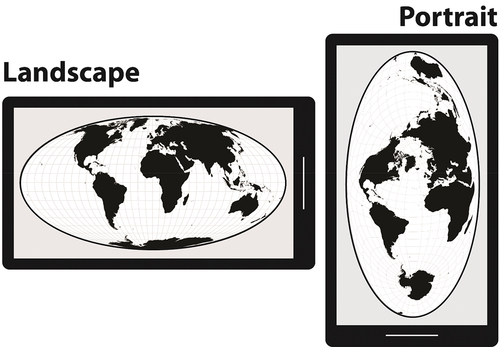
Figure 7. Responsive map orientation (adapted from Bostock Citation2020). Most world maps are projected into landscape orientations by default, reinforcing ‘north-as-up’ as a design construct. However, a transverse aspect for cylindrical and pseudocylindrical projections may be acceptable in mobile contexts where egocentrism is expected, and have the advantage of making more efficient use of the screen space. Thus, the rounded corners of the Molleweide projection (shown here) has an advantage over the blockier corners of the Eckert IV (see ) when adapting from a normal (left) to transverse (right) aspect, particularly in the context of visual storytelling and data journalism where smartphone reorientation to a portrait aspect ratio is expected.
What focus+context visualization techniques are useful for mobile first cartographic design?
A key challenge in designing egocentric mobile maps and visualizations at the vista scale, including those that leverage AR and MR, is providing necessary overview information beyond the spatial extent currently visible onscreen. A number of ‘reprojection’ techniques have been developed in information visualization to provide simultaneous general overview and local detail, solutions described as focus+context visualizations (see Hauser Citation2006 for a synthesis and review). Focus+context techniques may be useful alternatives to oblique map projections for supporting egocentrism (Chittaro Citation2006), but are far less common in mobile maps (Abraham Citation2019). Ware (Citation2021) organizes focus+context visualizations into four categories: distortion techniques, rapid zooming techniques, elision techniques, and multiple windows. Each class of focus+context techniques could be applicable for mobile maps and visualizations to optimize context information portrayed on small screens.
Distortion techniques are the most conceptually similar to map projections – or more specifically, contiguous cartograms – and manipulate the spatial configuration of map features so that more space is allocated to the local area of interest and less to regions further away (Furnas Citation1986). The circular fisheye lens or magnifying glass is perhaps the most common focus+context distortion technique (see Harrie, Sarjakoski, and Lehto Citation2002, for map examples; Rappo, Cecconi, and Burghardt Citation2004; Edwardes, Burghardt, and Weibel Citation2005; Wu Citation2016), but a variety of spatial distortions may be useful depending on the user’s task, such as the aforementioned Inception effect () as well as linearization of a route into a schematized strip map (MacEachren Citation1986; Klippel et al. Citation2005). When moving, the logical centering of a fisheye or other distortion is on the user’s location to present local context in detail. However, focus+context distortions may be helpful for mobile maps and visualizations to make more efficient use of the small screen, presenting an open mobile interface design challenge given the lack of hover affordances on most touch-based, post-WIMP interfaces (Yamamoto, Ozeki, and Takahashi Citation2009).
Additional focus+context techniques perhaps are more alternative design solutions to egocentric projections than projections in themselves. Rapid zooming techniques alternate between map scales (i.e., zoom levels) to support ‘macro-micro’ map readings (Pearce Citation2008, 24; citing Tufte Citation1990, 37), often with smooth transitions between scales to maintain orientation in the map or visualization. While most mobile maps and visualizations enable panning and zooming interaction operators (see below), there may be discoverable break points in map use where the system should trigger these interactions automatically, such as when starting and stopping, changing direction, or reaching waypoints. Elision techniques hide rather than distort portions of the context display until they shift into focus, a design solution consistent with Zipf (Citation2002) and Zipf and Richter (Citation2002) use of early ‘focus maps’ for mobile cartography. Elided areas may be deleted (an application of the selection generalization operator) or rendered with transparency or other style reduction to produce a perceptual depth of field inconsistent with the projected perspective. Alternatively, focus areas may receive visual accenting such as highlighting using a high-contrasting color, contouring the outline of features, increasing the level of detail, or animating using blinking or jittering (Reichenbacher Citation2005; Robinson Citation2011). A key issue with elision techniques – and focus+context visualizations generally – is delineating what should be treated as focus versus context information in a given use case scenario (Fuchs, Kreuseler, and Schumann Citation2004). Finally, multiple windows split focus and context into separate displays, a solution that may not be feasible for small screens unless linking multiple devices with cross-device interaction, as discussed below. However, an extension to multiple windows may be the symbolization of information currently offscreen around the outer frame of the mobile map or visualization, using the visual variables or POI icons to provide a visual preview of attribute and spatial information for important offscreen features (e.g., Burigat and Chittaro Citation2008; Li et al. Citation2014). Thus, we need future research to explore the relative advantages and limitations of focus+context techniques for mobile maps and visualizations.
Mobile-first and responsive symbolization and visual hierarchy
How can mobile-first symbolization be energy-aware?
Energy-aware design intentionally balances the quality of the user experience with the energy output of a digital tool, with the goal of remaining useful while minimizing the carbon footprint (Wang, Lin, and North Citation2012; Han, Wu, and Roth Citation2021). Energy-aware design aligns with the broader green computing movement that encourages efficient creation, use, and disposal of computing resources to reduce carbon emissions and mitigate climate change (e.g., Griggs et al. Citation2013; Biermann, Kanie, and Kim Citation2017). Wu et al. (Citation2024) estimate that the annual global energy required just to display Google Maps (not considering data collection, storage, transmission, etc.) was approximately 820.9 million kWh, which is equivalent to the total amount of electricity consumed by 255,538 ‘average’ people in 2021 or 410.4 million kgCO2e in greenhouse gases. Accordingly, even marginal reductions in energy consumption through intentional energy-aware cartographic design can have meaningful effects when accumulated across all global users. While we need robust considerations for energy consumption for both mobile and non-mobile maps and visualizations, energy-aware design is particularly pertinent to a mobile context given the added benefit of preserving battery life (Roth et al. Citation2018).
Energy-aware design potentially relates to all of the topics in the design space (see Wu et al. Citation2024 for a more comprehensive treatment of energy-aware design for green cartography and visualization), and green computing more broadly also presents technical challenges regarding the greening of computing infrastructure and services (e.g., Webb Citation2008) as well as socio-cognitive challenges the greening of individual attitudes and behaviors towards the use of computing infrastructure and services (e.g., Dalvi-Esfahani et al. Citation2020). However, research and development on green cartography and visualization to-date (e.g., Hoarau Citation2011; Han, Wu, and Roth Citation2021) primarily focus on the evaluation and transfer of energy-aware color schemes that preserve the semantic relationships of the original symbols through a ‘dimming’ mode (e.g., qualitative versus sequential versus diverging color schemes), at the expense of breaking from conventional uses of color in cartography (e.g., blue for water, green for forest) (). As a useful starting point, Chuang (Citation2009) developed a method for measuring the energy output of OLED screens that can be used to estimate the energy saving of one color scheme over another. However, this model only estimates the energy consumed by static images, and we need additional methods for measuring a dynamically changing screen while the user interacts as well as the energy cost of other services and sensors utilized to render the display. Chuang’s output model also needs to be extended to the more common mobile screen types, such as AMOLED and IPS LCD (Abraham Citation2019).
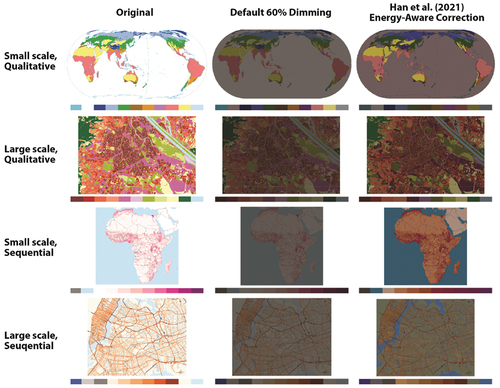
Figure 8. Energy-aware color schemes (adapted from Han, Wu, and Roth Citation2021). Considering the energy consumed by a given mobile map is important for both preserving battery life for a specific user as well as reducing the collective carbon footprint across all users. Screen brightness is a major consideration for cartographic design, but many color schemes tested for print and non-mobile applications do not hold up under extreme ‘dimming’ or ‘battery saver’ mode. The figure illustrates how qualitative and sequential color schemes (after Brewer, Hatchard, and Harrower Citation2003; left column) become largely ineffective under 60% dimming (middle column). Han et al., drawing from designs concepts from Hoarau (Citation2011), use a multi-constraint optimization model to adapt conventional map color schemes for mobile viewing to account for reduced energy consumption and variable environmental viewing conditions (right column). Future work is needed to extend research on energy-aware color schemes to the other visual variables used in mobile maps and visualizations.
Adaptive color schemes are just one need for energy-aware symbolization, as each visual variable may have a different energy load just as they have different visual levels of organization (see Bertin Citation1967/1983). For instance, the use of grayscale proportional symbols using the visual variable size may remain legible under more extreme energy reduction than choropleth shading using color value steps. Further, the homogeneous color for proportional symbols or large choropleth enumeration units may require less energy to refresh the display when panned and zoomed compared to other visual variables requiring precisely alternating light and dark edges, such as orientation, texture, and even complex shapes used in iconic point symbols. The ultimate payoff from this line of research is an updated visual variable syntactics that accounts for both level of measurement (extending MacEachren Citation1995) and level of energy output to inform green cartography and visualization.
What is the role of imagery and realism in the mobile-first visual hierarchy?
The need for energy-aware symbolization is at odds with a major constraint of the mobile context: variable environmental viewing conditions requiring increased brightness and contrast within the visual hierarchy when displayed against direct sunlight (van Tonder and Wesson Citation2009; Roth et al. Citation2018). One proposed solution is imagery basemaps – which tend to be darker than simplified ‘street’ or vector basemaps – with map symbols and interface functionality in a higher-contrasting, lighter color to use energy economically across the display (Loeffler et al. Citation2021; see ). Abraham (Citation2019) found in a sample of 36 commonly used mobile maps that 91% use a light basemap option and only 25% had a dark basemap option such as imagery, a missed opportunity for energy-aware design.
Imagery basemaps are mosaiced and orthorectified aerial or satellite images (‘image maps’) converted into raster tilesets, often rendered at multiple scales and resolutions, with the resulting basemap tending to have greater visual complexity with more depth cues and visual occlusions (Dong et al. Citation2014). Remote sensing as a set of technologies and voluminous data source has transformed how cartographers work (Robinson et al. Citation1995; Kraak et al. Citation2020; see Murphy Citation2014 for a synthesis and review), but imagery as a basemap versus a data input disrupts conventional cartographic design considerations for establishing figure versus ground in the visual hierarchy (Tait Citation2018), and complicates the purposes of abstraction versus realism in cartography and visualization generally (MacEachren Citation1995). Geographic features captured in imagery compete for visual figure in unintended or counterproductive ways without intentional generalization, symbolization, and visual hierarchy, and therefore require new design considerations when overlaid with vector linework, point symbols, or labels to maintain organized hierarchy when imagery basemaps are used as the bottom layer in so-called ‘hamburger’ web cartography (Roth Citation2019b).
As with the default scale and level of detail discussed above, empirical research results are varied on the value of imagery basemaps on mobile maps and visualizations. While a simplified vector basemap may increase efficiency of identification and wayfinding tasks and lead to greater preference and confidence with a general audience due to removal of visual clutter on the small screen display (J. Dillemuth Citation2005; Davidson Citation2014; Bartling et al. Citation2021), a detailed basemap with imagery offers greater clues for landmark association, appears more accurate to general users, and could support a wider range of tasks (Woodruff Citation2007; Niroumand-Jadidi, Helali, and Alesheikh Citation2011; Bartling et al. Citation2021). Further, imagery basemaps can be enhanced to enforce a more consistent visual hierarchy among feature types through image processing techniques such as histogram segmented stretching, co-occurrence based texture filtering, and Gaussian low-pass filtering (e.g., Dong et al. Citation2014) or visual accenting techniques such as selective brightening, spotlight highlighting, light beam guidance, semantic focusing, tilt shift focusing, glow segregation, and visual downscaling (e.g., Murphy Citation2019). However, preliminary studies suggest that hybrid basemaps containing imagery and vector overlays perform poorer and are preferred less than their imagery or vector basemap counterparts (Konečný et al. Citation2011; Bartling et al. Citation2021). Accordingly, we need future research on existing and novel generalization, symbolization, and visual hierarchy design techniques specific to imagery for mobile maps and visualizations. Finally, mobile maps might also make use of near real-time cameras and sensors for their basemaps as a form of augmented reality, requiring novel dynamic visualization solutions to make sense of changing overlay information atop these live basemap streams (Çöltekin Citation2019b; Çöltekin et al. Citation2020).
How can mobile map icons be crosscultural, plural, and inclusive?
Among the most common symbols used on mobile maps are point of interest (POI) icons. In the same study referenced above, Abraham (Citation2019) found that 94% of the sampled mobile maps utilized POI markers but only 31% and 33% overlaid line or polygon symbols, respectively. Iconicity describes the degree to which a sign vehicle (e.g., a graphic map symbol) looks like its referent (e.g., a geographic feature) (MacEachren Citation1995), and map icons range from geometric shapes that bear little resemblance to their reference (i.e., a large interpretative distance) to pictorial designs that directly mimic their reference (Robinson et al. Citation1995). Further, associative icons resemble something associated with the referent that is easier to represent visually, but not the referent itself, and therefore often reflect a particular cultural, ethnic, geographic, political, religious, and sociodemographic context (Bell Citation2020; Kraak et al. Citation2020). Map icons typically are designed as coherent icon libraries that work within a particular use and user context (e.g., Dymon Citation2003; Kostelnick et al. Citation2008; Akella Citation2009; Robinson, Roth, and MacEachren Citation2010; Bianchetti et al. Citation2012), but may not be legible to audiences outside of this context.
Mobility exacerbates limitations of an impossibly ‘universal’ map icon library (after Costanza-Chock Citation2020), and therefore necessitates new approaches to icon design and cartographic design generally. Mobile map icons need to be considerate of and adaptive to cross cultural contexts as the maps and visualizations in which they are placed move across borders with their users. When well-designed, culturally-adaptive map icons may productively set expectations for visitors and instruct how to move and behave respectfully in new spaces. However, there is a range of lived experiences within any single setting that reflect the different intersectional identities and the associated interlocking systems of power and oppression (Nash Citation2008). Accordingly, data feminists have called for designs that rethink binaries – moving behind icons that default to ‘straight, white, rich men’ in their symbolism (D’Ignazio and Klein Citation2016; quoted in Kelly Citation2021, 548) – and that embrace pluralism – enabling diverse users to assemble personalized icon libraries that reflect their subjective experiences (D’Ignazio and Klein Citation2020). Three icon ‘modes’ may be useful while moving: exoicons (after exonyms for place names, which draw from the cultural backgrounds of the visitor), endoicons (after endonyms, which are community-curated), and egoicons (after egocentrism, which are unique to the visitor’s intersectional lived experience), with endoicons or egoicons displayed by default (see the following section on toponymy for additional details). Further, both the products and processes for icon design need to be more inclusive ‘to empower a broader collective of mappers and designers, supporting icons that relate to more people’ (Kelly Citation2021, 553), and thus many, layered sets of endoicons may be necessary for any single place. Mobile maps and visualizations potentially can serve as a platform for collecting and sharing plural, inclusive designs either digitally or through georeferencing of sketches, signage, verbal descriptions, etc. Ultimately, the icons are only as good as the underlying data they represent, so the mobile platform also can be used to infill known gaps and biases in open source, user-contributed geospatial databases to produce more accessible and inclusive mobile maps and visualizations (Rice et al. Citation2013; Stephens Citation2013).
What is mobile-first thematic map design?
Nearly all of the discussion in this section so far focuses on reference maps that catalog the position of many different kinds of geographic features in the landscape (e.g., POIs as discussed above), reflecting a current bias in the literature towards mobile maps that utilize location-based services for the purpose of wayfinding. However, scoping mobile-first symbolization beyond cartography to information visualization broadly (e.g., Lee et al. Citation2022) centers the need for representing abstract statistical information in addition to location information, revealing a pressing research and design gap for mobile-first and responsive thematic maps that depict variation of one or several attributes across the landscape. For instance, the cartographic canon prescribes a variety of thematic map design decisions based on the use and user context – such as class breaks, color schemes, scaling ratios … even the recommended thematic map type altogether – with nearly all empirical or time-tested guidelines based on static thematic map designs (Roth et al. Citation2017). Given the abrupt shift to interactive, online, and mobile platforms, we need to examine which thematic map design decisions should be fixed to the data (resulting in an intelligent thematic cartography), the user (resulting in an interactive thematic cartography), and the medium (resulting in a mobile-first thematic cartography), as well as when they need to be responsive across these contexts (Roth Citation2019b). Further, it may be fruitful to experiment with inventive, non-traditional ways of combining the visual variables to optimize information complexity on dynamic mobile displays, such as the recently proposed choriented maps for mobile that redundantly use orientation, transparency, and color (Gorte and Degbelo Citation2022; ).
Figure 9. Alternative thematic map types for mobile-first symbolization (adapted from Gorte and Degbelo Citation2022). Conventional thematic maps may be suboptimal for mobile, as a larger default cartographic scale and egocentric design may truncate a large portion of the mapped data. For instance, the current view may be entirely composed of a single color in mobile choropleth maps (A), leading to confusion about the symbol meaning and causing occlusion of any basemap information. Further, a proportional symbol may become disassociated from the enumeration unit border for mobile proportional symbol maps (B), leading to misinterpretation of the symbol as a point feature rather than the polygon centroid. Gorte and Degbelo proposed ‘choriented’ maps (C) that redundantly encode information using color value (the primary visual variable used in choropleth maps), orientation, texture, and transparency. The choriented symbol also can be applied as points (D) for mobile symbolization and interaction.
Mobile-first thematic map design relates to at least two transformative design trends impacting the practice of cartography and information visualization. First, mobile-first thematic maps and statistical visualizations increasingly are employed by data journalists as individual frames in a broader news story (Gray, Chambers, and Bounegru Citation2012; Wallace Citation2016; Cairo Citation2017). Visual storytelling describes stories communicated through illustrations, graphics, imagery, and video instead of or in addition to oral, written, and audio formats (Segel and Heer Citation2010; Caquard and Cartwright Citation2014), with data-driven visual stories combining quantitative and qualitative visualizations with text and other story content into an often linear sequence to make the presentation more intuitive, compelling, and relatable than text or individual maps and visualizations alone (Gershon and Page Citation2001; Riche et al. Citation2018). Mobile devices may be particularly adept at supporting specific kinds of visual storytelling genres – defined by the visual or interactive technique used to enforce linearity in the narrative sequence – and visual storytelling tropes – or visual design techniques applied not to represent data, but to advance the narrative and its elements (see Roth Citation2021 for a synthesis and review).
For instance, mobile news consumption is driving pervasiveness of the longform infographic genre, often described as ‘scrollytelling’ (Stolper et al. Citation2016), as the vertical arrangement of text, images, and graphics matches the vertical orientation of the mobile device when browser scrolling with touchscreens. While most longform infographics can be viewed on both mobile and non-mobile devices, newsrooms have experimented with a number of ways to reduce visual and interactive complexity for mobile, such as converting: an interactive thematic map or large series of static maps into an animated gif, an animated thematic map into a smaller set of static maps, a bivariate thematic map into a series of univariate maps, and a univariate map into a series of maps individually showing each thematic class (expanded from Horak et al. Citation2022); these responsive thematic map design solutions, and many others, remain untested. Further, the personalized story map genre often assumes a mobile use case, with users uploading text, photos, or videos georeferenced through the mobile device’s GPS receiver as story events unfold. Regardless of the genre, mobile viewing enables the visual story to be tailored to the user’s situated context and also supports users to contribute their own voice into the story, a powerful visual storytelling trope (see Pearce Citation2009, Citation2014) currently under-theorized for mobile. Despite their wide popular uptake, minimal empirical research or design discussion on visual storytelling explicitly considers mobile viewing (see Lee et al. Citation2018; Tabassum Citation2021, for counterexamples). Further, while mobile-first design affords many new opportunities for visual storytelling, personalized storytelling exacerbates many of the aforementioned concerns with mobile and the quantified self about privacy, surveillance, and marginalization.
Second, mobile-first thematic maps and statistical visualizations increasing are designed for viewing only at a moment’s glance, a use case pragmatically at the opposite end of a visual attention continuum from visual storytelling. Glanceable visualizations supply information quickly, often to support a secondary task when moving while attention is diverted from the primary task (Matthews Citation2006). A map or visualization is considered ‘glanceable’ if viewed completely within 500 milliseconds (Holcombe Citation2009) up to two seconds (Blascheck et al. Citation2018) and at most five seconds (Gouveia et al. Citation2015), and therefore glanceability requires simple representations designed for readily accessible displays like smartwatches or digital dashboards that fill a specific user need (Blascheck et al. Citation2022). Most examples of glanceable visualizations utilize very basic chart types, such as bar charts, line charts, and pie charts (Islam et al. Citation2020), suggesting that we first need to understand if and which types of mobile-first thematic maps can be glanceable at all. However, glaceable thematic maps relate to Bertin (Citation1967|1983) original distinction between the intuitive ‘maps to see’ that do not need consultation of a legend or other information to be understood and the more complex ‘maps to read’ that require additional description of the included symbols through labeling, annotation, legends, etc. Notably, a shift towards glanceable thematic maps for mobile already may be occurring, as Abraham (Citation2019) found that 89% of the sampled mobile maps were legendless. Thus, we need renewed investigation into Bertin’s levels of organization for visual attention (as expanded in MacEachren Citation1995) to establish perceptual, semantic, and affective difference thresholds for each visual variable and visual variable conjunction when employed for glanceable mobile maps and visualizations (see Klettner Citation2019, Citation2020, for potentially related approaches).
How can non-visual, multimodal symbolization and interaction be used in mobile maps?
‘Maps to see’ or ‘glanceable visualizations’ have the added benefit in their simplicity of being more easily translated into non-visual and multimodal symbols (Almeida Citation2011). There is an established body of explicitly cartographic research on the design of multimodal interfaces that support multiple kinds of user input instead of or in addition to graphical (i.e., visual) user interfaces (Golledge, Rice, and Jacobson Citation2006). However, there is far less attention on how to use non-visual methods for communicating geospatial information back to users, either as updated map symbolization or interaction feedback (Roth Citation2013b). Alternative, non-visual solutions supported by mobile devices include voice, gesture, and gaze-based input modalities and haptic, sonic, and tactile output modalities (Huang et al. Citation2018), with other sensory modalities such as scent or taste imagined with fully-immersive mobile technology (Brule et al. Citation2016).
Understanding non-visual and multimodal symbolization is important for mobile-first cartography and visualization for several reasons. The nature of a moving device means that user attention often is split on other activities (Reichenbacher Citation2001; Roth et al. Citation2018; Griffin et al. Citation2024), and thus non-visual, multimodal symbolization techniques support peripheral (T. Miller and Stasko Citation2002) or ambient (Pousman and Stasko Citation2006) maps and visualizations designed to supply non-essential or background information without diverting any visual attention (i.e., not even requiring a glance). Further, non-visual and multimodal symbolization and interaction are fundamental to realizing a truly inclusive cartographic design, as modality translation and transcription services still greatly underperform for maps and visualizations, mobile or otherwise (Cole Citation2021). Finally, non-visual, multimodal symbolization may support unique affective and emotional user experiences, with core concepts behind ambient and peripheral visualization initially described as ‘calm technology’ (Weiser and Brown Citation1996).
A reasonable starting point for research on non-visual, multimodal symbolization and interaction is extension of Bertin (Citation1967/1983; MacEachren’s (Citation1995) visual variable syntactics and DiBiase et al’s (Citation1992.) dynamic visual variable syntactics to other sensory modes. Krygier (Citation1994) and Griffin (Citation2001) provide foundation work on sonic (e.g., location, loudness, pitch, register, timbre, duration, rate of change, order, and attack/decay) and haptic (e.g., vibration, flutter, pressure, temperature, resistance, friction, kinaesthetic location) primitives respectively (). We need research to update and expand these primitive taxonomies to the capabilities of contemporary mobile devices, including two-dimensional versus three-dimensional augmented reality soundscapes (e.g., Schafer Citation1993). Further, we need additional research on the effective translation of symbol primitives across visual, sonic, and haptic modalities (Cole Citation2021). Useful insights for multimodal translation may be derived through competitive analysis of existing tactile symbol sets developed for non-sighted users and multimodal use (e.g., Lobben and Lawrence Citation2012). As support for multimodal symbolization becomes increasingly possible with mobile devices, perhaps the ultimate goal of this line of inquiry is creation of a comprehensive syntactics of symbol primitives that is responsive not just to the data level of measurement (as with the visual variable syntactics developed by Bertin Citation1967/1983; MacEachren Citation1995) but also to the symbolization mode and other aspects of the mobile use context.
Figure 10. Multi-modal variables for mobile-first symbolization and interaction (adapted from Roth Citation2017b). The visual variables are useful as a design framework not only because they articulate the finite dimensions by which a graphic can be varied to encode information, but also because their perceptual differences inform their application to data at different levels of measurement. Static (Bertin Citation1967/1983; MacEachren Citation1995) and dynamic (DiBiase et al. Citation1992; MacEachren Citation1995) visual variables therefore can be translated to sonic (Krygier Citation1994) or haptic (Griffin Citation2001) variables according to level of measurement as a starting point for multimodal symbolization on mobile devices. Note that the sonic and haptic variables currently are not evaluated for numerical data, and therefore multimodal symbolization requires classification to convert numerical data to ordinal classes. Importantly, the multimodal variable primitives also can be applied and translated as affordances and feedback during interaction.
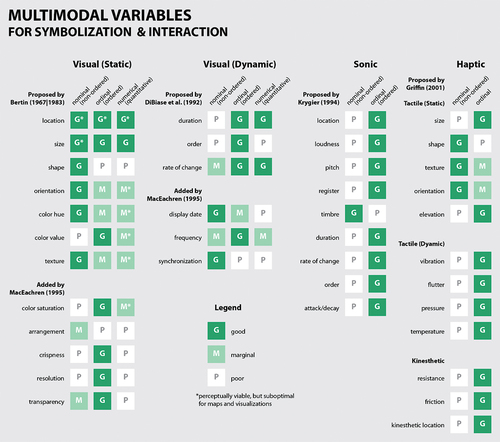
Mobile-first and responsive toponymy and typography
How can mobile map labels be cross-cultural, plural, and inclusive?
The first key challenge with mobile-first labeling is determining which and how many place names to display on the map as it moves across cultural, political, and social boundaries. Mobile-first toponymy dovetails with the above discussion on cross-cultural, plural, and inclusive symbolization, particularly in the role of enabling multiple alternatives and balancing sensitivity with usability when selecting endonyms, exonyms, and egonyms. The stakes with labels may be higher than some POI icons, as toponyms and particularly oikonyms of inhabited places often reinforce colonial or nationalistic histories and logics, and therefore are as much literal text clarifications for map symbols as they are markers of power and domination that cause real violence on communities as the maps are distributed as mass-produced visual culture (Berg and Vuolteenaho Citation2009; Rose-Redwood, Alderman, and Azaryahu Citation2010).
Accordingly, a cardinal concern of mobile-first labeling is the preservation of endonyms when moving. Endonyms are essential to the cultural heritage of Indigenous communities (Pearce Citation2008), yet, ‘The disappearance of Indigenous languages is accelerating dramatically under the weight of the global dominance of English and other major world languages [and] it is estimated that half of the world’s 7,000 languages are expected to be extinct by 2100’ (Rose-Redwood and Alderman Citation2011, 4, citing projected numbers from National Geographic). Preservation of endonyms is a mobile-first cartographic design issue in at least two ways. First, print and web map convention increasingly includes endonyms alongside exonyms to balance sensitivity and usability, but such redundancy may be unsuitable for smaller displays as the higher label density increases map complexity and reduces search efficiency (Liao et al. Citation2019); therefore, a choice of which label to include typically often must be made when adapting to mobile. Second, many of the technologies unpinning mobile maps and visualizations are proprietary, and thus have specific political economic interests that lead to the commodification of place naming rights and the use of banal naming practices where commodification is not lucrative to produce a neutral and ‘uncontestable’ landscape (Rose-Redwood and Alderman Citation2011, 3); cartographers therefore must invest in participatory and collaborative projects to develop open source endonym databases and co-develop processes that enable local and Indigenous communities to retain ownership over this information. Relevant examples include OpenStreetMap and Natural Earth, although even these efforts contain demonstrated omissions and have received valid critiques for serving the interests of the Global North (e.g., Stephens Citation2013; Peterson Citation2021).
Beyond preserving endonyms, mobile-first toponymy also needs to adapt to different languages, character sets, and reading directions (see Kraak et al. Citation2020 for examples), yet there are minimal empirical research studies or compelling design examples informing such responsive toponymy.
How should labels be placed on mobile maps and visualizations?
The second key challenge with mobile-first labeling is determining where selected names should be placed on the map when viewing on a mobile small screen. Much of the canon on label placement found in contemporary cartography textbooks is derived from Imhof (Citation1975), who drew from 150 years of professional practice to establish labeling guidelines for print maps organized by point, line, and area feature dimensionalities. While many of the overarching principles remain relevant to mobile maps and visualizations – such as minimizing overprinting to promote legibility and maintaining graphic association between the label and symbol – many of the specific recommendations for point, line, and area labeling have fallen out of practice for online and mobile maps and visualizations due to the constraints of the mobile platform. A comprehensive update to Imhof’s recommendations for labeling web rather than print maps is long overdue, yet typography has been relegated to a relatively minor research topic in cartography (see Guidero Citation2016, for an exception on label appearance that complements the call here for research on label placement), with research instead emphasizing the visualization of voluminous text documents on maps (i.e., turning labels and descriptions into symbols).
Considering how each of Imhof’s (Citation1975) print recommendations may respond to the constraints of a mobile use case may serve as a useful baseline for establishing mobile-first typography. For instance, Imhof recommends slanted and gently curved labels for line and area features to promote graphic association (i.e., the curve follows the primary trajectory of a line or major axis of an area). However, slanted and especially curved text renders inconsistently in web and mobile technology, and maintaining upright, horizontal text actually may be preferable on mobile maps and visualizations as a visual cue when rotating the handheld device to change the aspect ratio (Muehlenhaus Citation2013) or switching to an egocentric, oblique projection (Loeffler et al. Citation2021). The smaller screen size in particular is at odds with many of Imhof’s recommendations: repeated labels for line features likely is unnecessary for any single map extent on small screens, but labels for line and area features may need much more frequent repeating when panning the extent. Similarly, increasing tracking for area labels likely is not advisable as labels will more commonly stretch offscreen, limiting legibility; area labels could even follow the user while panning if the current map extent is still within the labeled area. Further, new label collision detection algorithms may be needed to go beyond label+label or label+symbol overprinting – as with the implementation of Imhof’s preferred positions in mapping software (see Kern and Brewer Citation2008 for a synthesis and review) – and in addition shift the label away from the edge of the small viewport while panning and zooming to avoid truncated labels. Any adaptive relabeling based on user interaction will have a performance and battery cost, so new label placement solutions will need to balance legibility in the small display with feasibility across a range of mobile devices.
Can labeling adapt to the user’s gaze?
A potential opportunity exists to clarify some of the aforementioned challenges in mobile-first toponymy and typography by taking advantage of the user’s gaze. Recent developments in machine learning now enable relatively reliable eyetracking using the cameras found on smartphones without requiring any additional sensors (Khamis, Alt, and Bulling Citation2018; Valliappan et al. Citation2020; Murali and Çöltekin Citation2021). Gaze-contingent displays describe maps, visualizations, and other digital applications that adapt content and styling to real-time eyetracking user data (Duchowski and Çöltekin Citation2007; Bektaş and Çöltekin Citation2018; Duchowski Citation2018). While gaze-contigent displays have potential applications for mobile-first generalization, symbolization, and interaction (Drewes, De Luca, and Schmidt Citation2007; Huang et al. Citation2018), a particularly promising avenue of research for mobile maps and visualizations is gaze-contingent labeling, adapting the label content, density, and placement based on the user’s gaze. Existing work on gaze-contingent labeling in cartography and visualization includes adjusting the label density based on the user’s foveal center (e.g., dense or redundant labels) versus visual periphery (less or no labels) (Bektaş et al. Citation2019) – a labeling solution based on the visual variable location that can be extended to other visual variables applied to the label such as size, color, etc. – as well as using historical user gaze patterns to refine label density and placement (e.g., Giannopoulos, Kiefer, and Raubal Citation2012; Anagnostopoulos et al. Citation2017; Kwok et al. Citation2019). Such systems also allow customized, even personalized labeling solutions, such as removing place names that are very familiar and therefore unnecessary to a user to make room for new, task-relevant information.
Empirical research on gaze-contingent labeling remains in its infancy, suggesting a number of open research questions. For instance, how can we further improve the precision and therefore utility of mobile gaze detection without processing and rendering latency or excessive draining of battery life? This question is gaining interest in various interdisciplinary communities related to mobile eyetracking, and it seems that there may be viable, unobtrusive technological solutions available soon to enable previously unattainable research and development on gaze-continent displays (e.g., Palazzi et al. Citation2018; ). Further, what are the effects of gaze-contingent labeling on the mobile user experience, and what are the best ways to design gaze-contingent labeling to meet and even enhance the perceptual and cognitive abilities of the users of mobile maps and visualizations? Research at the intersection of gaze-contingent displays and aforementioned AR and MR technologies offer one potentially promising path forward, extracting and adapting labels both the surrounding, real environment and digital content layered atop this real scene (e.g., Koulieris et al. Citation2018, Citation2019).
Figure 11. Enabling gaze-contingent displays (adapted from Palazzi et al. Citation2018). The DR(eye)VE project uses mobile eyetracking and extended reality to create real-time, task-specific saliency maps. DR(eye)VE uses a roof-mounted camera (top-left) to segment a video stream in real-time (top-right), with the figure showing the extraction of humans and cars from other background information. The driver’s gaze fixations (bottom-left) then can be combined with the video stream to great an augmented or mixed reality display (bottom-right). While Palazzi et al. specifically developed DR(eye)VE to study drivers’ focus of attention, future applications might include gaze-contingent generalization, projection, symbolization, typography, and interaction.
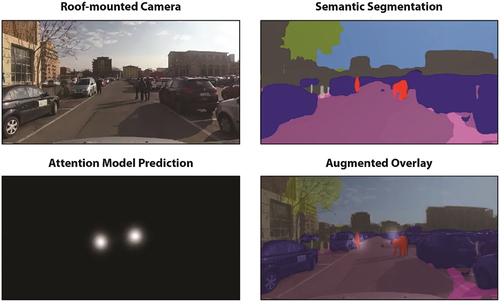
What role do text and audio messages play in mobile map and visualization design?
A final challenge for mobile-first labeling is determining what textual information should not be placed on the map, and instead (or in addition to) delivered through popup text or audio messages. While used somewhat interchangeably, a notification presents information about the current system state and use context, such as a reminder on an upcoming turn or meeting, while an alert is triggered by a change to the system state and use context, such as an upcoming traffic accident or wrong turn ().
Text and audio wayfinding notifications based on GPS directions are a polarizing topic in cartography and visualization (Ishikawa Citation2019; Griffin et al. Citation2024), with many studies warning of the deleterious impact of automated navigation assistant on spatial cognition and environmental knowledge acquisition (Burnett and Lee Citation2005; Münzer et al. Citation2006; Ruginski et al. Citation2019). However mobile users may prefer text instead of visuals when unfamiliar with the landscape (Zhu et al. Citation2022), and environmental learning may improve when notifications may include prompts to actively engage with the environment in addition to turn-by-turn directions (Brügger, Richter, and Fabrikant Citation2017, Citation2019; Thrash et al. Citation2019).
Beyond wayfinding, text and audio notifications and alerts likely play an important role in managing split attention when using a map or visualization while moving. Text and audio alerts may be helpful during unsafe or time-sensitive user contexts to facilitate attention transition between the real-world and the map or visualization (Roth et al. Citation2018). Alerts also may be useful in less critical contexts to maintain baseline awareness of surroundings while deeply focusing away from the map or visualization, a specific application of the aforementioned ambient visualization sometimes described as casual visualization (Pousman, Stasko, and Mateas Citation2007). Finally, supplying an alternative audio option for text – whether for urgent text alerts and notifications or just contextual context broadly – improves accessibility for non-sighted users, and therefore supports inclusive design (Roth et al. Citation2018; ). As with other research on mobile-first labeling, minimal empirical research studies or compelling design examples informing such mobile-first notifications and alerts.
Figure 12. Mobile-first user experience design of Global Madison (adapted from Roth et al. Citation2018). Global Madison (www.geography.wisc.edu/globalmadison) is a free guided tour that uses the streets of Madison WI (USA), as a mobile classroom for teaching and learning about globalization in introductory courses on Geography and International Studies at the University of Wisconsin−Madison. The figure depicts the recently released version 2.0 of Global Madison, an update from version 1.0 shown in Roth et al. (Citation2018). 2018 A: The landing page provides basic background about the guided tour and recommendations for best mobile viewing. B: All website assets are cached to the browser from the landing page so that students can download larger image and audio files while on campus wireless, enabling offline viewing away from campus to prevent a cost to student data plans; students begin the tour by clicking the ‘Go to the Map!’ button, setting the expectation for all future UI widgets to use red as the primary visual affordance. C: A startup tooltip highlights the first location on the tour, instructing students to click on the icon when arriving at the site. D: Clicking the first site activates a dialog window covering the entire viewport that contains information about the site; students either can read chunked story text with images or listen to an audio recording of the text with descriptions for images. E: A route is presented between sites to support wayfinding, along with a context point cloud of additional landmarks to explore along the guided tour; at any time, the user can search for their location (shown in blue), but an egocentric ‘tracking mode’ is not updated continuously to preserve battery life while walking along the tour (versus driving or flying, where charging is possible). F: Students capture notes for three critical thinking prompts at each site regarding globalization – interdependencies, inequalities, and alternatives – which are then compiled for their ‘visual essay’ assignment extending and enriching Global Madison content with pictures and descriptions of their own reading of the landscape while completing the guided tour. G: Text and audio alerts are presented for unsafe crossings and other important warnings identified from past iterations of the assignment. H: Advanced functionality is minimized through a ‘hamburger’ menu placed at the bottom of the display for thumb-based interaction. I: The guided tour is responsive for non-mobile to support writing of the visual essay after completing the guided tour, with the non-mobile map having a smaller default scale, geolocation deactivated, smaller icons and typeface for non-touch pointing, and a persistent UI footprint at the top of the page typical for Western reading.
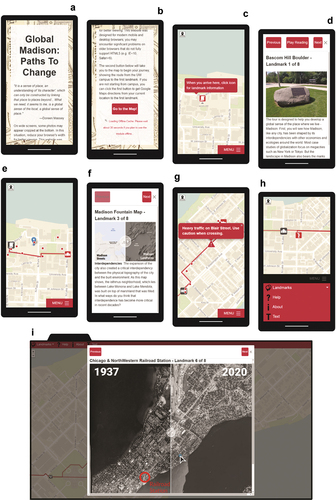
Mobile-first and responsive user interaction
How do interaction operators and interaction strategies differ between mobile and non-mobile maps and visualizations?
Representation design (e.g., the topics of scale/generalization, projections, symbolization/visual hierarchy, and toponymy/typography treated so far in this article) and interaction design increasingly are treated as complementary needs for mobile-first UX in both research and practice (Buja, Cook, and Swayne Citation1996; Roth Citation2013b). Despite now numerous calls across the past quarter century for expanded research on interactive maps and visualizations (e.g., Nyerges et al. Citation1995; MacEachren and Kraak Citation1997; Cartwright et al. Citation2001; Haklay Citation2010; Ricker, Daniel, and Hedley Citation2014; Roth et al. Citation2017), ‘we have only just begun to scratch the surface on formalizing the understanding of interaction needed to develop interaction design guidelines’ (MacEachren Citation2013, 168). Further, the few empirical studies on interactive maps and visualizations tend to emphasize open-ended exploration with large screen displays often showing multiple coordinated views (e.g., MacEachren et al. Citation1998; Andrienko et al. Citation2002; Edsall Citation2003; Robinson Citation2008; Çöltekin et al. Citation2009; Roth and MacEachren Citation2016; Vincent et al. Citation2019), meaning the results may be only tangentially useful for mobile-first interaction design (see Savino et al. Citation2021 for a notable exception). Arguably, however, it is interaction and not representation that more clearly distinguishes mobile from non-mobile use cases because of the aforementioned possibility of multimodal input and output and, in particular, the reliance on direct, touch-based interaction over traditional indirect pointing devices like a mouse or touchpad (Shneiderman and Plaisant Citation2020). Further, interaction potentially can solve many of the constraints imposed by mobile technology, such as a small screen and limited bandwidth, but too often adds unnecessarily complexity that confuses rather than clarifies mobile maps and visualizations (Haklay and Nivala Citation2010). Accordingly, mobile-first interaction design is among the most pressing research gaps facing cartography and information visualization.
An important first step in understanding interaction, mobile-first or otherwise, is articulating the basic interaction primitives available during design (Thomas et al. Citation2005; Pike et al. Citation2009), a similar foundational framework that the previously discussed visual, sonic, and haptic primitives serve for representation design. While cartography (e.g., Dykes Citation1997; MacEachren et al. Citation1999; Roth Citation2013a) and information visualization (e.g., Becker and Cleveland Citation1987; Buja, Cook, and Swayne Citation1996; Yi et al. Citation2007) are beginning to coalesce around a common set of interaction operators – or generic and repeatable ways to manipulate a digital representation interactively (see Roth Citation2012; Citation2017a, for a synthesis and review of operator primitive taxonomies for maps and visualizations) – these need to be expanded (or, for some operators, potentially contracted) for mobile maps and visualizations as multi-touchscreen interfaces afford a wider range of natural interactions congruent with the way humans manipulate tangible objects in our surrounding environment (MacEachren et al. Citation2005). For instance, a number of touch interactions for manipulating the user’s viewpoint, such as rotate from north-as-up and tilt into an oblique perspective, typically fall under the blanket ‘reproject’ operator but arguably warrant treatment as their own primitives in mobile-first interaction research and design given the importance of egocentric projections (Sack Citation2013). While not specific to mobile, Newbury et al. (Citation2021) describe additional operators possible through natural gesturing that may be useful on mobile devices, such as reveal hidden maps features and link/unlink related features. Ultimately mobile-first interaction requires reevaluation of work operators (i.e., those that accomplish a user’s goal) versus enabling operators (i.e., supporting operators that can be constrained to improve efficiency) on maps and visualizations (after Whitefield et al. Citation1993; Davies Citation1998), as traditionally enabling operators such add/delete, annotate, edit, and share may be core to the mobile user experience.
A logical next step towards mobile-first interaction design is understanding how users follow different interaction strategies between mobile and non-mobile use cases in the type, frequency, and sequence of operators employed. Analyzing the interaction operators implemented in existing mobile maps and visualizations provides a look into potential interaction strategies of users, at least the interaction strategies imagined by the designers. Abraham (Citation2019) found several commonalities between mobile and non-mobile (as compared to Roth et al. Citation2014) interactive functionality, such as common inclusion of conventional ‘slippy map’ operators like pan, zoom, retrieve, and overlay. However, Abraham found several notable differences (), such as: increased support in mobile maps and visualizations for the typically uncommon reproject and rotate operators (implemented in 47% and 61% of the mobile sample, respectively, perhaps due to the value of egocentric projections) as well as the arrange operator (implemented in 53% of the mobile sample, perhaps due to the increased demand of screen real-estate on mobile displays); decreased support for some operators associated with exploration and information-seeking (such as reexpress and resymbolize, found in 0% and 3% of the mobile sample, respectively); general preference for search (72%) over filter (50%) in the mobile sample, suggesting a lean towards non-specialists users with simpler objectives; and increased support for enabling operators, particularly export supplied in the form of a ‘share’ function (75%). Further, while repeated panning and detail retrieval interaction sequences suggest that a user may be lost or confused on both mobile (Bartling et al. Citation2021) and non-mobile (Roth and MacEachren Citation2016) maps and visualizations, such suboptimal interaction sequences also might include repeat zooming on mobile maps and visualizations, as the map scale may be better tied to the mode of travel (i.e., speed, as discussed above) rather than determined by the user interactively (Bartling et al. Citation2021).
Figure 13. Frequency of mobile interaction operators (adapted from Abraham Citation2019). Abraham analyzed 36 of the most popular, English-language mobile mapping apps according to the AndroidRank.org and SensorTower.org websites. The analysis revealed a number of trends and gaps in how mobile apps employ data services, map representations, and, in particular, interactive functionality. While emerging conventions are not appropriate in all mobile contexts, Abraham’s analysis does provide a benchmark study for understanding the contemporary landscape of mobile map UX and, by proxy, user expectations for mobile maps and visualizations.
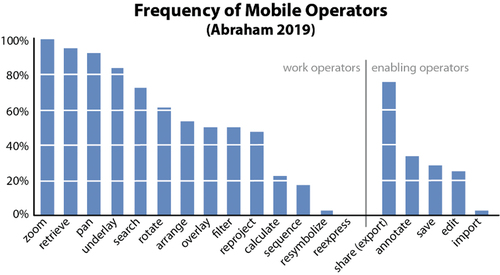
Taken together, we need future empirical research on mobile versus non-mobile interaction operators and interaction strategies to produce actionable design insights for mobile maps and visualizations. While mobile eyetracking is increasingly possible for research on environmental cognition and wayfinding (e.g., Kiefer, Giannopoulos, and Raubal Citation2014), a key methodological barrier to achieving this goal is disambiguating touch interactions with mobile maps and visualizations and then integrate these interaction logs with eye tracking data (Ooms, De Maeyer, and Fack Citation2014), particularly for mobile applications developed through proprietary, third-party development tools (Savino et al. Citation2021). Thus, we need open source solutions for mobile interaction logging supported by the geospatial community to expedite future research on mobile-first interaction.
What is the efficacy of emerging user interface (UI) solutions for mobile interaction operators?
A common distinction is made in the UX literature between the basic interaction operators and the user interfaces (UIs) – graphical or multimodal – that implement these operators (Beaudouin-Lafon Citation2004), with generalizable and reproducible insights on interaction operators and strategies typically established through controlled scientific experiments and transferable and contextual insights on UI solutions triangulated through user-centerd design studies on novel mobile maps and visualizations (Sedlmair, Meyer, and Munzner Citation2012; Roth Citation2019a). Key to effective UIs is design of their affordances, or signals about how to use the interface, and feedback, or signals about what happened as a result of using the interface (Norman Citation1988), with affordances and feedback forming the ‘glue’ in a two-way interaction exchange regardless of the supported operator.
Mobile devices supply an expanded range of design channels for UI affordances and feedback, which, like multimodal symbolization discussed above (), might include voice, gesture, and gaze-based input modalities and haptic, sonic, and tactile output modalities (Huang et al. Citation2018). However, mobile devices tend to constrain visual affordances and feedback for interaction design because multi-touchscreen interaction typically does not support a hover or ‘mouse-over’ state to indicate if a feature is interactive. Industry conventions have driven a number of intuitive, but untested direct manipulation operator+interface solutions that do not include visual affordances (feedback is provided as changes to the map or visualization), including single tap to retrieve map details, double tap or pinch to zoom in, grab-and-drag to pan, two-finger twist to rotate, and two-finger scroll to tilt (Muehlenhaus Citation2013). While these UI solutions are now commonplace on the mobile platform, they still must be learned initially, leading to inefficiency and errors for new users as well as the potential for some users to miss some or all supported interactivity altogether (Roth and Harrower Citation2008). There also remain a number interaction operators without conventional or intuitive direct manipulation pairings (e.g., the lack of awareness of Google Maps’ double tap and scroll to zoom out; PCMag Citation2016) or possible touch gestures that have not yet been combined with interaction operators on maps (see Brehmer et al. Citation2022 for a review of design studies containing direct manipulation touch strategies largely unapplied on maps).
Perhaps as a result, several recommendations and best practices have emerged to add visual affordances and feedback to mobile-first interfaces specifically or to increase the saliency of interactive features broadly. Skeuomorphism, or UI designs that resemble their real-world counterparts, can induce interaction with a feature and even suggest how the map or visualization may behave as a result of interaction (Page Citation2014). While skeuomorphism has been critiqued in favor of ‘flat’ design, particularly for being excessively heavy-handed on mobile devices where screen real-estate is limited, subtle use of textures and shadowing can evoke a tactile metaphor that encourages interaction, such as adding raised or depressed lines beneath a map symbol (e.g., Stevens, Robinson, and MacEachren Citation2013) or as part of a menu selection interface (e.g., the classic ‘hamburger’ icon found in many responsive design frameworks; ). Even flat design can employ the visual variables consistently to produce a visual grammar of what is and is not interactive that is learned once by the user, such as making all interactive features a single color hue elevated on the visual hierarchy (e.g., the use of red for interactive map symbols and widgets in Roth et al. Citation2018; ). Layout also increasingly is used as a visual affordance: menus, buttons, sliders, and other interface widgets often are arranged at the top or left of the layout on non-mobile maps and visualizations to conform to Western reading (i.e., so that key interactive features are seen first when arriving at the map or visualization), but typically are repositioned to the bottom of the layout for mobile to be closer to the user’s thumbs, improving efficiency on handheld mobile devices (Kraak et al. Citation2020). As a result, there are a growing array of explicitly mobile-first interface widgets that draw on thumb-primacy in UI (Loeffler et al. Citation2021), such as bottom navigation tabs (, f-h), floating action buttons (, d), and pull-up menus ().
We need empirical research to understand the efficacy of these emerging mobile-first interface design strategies for different interaction operators and use cases. Implementing multiple interface solutions for a single operator empowers users with flexibility to determine preferred strategies across mobile/non-mobile platforms and user tasks (see Harrower and Seesley Citation2005; Schwab et al. Citation2019 for baseline research on panning and zooming flexibility that can be expanded to other operators). The ultimate goal of this line of inquiry is understanding the relative advantages and disadvantages of each UI technique and then building interface flexibility from this understanding to account for pitfalls of any single solution. Finally, the hover state may be supported on larger mobile devices with a stylus or optical pen or smaller mobile devices through variable force pressure sensitivity or even eyetracking much like gaze-aware labeling. Thus, WIMP interfaces remain relevant to mobile-first interaction design, and we need more domain needs assessments at the start of a user-centered design project to determine the degree that multi-touchscreens pose actual constraints on visual affordances and feedback (Robinson et al. Citation2005).
What mobile interaction operators can be performed through spatial, tangible and embodied interaction?
Most of the above discussion considers mobile devices as a computing platform for viewing and interacting with digital maps and visualizations, which they are. Importantly, mobile devices also are physical objects in the real-world, and afford a unique interaction modality beyond fixed, non-mobile devices: movement of the device itself. Brehmer et al. (Citation2022, 82) describe this quality of mobile devices as spatial interaction and, in its simplest form, includes interactions with the map or visualization based on changes detected by the GPS receiver when physically carrying the mobile device through the landscape. Such spatial interaction makes sense for operators that change the user’s viewpoint, such as pan, zoom, and rotate, but may be extended with geofencing to activate an interaction operator when reaching a specific location on the map rather than requiring the user to manipulate the map as an added interaction (e.g., detail retrieval when arriving at a POI or recalculation of a route when missing a turn). Intentional changes in speed, direction, and elevation – as detected through the mobile device’s accelerometer, compass, and barometer, respectively (Abraham Citation2019) – also may trigger different interaction operators. Geofencing and other spatial interactions exacerbate privacy concerns as a form of passive or background collection of locational information as compared to other more active and voluntary contributions (Wilson Citation2012; Roche Citation2020), and while some techniques have been proposed to mask privacy during spatial interaction (e.g., Bareth Citation2012; Bohli et al. Citation2014; Bösch Citation2018), enforcement of government regulations and professional standards remains complicated (Kerski Citation2016).
Beyond spatial movement, mobile devices increasingly are outfitted with sensors that support tangible interaction, or interactions with a physical object that transform digital information and renderings (Ishii and Ullmer Citation1997). Tangible interfaces replace skeuomorphism and the idea of the ‘graphical’ user interfaces altogether, allowing the visual affordances and feedback of the physical object (e.g., the perceived or anticipated size, weight, graspability, portability, etc., of the device) to inform user interaction (Maher and Lee Citation2017). Regarding common mobile devices like smartphones and tablets, tangible interactions may: exert internal pressure onto the device through the multi-touchscreen or other buttons, with different levels or lengths of pressure executing different interaction operators (after Griffin Citation2001); change the external, three-dimensional orientation of the device through rotating, tilting, shaking, or throwing, as captured by the gyroscope (e.g., Dachselt and Buchholz Citation2009); drag an object across a surface, such as the aforementioned examples of pen- or stylus-based WIMP interaction; or bring separate surfaces together in support of, for instance, coordinated visualization and geocollaboration (e.g., Langner, Horak, and Dachselt Citation2017). Many of these embodied interactions work at an operating system level on mobile devices, and thus are becoming more familiar to users, but a range of inventive solutions can be imagined that directly interact with the map or visualization, such as tilting and rotating to a landscape aspect ratio to activate a menu of advanced options like filtering otherwise deactivated during portrait viewing (Roth et al. Citation2018) or shaking and throwing to filter without additional digital interfaces (Newbury et al. Citation2021).
Finally, new and emerging mobile platforms (as introduced below) are combining spatial and tangible interactions with new hardware to support embodied interaction, enabling bodily movements of users to register within and affect change to an immersive map or visualization (Dourish Citation2004; Newbury et al. Citation2021). Embodiment is a crosscutting UX design challenge promoted across cognitive/scientific (Kessell and Tversky Citation2006; Oulasvirta, Estlander, and Nurminen Citation2009) and critical/feminist (Nold Citation2009; D’Ignazio and Klein Citation2016) approaches as a more useful, meaningful, and inclusive interaction with maps and visualizations. The intersection of cartography and video gaming (e.g., Ahlqvist Citation2011; Lammes and Wilmott Citation2018) is a potentially fruitful avenue for researching embodied mobile interactions, as video games often employ a virtual avatar whose bodily movements manipulate the game space and overview map in complex ways beyond that found in typical mobile maps and visualizations (Thorn Citation2018). Reverse-engineered avatar interactions make sense for operators that change the user’s viewpoint like pan and rotate (using the body, or what Meng Citation2005, 9, described as a ‘movable piece’, on the map), but may be applicable for other operators as well. However, embodied interactions raise new questions around disability and inclusivity, with any embodied interaction strategy needing to be accessible to a full range of bodies and embodied abilities (D’Ignazio and Klein Citation2020). At its best, embodied interactions with maps and visualizations may enable users to experience the geographic places and processes they otherwise could not access, making the user experience more robust for all (Shum et al. Citation2016).
What new constraints, enablements, and consequences are possible with emergent mobile platforms?
Finally, cartographers and visualization designers need to remain at the bleeding edge of new mobile technology, continually testing our design frameworks and recommendations against the constraints, enablements, and consequences of the latest mobile platforms. Overemphasizing the technology de jour in research is risky given the breakneck pace of technological change in the mapping industry, rendering some projects irrelevant before they can be published (Roth Citation2013b). However, we argue that mobile represents a noteworthy exception to this rule given its potentially transformative impact on society. Mobile platforms that appeared gimmicky or niche only several years ago have become mainstream today as the mobile technology industry grows to nearly five trillion USD worldwide (Okeleke and Suardi Citation2022). Cartographers have an important role to play in shaping the trajectory of mobile technology because it is inherently spatial and geographic.
Emergent mobile platforms include wearable technologies that enable glanceable viewing and embodied interaction, such as smartwatches, pedants, belts, and even temporary tattoos with digital ink (Brehmer et al. Citation2022). Further, head-mounted wearables such as glasses and headsets can support augmented and mixed reality in the mobile environment, as introduced above, bridging mobile-first design with cartographic research and practice on 3D, virtual, and immersive environments (e.g., Çöltekin et al. Citation2016; Stachoň, Kubicek, and Herman Citation2020). Beyond wearables, autonomous vehicles present a mobile use case that entirely envelopes the body and requires high-definition displays and new interfaces to keep humans in the loop to safely inform automated driving (Meng Citation2020), a research and development need promoted as a top priority in the most recent research agenda of the International Cartographic Association (Meng et al. Citation2021).
Finally, emerging mobile platforms increasingly support cross-device interaction (Huang et al. Citation2018). Cross-device interaction includes a single user combining interactions across multiple personal devices such as a smartwatch, smartphone, and tablet – with one display controlling or coordinating with others (e.g., Langner, Horak, and Dachselt Citation2017; Horak et al. Citation2018) – or multiple users working with one or several linked mobile devices, enabling social interaction when moving (Dalton, Hölscher, and Montello Citation2019; Bae and Montello Citation2019) or distributed geocollaboration when fixed in place (Cheng et al. Citation2015; Brudy et al. Citation2018). Lagner et al. (Citation2022) emphasize the social dimensions in their definition of mobile visualization, yet the vast majority of existing research on mobile maps and visualizations assumes a single user working privately, a clear research and design need for mobile maps and visualizations moving forward.
Summary and outlook
In this article, we present a collective research agenda facing mobile-first and responsive cartographic design. We begin by outlining a partial design space for mobile-first and responsive maps and visualizations, situating these design considerations within the constraints, enablements, and consequences of mobile technology. We then present 20 research challenges facing mobile-first and responsive cartography and visualization, using the partial design space to propose potentially fruitful avenues of future research to address these questions. Research challenges are organized accordingly to five dimensions (i.e., sets of design decisions) of the design space: (1) scale and generalization, (2) projections, (3) symbolization, (4) toponymy and typography, and (5) user interaction. The agenda crosses and organizes a range of research foci in cartography and visualization – such as augmented/mixed reality, indoor/outdoor mapping, egocentrism, focus+context techniques, energy-aware design, glanceable visualization, visual storytelling, UI/UX design, multi-modal and embodied interaction, and inclusive design – and we center conceptual, practical, and critical questions for design throughout.
While our focus in this article was explicitly on design, collectively working through the research agenda illuminated a number of more meta-level questions intersecting mobile-first and responsive cartographic design. Questions include:
What design topics are missing from the partial design space? Are there any design considerations specific to mobile that are otherwise not relevant to print or web cartography and visualization?
What new emerging consequences arise as mobile-first and responsive cartographic design evolves? How much of a map or visualization should be responsive to mobile, and how do we evaluate the tradeoffs in selective responsive design? When should a map or visualization explicitly not be mobile?
How should lessons learned from research and development in mobile-first and responsive cartography and visualization be translated into educational and professional settings? How is learning or evaluation different given that the students or users need to be situated in real-world environments to fully experience the mobile map or visualization?
How should mobile maps and visualizations be archived to retain a design record of our past that informs potential futures. Can such an archive be platform independent?
What is the role of cartographers in shaping mobile technology itself? What benefits does our expertise hold for improving the mobile user experience beyond maps and visualizations themselves?
More maps are viewed on mobile devices today than in any other format, media, or platform, yet much of the cartographic canon we teach and practice was established for the design of printed maps. In this article we ask: How must cartographic design adapt to consider the mobile context first? The promise of such research and development is a more useful and inclusive user experience with mobile maps and visualizations, and ultimately a deeper and more meaningful engagement with places as we move through them.
Disclosure statement
No potential conflict of interest was reported by the author(s).
References
- Abraham, L. 2019.Where Do We Go from Here? Understanding Mobile Map Design, Geography. Madison:University of Wisconsin-Madison.
- Ahlqvist, O. 2011. “Converging Themes in Cartography and Computer Games.” Cartography and Geographic Information Science 38 (3): 278–285. doi:10.1559/15230406382278.
- Akella, M. K. 2009. “First Responders and Crisis Map Symbols: Clarifying Communication.” Cartography and Geographic Information Science36 (1): 19–28. doi:10.1559/152304009787340179.
- Almeida, R. 2011. “Bertin Graphic Semiology and Its Relevant Contributions for Research and Teaching in Brazil.” Paper read at 25th International Cartographic Conference-ICA, International Cartographic Association. Paris.
- Anagnostopoulos, V., M. Havlena, P. Kiefer, I. Giannopoulos, K. Schindler, and M. Raubal. 2017. “Gaze-Informed location-based Services.” International Journal of Geographical Information Science 31 (9): 1770–1797. doi:10.1080/13658816.2017.1334896.
- Anderson, M. 2016 “More Americans Using Smartphones for Getting Directions, Streaming TV.” Pew Research Center (blog). Accessed August 1, 2022. http://www.pewresearch.org/fact-tank/2016/01/29/us-smartphone-use/.
- Andrienko, N., G. Andrienko, H. Voss, F. Bernardo, J. Hipolito, and U. Kretchmer. 2002. “Testing the Usability of Interactive Maps in CommonGIS.” Cartography and Geographic Information Science 29 (4): 325–342. doi:10.1559/152304002782008369.
- Armstrong, M. P., and D. A. Bennett. 2005. “A Manifesto on Mobile Computing in Geographic Education.” The Professional Geographer 57 (4): 506–515. doi:10.1111/j.1467-9272.2005.00495.x.
- Bae, C. J., and D. R. Montello. 2019. Dyadic Route Planning and Navigation in Collaborative Wayfinding. Paper read at 14th International Conference on Spatial Information Theory (COSIT 2019), Regensburg, Germany.
- Bareth, U. 2012. Privacy-aware and energy-efficient geofencing through reverse cellular positioning. Paper read at 2012 8th International Wireless Communications and Mobile Computing Conference (IWCMC), Limassol, Cyprus.
- Bartling, M., C. R. Havas, S. Wegenkittl, T. Reichenbacher, and B. Resch. 2021. “Modeling Patterns in Map Use Contexts and Mobile Map Design Usability.” ISPRS International Journal of Geo-Information 10 (8): 527. doi:10.3390/ijgi10080527.
- Bartling, M., A. C. Robinson, B. Resch, A. Eitzinger, and K. Atzmanstorfer. 2021. “The Role of User Context in the Design of Mobile Map Applications.” Cartography and Geographic Information Science 48 (5): 432–448. doi:10.1080/15230406.2021.1933595.
- Battersby, S. 2017. “Map Projections.” In Geographic Information Science & Technology Body of Knowledge, edited by J. P. Wilson:UCGIS. doi:10.22224/gistbok/2017.2.7.
- Battersby, S. E., D. D. Strebe, and M. P. Finn. 2017. “Shapes on a Plane: Evaluating the Impact of Projection Distortion on Spatial Binning.” Cartography and Geographic Information Science 44 (5): 410–421. doi:10.1080/15230406.2016.1180263.
- Battersby, S. E., M. P. Finn, E. L. Usery, and K. H. Yamamoto. 2014. “Implications of Web Mercator and Its Use in Online Mapping.” Cartographica: The International Journal for Geographic Information and Geovisualization 49 (2): 85–101. doi:10.3138/carto.49.2.2313.
- Beaudouin-Lafon, M. 2004. Designing Interaction, Not Interfaces. Paper read at Advanced Visual Interfaces, at Gallipoli, Italy.
- Becker, R. A., and W. S. Cleveland. 1987. “Brushing Scatterplots.” Technometrics 29 (2): 127–142. doi:10.1080/00401706.1987.10488204.
- Bektaş, K., and A. Çöltekin. 2018. “GeoGCD: Geographic Gaze Contingent Display. Paper read at Eye Tracking for Spatial Research” Proceedings of the 3rd International Workshop. ETH Zurich, Zurich, Switzerland.
- Bektaş, K., A. Cöltekin, J. Krüger, and A. T. Duchowski. 2015. “A Testbed Combining Visual Perception Models for Geographic Gaze Contingent Displays”Proceedings of Eurographics Conference on Visualization (EuroViz), Cagliari, Italy. The EuroGraphics Association. doi:10.2312/eurovisshort.20151127.
- Bektaş, K., A. Çöltekin, J. Krüger, A. T. Duchowski, and S. I. Fabrikant. 2019. “GeoGCD: Improved visual search via gaze-contingent display.” Paper read at Proceedings of the 11th ACM Symposium on Eye Tracking Research & Applications, Denver, Colorado.
- Bell, S. 2020. “Map Icon Design.” In Geographic Information Science & Technology Body of Knowledge, edited by J. P. Wilson:UCGISdoi:10.22224/gistbok/2020.1.6.
- Berg, L. D., and J. Vuolteenaho. 2009. Critical Toponymies: The Contested Politics of Place Naming. Surrey, England: Ashgate Publishing. http://www.google.com/books/edition/Critical_Toponymies/xg1GAepFft8C?hl=en &gbpv=1&pg=PR3&printsec=frontcover.
- Bertin, J. 1967/1983. Semiology of Graphics: Diagrams, Networks, Maps. Madison, WI: University of Wisconsin Press.
- Bestgen, A.-K., D. Edler, C. Müller, P. Schulze, F. Dickmann, and L. Kuchinke. 2017. “Where Is It (In the Map)? Recall and Recognition of Spatial Information.” Cartographica: The International Journal for Geographic Information and Geovisualization 52 (1): 80–97. doi:10.3138/cart.52.1.3636.
- Bianchetti, R. A, J. O Wallgrün, J Yang, J Blanford, A. C Robinson, and A. Klippel. 2012. “Free Classification of Canadian and American Emergency Management Map Symbol Standards.” The Cartographic Journal 49 (4): 350–360. doi:10.1179/1743277412Y.0000000022.
- Biermann, F., N. Kanie, and R. E. Kim. 2017. “Global Governance by goal-setting: The Novel Approach of the UN Sustainable Development Goals.” Current Opinion in Environmental Sustainability 26–27:26–31. doi:10.1016/j.cosust.2017.01.010.
- Blascheck, T., F. Bentley, E. K. Choe, T. Horak, and P. Isenberg. 2022. “Characterizing Glanceable visualizations: From Perception to Behavior Change.” In Mobile Data Visualization, edited by B. Lee, R. Dachselt, P. Isenberg, and E. K. Choe, 151–175. Boca Raton: CRC Press.
- Blascheck, T., L. Besançon, A. Bezerianos, B. Lee, and P. Isenberg. 2018. “Glanceable Visualization: Studies of Data Comparison Performance on Smartwatches.” IEEE Transactions on Visualization and Computer Graphics 25 (1): 630–640. doi:10.1109/TVCG.2018.2865142.
- Bohli, J. M., D. Dobre, G. O. Karame, and W. Li. 2014. “PrivLoc: Preventing Location Tracking in Geofencing Services.”Paper read at International Conference on Trust and Trustworthy Computing, Heraklion, Green.
- Bösch, C. 2018. “An Efficient privacy-preserving Outsourced Geofencing Service Using Bloom Filter.” Paper read at 2018 IEEE Vehicular Networking Conference (VNC), Taipei, Taiwan.
- Bostock, M. Atlantis 2020 cited 1 August 2022. Available 1 August 2022 from http://observablehq.com/@d3/atlantis.
- Bozkurt, M., R. Groth, B. Hansson, L. Harrie, P. Ringberg, H. Stigmar, and K. Torpel. 2005. Towards Extending Web Map Services for Mobile Applications. Paper read at 8th ICA workshop on generalization and multiple representation, July 7-8th, at A Coruña, Spain.
- Brehmer, M., B. Lee, J. Stasko, and C. Tominski. 2022. “Interacting with visualizations on Mobile Devices.” In Mobile Data Visualization, edited by B. Lee, R. Dachselt, P. Isenberg, and E. K. Choe, 66–110. Boca Raton: CRC Press.
- Brewer, C. A., and B. P. Buttenfield. 2007. “Framing Guidelines for multi-scale Map Design Using Databases at Multiple Resolutions.” Cartography and Geographic Information Science 34 (1): 3–15. doi:10.1559/152304007780279078.
- Brewer, C. A., G. W. Hatchard, and M. A. Harrower. 2003. “ColorBrewer in Print: A Catalog of Color Schemes for Maps.” Cartography and Geographic Information Science 30 (1): 5–32. doi:10.1559/152304003100010929.
- Brudy, F., J. K. Budiman, S. Houben, and N. Marquardt. 2018. “Investigating the role of an overview device in multi-device collaboration.” Paper read at Proceedings of the 2018 CHI Conference on Human Factors in Computing Systems, Montreal, Canada.
- Brügger, A., K.-F. Richter, and S. I. Fabrikant. 2017. “Distributing attention between environment and navigation system to increase spatial knowledge acquisition during assisted wayfinding.” Paper read at International Conference on Spatial Information Theory, L'Aquila, Italy.
- Brügger, A., K.-F. Richter, and S. I. Fabrikant. 2019. “How Does Navigation System Behavior Influence Human Behavior? “Cognitive Research: Principles and Implications” 4 (1):1–22 http://cognitiveresearchjournal.springeropen.com/.
- Brule, E., G. Bailly, A. Brock, F. Valentin, G. Denis, and C. Jouffrais. 2016. “MapSense: Multi-sensory Interactive Maps for Children Living with Visual Impairments.” Paper read at Proceedings of the 2016 CHI conference on human factors in computing systems, San Jose, USA.
- Buckingham, T. 2019. “Map Production and Management.” In Geographic Information Science & Technology Body of Knowledge, edited by J. P. Wilson: UCGIS. doi:10.22224/gistbok/2019.3.1
- Buja, A., D. Cook, and D. F. Swayne. 1996. “Interactive high-dimension Data Visualization.” Journal of Computational and Graphical Statistics 5 (1): 78–99.
- Burigat, S., and L. Chittaro. 2008. “Interactive Visual Analysis of Geographic Data on Mobile Devices Based on Dynamic Queries.” Journal of Visual Languages & Computing 19 (1): 99–122. doi:10.1016/j.jvlc.2007.04.001.
- Burigat, S., L. Chittaro, and R. Sioni. 2017. “Mobile three-dimensional Maps for Wayfinding in Large and Complex Buildings: Empirical Comparison of first-person versus third-person Perspective.” IEEE Transactions on Human-Machine Systems 47 (6): 1029–1039. doi:10.1109/THMS.2017.2693684.
- Burnett, G. E., and K. Lee. 2005. “The Effect of Vehicle Navigation Systems on the Formation of Cognitive Maps.” Paper read at International conference of traffic and transport psychology, Nottingham, England.
- Bursztyn, N., J. Pederson, B. Shelton, A. Walker, and T. Campbell. 2015. “Utilizing geo-referenced Mobile Game Technology for Universally Accessible Virtual Geology Field Trips.” International Journal of Education in Mathematics, Science and Technology 3 (2): 93–100. doi:10.18404/ijemst.88970.
- Buttenfield, B. P. 2002.“Transmitting vector geospatial data across the internet”. Lecture Notes in Computer Science 2478: 51–64. doi:10.1007/3-540-45799-2_4.
- Cairo, A. 2017. Nerd Journalism: How Data and Digital Technology Transformed News Graphics Barcelona, Spain: Universitat Oberta de Catalunya.
- Caquard, S., and W. Cartwright. 2014. “Narrative Cartography: From Mapping Stories to the Narrative of Maps and Mapping.” The Cartographic Journal 51 (2): 101–106. doi:10.1179/0008704114Z.000000000130.
- Cartwright, W., J. Crampton, G. Gartner, S. Miller, K. Mitchell, E. Siekierska, and J. Wood. 2001. “Geospatial Information Visualization User Interface Issues.” Cartography and Geographic Information Science 28 (1): 45–60. doi:10.1559/152304001782173961.
- Chen, J. 2018a. Automated Indoor Mapping with Point Clouds. Santa Barbara: University of California.
- Chen, J. 2018b. “Defining Semantic Levels of Detail for Indoor Maps.” ISPRS Annals of Photogrammetry, Remote Sensing and Spatial Information Sciences 4:27–34. doi:10.5194/isprs-annals-IV-4-W7-27-2018.
- Chen, J., and K. C. Clarke. 2020. “Indoor Cartography.” Cartography and Geographic Information Science 47 (2): 95–109. doi:10.1080/15230406.2019.1619482.
- Cheng, K., L. He, X. Meng, D. A. Shamma, D. Nguyen, and A. Thangapalam. 2015. “Cozymaps: Real-time Collaboration on a Shared Map with Multiple Displays.” Paper read at Proceedings of the 17th International Conference on Human-Computer Interaction with Mobile Devices and Services, Copenhagen, Denmark.
- Chittaro, L. 2006. “Visualizing Information on Mobile Devices.” IEEE Compuer 39 (3): 40–45. doi:10.1109/MC.2006.109.
- Chuang, J. 2009. Energy Aware Color Mapping for Visualization. Vancouver, Canada: School of Computing Science-Simon Fraser University.
- Cinnamon, J., and N. Schuurman. 2013. “Confronting the data-divide in a Time of Spatial Turns and Volunteered Geographic Information.” GeoJournal 78 (4): 657–674. doi:10.1007/s10708-012-9458-6.
- Clarke, K. C. 2004. “Mobile Mapping and Geographic Information Systems.” Cartography and Geographic Information Science 31 (3): 131–136. doi:10.1559/1523040042246043.
- Cole, H. 2021. “Tactile cartography in the digital age: A review and research agenda.” Progress in human geography 45 (4): 834–854. doi:10.1177/0309132521995877.
- Çöltekin, A. 2006. Foveation for 3D Visualization and Stereo Imaging. Helsinki, Finland: Helsinki University of Technology.
- Çöltekin, A. 2019a. “3D User Interfaces, Human Factors, and augmented-and-mixed Reality as Maps: Re-establishing the Link between Cartography and Photogrammetry.” Paper read at Proceedings of the User Experience Design for Mobile Cartography: Setting the Agenda, Beijing, China.
- Çöltekin, A. 2019b. What Is Spatial Computing? 3D User Interfaces, Human Factors and augmented-and-mixed Reality as Maps. Paper read at Proceedings of the User Experience Design for Mobile Cartography: Setting the Agenda, Beijing.
- Coltekin, A.,I. Lokka, M. Zahner, L. Halounova, S I. Fabrikant, and C. Sandi. 2016.“On the Usability and Usefulness of 3D (Geo) visualizations–A Focus on Virtual Reality Environments”. Neurobiology of Learning and Memory132: 1–8. doi:10.1016/j.nlm.2016.04.008.
- Çöltekin, A., A. Griffin, and A. Robinson. 2021. “Visualizations.” In Oxford Bibliographies Online Research Guid. Oxford: Oxford University Press. doi.10.1093/OBO/9780199874002-0224.
- Çöltekin, A, A. L Griffin, A Slingsby, A. C Robinson, S Christophe, V Rautenbach, M Chen, C Pettit, and A Klippel. 2020. “Geospatial Information Visualization and Extended Reality Displays”. In Manual of Digital Earth edited by H. Guo, M. F. Goodchild. and A. Annoni, 229–277. Singapore: Springer.
- Çöltekin, A., B. Heil, S. Garlandini, and S. I. Fabrikant. 2009. “Evaluating the effectiveness of interactive map interface designs: A case study integrating usability metrics with eye-movement analysis.” Cartography and Geographic Information Science 36 (1): 5–17. doi:10.1559/152304009787340197.
- Çöltekin, A., I. Lochhead, M. Madden, S. Christophe, A. Devaux, C. Pettit, O. Lock, S. Shukla, L. Herman, and Z. Stachoň. 2020. “Extended Reality in Spatial Sciences: A Review of Research Challenges and Future Directions.” ISPRS International Journal of Geo-Information 9 (7): 439. doi:10.3390/ijgi9070439.
- Çöltekin, A., I. Lokka, M. Zahner, L. Halounova, S I. Fabrikant, and C. Sandi. 2016. “On the Usability and Usefulness of 3D (Geo) visualizations–A Focus on Virtual Reality Environments.” International Archives of the Photogrammetry, Remote Sensing & Spatial Information Sciences41 (B2) :387–392. doi:10.5194/isprsarchives-XLI-B2-387-2016
- Çöltekin, A., and T. Reichenbacher. 2011. “High Quality Geographic Services and Bandwidth Limitations.” Future Internet 3 (4): 379–396. doi:10.3390/fi3040379.
- Costanza-Chock, S. 2020. Design Justice: Community-led Practices to Build the Worlds We Need. Cambridge, USA: MIT Press.
- Crampton, J. W. 2009. “Cartography: Maps 2.0.” Progress in Human Geography 33 (1): 91–100. doi:10.1177/0309132508094074.
- Dachselt, R., and R. Buchholz. 2009. “Natural Throw and Tilt Interaction between Mobile Phones and Distant Displays.” CHI’09 Extended Abstracts on Human Factors in Computing Systems 3253–3258doi.10.1145/1520340.1520467.
- Dalton, R. C., C. Hölscher, and D. R. Montello. 2019. “Wayfinding as a Social Activity.” Frontiers in Psychology 10:142. doi:10.3389/fpsyg.2019.00142.
- Dalvi-Esfahani, M, Z Alaedini, M Nilashi, S Samad, S Asadi, and M Mohammadi. 2020. “Students’ Green Information Technology Behavior: Beliefs and Personality Traits.” Journal of Cleaner Production 257:120406. doi:10.1016/j.jclepro.2020.120406.
- Dao, D., C. Rizos, and J. Wang. 2002. “Location-based Services: Technical and Business Issues.” Gps Solutions 6 (3): 169–178. doi:10.1007/s10291-002-0031-5.
- Davidson, B. D. 2014. Cartographic Design for Mobile Devices: A Case Study Using the UW-Madison Interactive Campus Map, Geography. Madison: University of Wisconsin-Madison.
- Davies, C. 1998. “Analyzing ‘Work’ in Complex System Tasks: An Exploratory Study with GIS.” Behaviour and Information Technology 17 (4): 218–230. doi:10.1080/014492998119427.
- Dent, B. D. 1987. “Continental Shapes on World Projections: The Design of a poly-centerd Oblique Orthographic World Projection.” The Cartographic Journal 24 (2): 117–124. doi:10.1179/caj.1987.24.2.117.
- Diamond, L. 2019. “Vector Formats and Sources.” In Geographic Information Science & Technology Body of Knowledge, edited by J. P. Wilson: UCGISdoi.10.22224/gistbok/2019.4.8.
- DiBiase, D., A. M. MacEachren, J. B. Krygier, and C. Reeves. 1992. “Animation and the Role of Map Design in Scientific Visualization.” Cartographic and Geographic Information Systems 19 (4): 201–214, 265–266. doi:10.1559/152304092783721295.
- D’Ignazio, C., and L. F. Klein. 2016. “Feminist data visualization.” Paper read at Workshop on Visualization for the Digital Humanities (VIS4DH), Baltimore USA. IEEE.
- D’Ignazio, C., and L. F. Klein. 2020. Data Feminism. Cambridge, USA: MIT press.
- Dillemuth, J. 2005. “Map Design Evaluation for Mobile Display.” Cartography and Geographic Information Science 32 (4): 285–301. doi:10.1559/152304005775194773.
- Dillemuth, J. A. 2009. “Navigation tasks with small-display maps: The sum of the parts does not equal the whole.” Cartographica: The international journal for geographic information and geovisualization 44 (3): 187–200. doi:10.3138/carto.44.3.187.
- Dodge, M., and R. Kitchin. 2013. “Crowdsourced Cartography: Mapping Experience and Knowledge.” Environment and Planning A 45 (1): 19–36. doi:10.1068/a44484.
- Dong, W., H. Liao, R. E. Roth, and S. Wang. 2014. “Eye Tracking to Explore the Potential of Enhanced Imagery Basemaps in Web Mapping.” The Cartographic Journal 51 (4): 313–329. doi:10.1179/1743277413Y.0000000071.
- Dourish, P. 2004. Where the action is: the foundations of embodied interaction. Cambridge, USA:MIT press.
- Drewes, H., A. De Luca, and A. Schmidt. 2007. “Eye-gaze Interaction for Mobile Phones.” Paper read at Proceedings of the 4th international conference on mobile technology, applications, and systems and the 1st international symposium on Computer human interaction in mobile technology, Singapore.
- Duchowski, A. T. 2018. “Gaze-based Interaction: A 30 Year Retrospective.” Computers & Graphics 73(June): 59–69. doi:10.1016/j.cag.2018.04.002.
- Duchowski, A. T., and A. Çöltekin. 2007. “Foveated gaze-contingent displays for peripheral LOD management, 3D visualization, and stereo imaging.” ACM Transactions on Multimedia Computing, Communications, and Applications (TOMM) 3 (4): 1–18. doi:10.1145/1314303.1314309.
- Dykes, J. A. 1997. “Exploring spatial data representation with dynamic graphics.” Computers & Geosciences 23 (4): 345–370. doi:10.1016/S0098-3004(97)00009-5.
- Dymon, U. J. 2003. “An Analysis of Emergency Map Symbology.” International Journal of Emergency Management 1 (3): 227–237. doi:10.1504/IJEM.2003.003301.
- Edsall, R. M. 2003. “Design and Usability of an Enhanced Geographic Information System for Exploration of Multivariate Health Statistics.” The Professional Geographer 55 (2): 146–160. doi:10.1111/0033-0124.5502003.
- Edwardes, A., D. Burghardt, and R. Weibel. 2005. “Portrayal and Generalization of Point Maps for Mobile Information Services.” In Map-based Mobile Services, edited by L. Meng, A. Zipf, and T. Reichenbacher, 11-30. Springer.
- Elias, B., M. Hampe, and M. Sester. 2005. “Adaptive Visualization of Landmarks Using an MRDB.” In Map-based Mobile Services, edited by L. Meng, A. Zipf, and T. Reichenbacher, 73–86. Berlin: Springer.
- Elwood, S., and A. Leszczynski. 2013. “New spatial media, new knowledge politics.” Transactions of the Institute of British Geographers 38 (4): 544–559. doi:10.1111/j.1475-5661.2012.00543.x.
- Finn, M. P., E. Lynn Usery, L. N. Woodard, and K. H. Yamamoto. 2017. “The Logic of Selecting an Appropriate Map Projection in a Decision Support System (DSS).” In Choosing a Map Projection, edited by M. Lapaine and E.L. Usery, 229–245. Springerdoi.10.1007/978-3-319-51835-0_10 .
- Flittner, J., and J. L. Gabbard. 2021. “Adapting Image Analysis Measures of Visual Clutter to Multiple Plane Augmented Reality User Interfaces.” Paper read at 2021 IEEE International Symposium on Mixed and Augmented Reality Adjunct (ISMAR-Adjunct), Bari, Italy.
- Fuchs, G., M. Kreuseler, and H. Schumann. 2004. “Extended Focus & Context for Visualizing Abstract Data on Maps.” Paper read at CODATA prague workshop on information visualization, presentation, and design, Prague, Czechia.
- Furnas, G. W. 1986. “Generalized Fisheye Views.” Acm Sigchi Bulletin 17 (4): 16–23. doi:10.1145/22339.22342.
- Gärling, T., E. Lindberg, and T. Mäntylä. 1983. “Orientation in Buildings: Effects of Familiarity, Visual Access, and Orientation Aids.” Journal of Applied Psychology 68 (1): 177. doi:10.1037/0021-9010.68.1.177.
- Garrett, J. J. 2010. The Elements of User Experience: User-centered Design for the Web and Beyond. Thousand Oaks: New Riders Publishing.
- Gartner, G. 2012. “Putting emotions in maps–The wayfinding example.” Mountain Cartography Workshop, Taurewa, New Zealand : New Zealand Cartographic Society, 61–65 http://carto.geogr.msu.ru/cmc/publications/papers/papers_taurewa_12/papers/mcw2012_sec3_ch08_p061-065_gartner.pdf.
- Gartner, G., D. A. Bennett, and T. Morita. 2007. “Towards ubiquitous cartography.” Cartography and Geographic Information Science 34 (4): 247–257. doi:10.1559/152304007782382963.
- Gershon, N., and W. Page. 2001. “What Storytelling Can Do for Information Visualization.” Communications of the ACM 44 (8): 31–37. doi:10.1145/381641.381653.
- Giannopoulos, I., P. Kiefer, and M. Raubal. 2012. “GeoGazemarks: Providing Gaze History for the Orientation on Small Display Maps.” Paper read at Proceedings of the 14th ACM international conference on Multimodal interaction, Santa Monica, USA.
- Giudice, N. A., L. A. Walton, and M. Worboys. 2010. “The Informatics of Indoor and Outdoor Space: A Research Agenda.” Paper read at Proceedings of the 2nd ACM SIGSPATIAL International Workshop on Indoor Spatial Awareness, San Jose, USA.
- Golledge, R. G., M. T. Rice, and R. D. Jacobson. 2006. “Multimodal Interfaces for Representing and Accessing Geospatial Information.” In Frontiers of Geographic Information Technology, edited by S. Rana and J. Sharma, 181–208. Springer.
- Goodchild, M. F. 2007. “Citizens as Sensors: The World of Volunteered Geography.” GeoJournal 69 (4): 211–221. doi:10.1007/s10708-007-9111-y.
- Goodchild, M. F. 2011. “Scale in GIS: An Overview.” Geomorphology 130 (1–2): 5–9. doi:10.1016/j.geomorph.2010.10.004.
- Goodchild, M. F., D. M. Johnston, D. J. Maguire, and V. T. Noronha. 2004. “Distributed and mobile computing.” In A research agenda for geographic information science, edited by R. B. McMaster and E. L. Usery,. 257–286. CRC Press.
- Gorte, V., and A. “ Degbelo2022.“ Choriented Maps: Visualizing SDG Data on Mobile Devices.” The Cartographic Journal 59 (1): 35–54.
- Gouveia, R., F. Pereira, A. Caraban, S. A. Munson, and E. Karapanos. 2015. “You Have 5 Seconds: Designing Glanceable Feedback for Physical Activity Trackers.” Paper read at Adjunct Proceedings of the 2015 ACM International Joint Conference on Pervasive and Ubiquitous Computing and Proceedings of the 2015 ACM International Symposium on Wearable Computers, Osaka, Japan.
- Gray, J., L. Chambers, and L. Bounegru. 2012. The Data Journalism Handbook: How Journalists Can Use Data to Improve the News. Sebastopol, USA: O’Reilly Media.
- Grejner-Brzezinska, D. A., C. K. Toth, T. Moore, J. F. Raquet, M. M. Miller, and A. Kealy. 2016. “ Multisensor navigation systems: A remedy for GNSS vulnerabilities? ” Proceedings of the IEEE 104 (6):1339–1353.
- Griffin, A. L. 2001. “Feeling It Out: The Use of Haptic Visualization for Exploratory Geographic Analysis.” Cartographic Perspectives 39 (39): 12–29. doi:10.14714/CP39.636.
- Griffin, A. L., T. Reichenbacher, H. Liao, W. Wang, and Y. Cao. 2024. “Cognitive Issues of Mobile Map Design and Use.” Journal of Location Based Services.
- Griffin, A. L., T. White, C. Fish, B. Tomio, H. Huang, C. R. Sluter, J. V. M. Bravo, S. I. Fabrikant, S. Bleisch, and M. Yamada. 2017. “Designing across Map Use Contexts: A Research Agenda.” International Journal of Cartography 3 (sup1): 90–114. doi:10.1080/23729333.2017.1315988.
- Griggs, D., M. Stafford-Smith, O. Gaffney, J. Rockström, M. C. Öhman, P. Shyamsundar, W. Steffen, G. Glaser, N. Kanie, and I. Noble. 2013. “Sustainable Development Goals for People and Planet.” Nature 495 (7441): 305–307. doi:10.1038/495305a.
- Guidero, E. 2017. “Typography.” In Geographic Information Science & Technology Body of Knowledge, edited by J. P. Wilson: UCGIS doi.10.22224/gistbok/2017.3.2.
- Guidero, E. M. 2016. Where cartography meets typography: Choosing typefaces and semantic effects for maps using microaesthetics. Pennsylvania State University.
- Hägerstrand, T. 1970. “What about People in Regional Science.” Regional Science Association 24 (1): 6–21. doi:10.1007/BF01936872.
- Haklay, M. 2010. Interacting with Geospatial Technologies. West Sussex, UK: Wiley-Blackwell.
- Haklay, M. 2013. “Citizen Science and Volunteered Geographic Information: Overview and Typology of Participation.” In Crowdsourcing Geographic Knowledge, edited by D. Sui, S. Elwood, and M. F. Goodchild, 105–122. Heidelberg: Springer.
- Haklay, M., and A.-M. Nivala. 2010. “User-centered Design.” In Interacting with Geospatial Technologies, edited by M. Haklay, 91–106. West Sussex, UK: Wiley-Blackwell.
- Halik, Ł. 2012. “The Analysis of Visual Variables for Use in the Cartographic Design of Point Symbols for Mobile Augmented Reality Applications.” Geodesy and Cartography 61 (1): 19–30. doi:10.2478/v10277-012-0019-4.
- Halik, Ł, and B. Medyńska-Gulij. 2017. “The Differentiation of Point Symbols Using Selected Visual Variables in the Mobile Augmented Reality System.” The Cartographic Journal 54 (2): 147–156. doi:10.1080/00087041.2016.1253144.
- Han, Y., M. Wu, and R. Roth. 2021. “Toward Green Cartography & Visualization: A semantically-enriched Method of Generating energy-aware Color Schemes for Digital Maps.” Cartography and Geographic Information Science 48 (1): 43–62. doi:10.1080/15230406.2020.1827040.
- Haraway, D. 1991. Simians, Cyborgs, and Women: The Reinvention of Nature. New York, USA:Routledge.
- Harley, J. B. 1989. “Deconstructing the Map.” Cartographica: The International Journal for Geographic Information and Geovisualization 26 (2): 1–20. doi:10.3138/E635-7827-1757-9T53.
- Harrie, L., L. T. Sarjakoski, and L. Lehto. 2002. “A Mapping Function for variable-scale Maps in small-display Cartography.” Journal of Geospatial Engineering 4 (2): 111–124.
- Harrower, M., and B. Seesley. 2005. “Designing Better Map Interfaces: A Framework for Panning and Zooming.” Transactions in GIS 9 (2): 77–89. doi:10.1111/j.1467-9671.2005.00207.x.
- Harrower, M., and B. Seesley. 2007. “Utterly Lost: Methods for Reducing Disorientation in 3-d fly-over Maps.” Cartography and Geographic Information Science 34 (1): 17–27. doi:10.1559/152304007780279096.
- Harvey, F. 2013. “To Volunteer or to Contribute Locational Information? Towards Truth in Labeling for Crowdsourced Geographic Information.” In Crowdsourcing Geographic Knowledge, edited by D. Sui, S. Elwood, and M. Goodchild, 31-42. Springer.
- Hauser, H. 2006. “Generalizing Focus+ Context Visualization.” In Scientific Visualization: The Visual Extraction of Knowledge from Data, edited by G.-P. Bonneau, T. Ertl, and G. M. Nelson, 305-327: Springer.
- Hoarau, C. 2011. “Reaching a Compromise between Contextual Constraints and Cartographic Rules: Application to Sustainable Maps.” Cartography and Geographic Information Science 38 (2): 79–88. doi:10.1559/1523040638279.
- Holcombe, A. O. 2009. “Seeing Slow and Seeing Fast: Two Limits on Perception.” Trends in Cognitive Sciences 13 (5): 216–221. doi:10.1016/j.tics.2009.02.005.
- Horak, T., W. Aigner, M. Brehmer, A. Joshi, and C. Tominski. 2022. “Responsive Visualization Design for Mobile Devices.” In Mobile Data Visualization, edited by B. Lee, R. Dachselt, P. Isenberg, and E. K. Choe, 33–65. Boca Raton: CRC Press.
- Horak, T., S. K. Badam, N. Elmqvist, and R. Dachselt. 2018. “When David Meets Goliath: Combining Smartwatches with a Large Vertical Display for Visual Data Exploration.” Paper read at Proceedings of the 2018 CHI Conference on Human Factors in Computing Systems, Montreal, Canada.
- Hossain, A. M., and W.-S. Soh. 2015. “A Survey of calibration-free Indoor Positioning Systems.” Computer Communications 66:1–13. doi:10.1016/j.comcom.2015.03.001.
- Huang, Q. 2018. “Social media analytics.” In Geographic Information Science & Technology Body of Knowledge, edited by J. P. Wilson: UCGIS. doi.10.22224/gistbok/2018.1.10.
- Huang, H., Y. Cheng, W. Dong, G. Gartner, J. Krisp, and L. Meng. 2024. “Data Modeling and Processing in Location Based Services: Research Challenges and Opportunities.” Journal of Location Based Services.
- Huang, H., and G. Gartner. 2009. “A Survey of Mobile Indoor Navigation Systems.” In Cartography in Central and Eastern Europe, edited by G. Gartner, and F. Ortag. 305-319: Springer.
- Huang, H., G. Gartner, J. M. Krisp, M. Raubal, and N Van de Weghe. 2018. “Location Based Services: Ongoing Evolution and Research Agenda.” Journal of Location Based Services 12 (2): 63–93. doi:10.1080/17489725.2018.1508763.
- Huang, H., M. Schmidt, and G. Gartner. 2012. “Spatial Knowledge Acquisition with Mobile Maps, Augmented Reality and Voice in the Context of GPS-based Pedestrian Navigation: Results from a Field Test.” Cartography and Geographic Information Science 39 (2): 107–116. doi:10.1559/15230406392107.
- Huffman, D. 2019. Tweet Message. http://twitter.com/pinakographos/status/1183845222297559042
- Imhof, E. 1975. “Positioning Names on Maps.” The American Cartographer 2 (2): 128–144. doi:10.1559/152304075784313304.
- Ishii, H., and B. Ullmer. 1997. “Tangible Bits: Towards Seamless Interfaces between People, Bits and Atoms. ”Paper read at Proceedings of the ACM SIGCHI Conference on Human factors in computing systems, Atlanta, USA.
- Ishikawa, T. 2019. “Satellite Navigation and Geospatial Awareness: Long-term Effects of Using Navigation Tools on Wayfinding and Spatial Orientation.” The Professional Geographer 71 (2): 197–209. doi:10.1080/00330124.2018.1479970.
- Ishikawa, T., H. Fujiwara, O. Imai, and A. Okabe. 2008. “Wayfinding with A GPS-based Mobile Navigation System: A Comparison with Maps and Direct Experience.” Journal of Environmental Psychology 28 (1): 74–82. doi:10.1016/j.jenvp.2007.09.002.
- Islam, A., A. Bezerianos, B. Lee, T. Blascheck, and P. Isenberg. 2020. Visualizing Information on Watch Faces: A Survey with Smartwatch Users. Paper read at 2020 IEEE Visualization Conference (VIS).
- Jansen, T. Aspect ratio vs. space efficiency of map projections 2019 cited 1 August 2022. Available from 1 August 2022http://observablehq.com/@toja/aspect-ratio-vs-space-efficency-of-map-projecions.
- Jenny, B. 2012. “Adaptive Composite Map Projections.” IEEE Transactions on Visualization and Computer Graphics 18 (12): 2575–2582. doi:10.1109/TVCG.2012.192.
- Jenny, B., J. Buddeberg, C. Hoarau, and J. Liem. 2015. “Plan Oblique Relief for Web Maps.” Cartography and Geographic Information Science 42 (5): 410–418. doi:10.1080/15230406.2015.1015169.
- Jenny, B., and T. Patterson. 2007. “Introducing Plan Oblique Relief.” Cartographic Perspectives 57 (57): 21–40. doi:10.14714/CP57.279.
- Jenny, B., B. Šavrič, N. D. Arnold, B. E. Marston, and C. A. Preppernau. 2017. “A Guide to Selecting Map Projections for World and Hemisphere Maps.” In Choosing a Map Projection, edited by M. Lapaine, and E. L. Usery, 213-228: Springer.
- Jensen, C. S., H. Lu, and B. Yang. 2009. “Indexing the Trajectories of Moving Objects in Symbolic Indoor Space.” Paper read at International symposium on spatial and temporal databases, Aalborg, Denmark.
- Joshi, R., A. Hiwale, S. Birajdar, and R. Gound. 2020. “Indoor Navigation with Augmented Reality.” In Iccce 2019. edited by A. Kumar and S. Mozar,159-165. Springer.
- Keil, J., D. Edler, L. Kuchinke, and F. Dickmann. 2020. “Effects of Visual Map Complexity on the Attentional Processing of Landmarks.” Plos one 15 (3): e0229575. doi:10.1371/journal.pone.0229575.
- Keil, J., F. Schmitt, T. Engelke, H. Graf, and M. Olbrich. 2018. Augmented Reality Views: Discussing the Utility of Visual Elements by Mediation Means in Industrial AR from a Design Perspective. Paper read at International Conference on Virtual, Augmented and Mixed Reality.
- Kelly, M. 2020. Feminist Mapping: Content, Form, and Process, Geography. Madison: University of Wisconsin-Madison.
- Kelly, M. 2021. “Mapping Bodies, Designing Feminist Icons.” GeoHumanities 7 (2): 529–557. doi:10.1080/2373566X.2021.1883455.
- Kern, J. P., and C. A. Brewer. 2008. “Automation and the Map Label Placement Problem: A Comparison of Two GIS Implementations of Label Placement.” Cartographic Perspectives 60 (60): 22–45. doi:10.14714/CP60.230.
- Kerski, J. 2016. “Location privacy.” In Geographic Information Science & Technology Body of Knowledge, edited by J. P. Wilson: UCGIS doi.10.22224/gistbok/2016.3.2.
- Kessell, A. M., and B. Tversky. 2006. “Using Diagrams and Gestures to Think and Talk about Insight Problems.” Paper read at Proceedings of the Annual Meeting of the Cognitive Science Society, Vancouver, Canada.
- Kessler, F., and S. Battersby. 2019. Working with map projections: A guide to their selection. Boca Raton, USA: CRC Press.
- Khamis, M., F. Alt, and A. Bulling. 2018. “The past, present, and future of gaze-enabled handheld mobile devices: Survey and lessons learned.” Paper read at Proceedings of the 20th International Conference on Human-Computer Interaction with Mobile Devices and Services, Barcelona, Spain.
- Kiefer, P., I. Giannopoulos, and M. Raubal. 2014. “Where Am I? Investigating Map Matching during Self‐localization with Mobile Eye Tracking in an Urban Environment.” Transactions in GIS 18 (5): 660–686. doi:10.1111/tgis.12067.
- Kitchin, R., and M. Dodge. 2007. “Rethinking Maps.” Progress in Human Geography 31 (3): 331–344. doi:10.1177/0309132507077082.
- Kitchin, R., T. P. Lauriault, and G. McArdle. 2015. “Knowing and Governing Cities through Urban Indicators, City Benchmarking and real-time Dashboards.” Regional Studies, Regional Science 2 (1): 6–28. doi:10.1080/21681376.2014.983149.
- Klettner, S. 2019. “Why Shape matters—On the Inherent Qualities of Geometric Shapes for Cartographic Representations.” ISPRS International Journal of Geo-Information 8 (5): 217. doi:10.3390/ijgi8050217.
- Klettner, S. 2020. “Affective communication of map symbols: a semantic differential analysis.” ISPRS International Journal of Geo-Information 9 (5): 289. doi:10.3390/ijgi9050289.
- Klippel, A., K.-F. Richter, T. Barkowsky, and C. Freksa. 2005. “The Cognitive Reality of Schematic Maps.” In Map-based Mobile Servicesedited by L. Meng, A. Zipf, and T. Reichenbacher,. 55-71: Springer.
- Klippel, A., H. Tappe, L. Kulik, and P. U. Lee. 2005. “Wayfinding choremes—a Language for Modeling Conceptual Route Knowledge.” Journal of Visual Languages & Computing 16 (4): 311–329. doi:10.1016/j.jvlc.2004.11.004.
- Konečný, M., P. Kubíček, Z. Stachoň, and Č. Šašinka. 2011. “The Usability of Selected Base Maps for Crises management—users’ Perspectives.” Applied Geomatics 3 (4): 189–198. doi:10.1007/s12518-011-0053-1.
- Kostelnick, J. C., J. E. Dobson, S. L. Egbert, and M. D. Dunbar. 2008. “Cartographic Symbols for Humanitarian Demining.” The Cartographic Journal 45 (1): 18–31. doi:10.1179/000870408X276585.
- Koulieris, G.-A., K. Aksit, C. Richardt, R. Mantiuk, and K. Mania. 2018. “Cutting-edge VR/AR Display Technologies (Gaze-, Accommodation-, motion-aware and HDR-enabled).” Paper read at IEEE VR 2018-25th IEEE Conference on Virtual Reality and 3D User Interfaces, Tuebingen/Reutlingen, Germany.
- Koulieris, G. A., K. Akşit, M. Stengel, R. K. Mantiuk, K. Mania, and C. Richardt. 2019. Near‐eye Display and Tracking Technologies for Virtual and Augmented Reality. Paper read at Computer Graphics Forum.
- Koyuncu, H., and S. H. Yang. 2010. “A survey of indoor positioning and object locating systems.” IJCSNS International Journal of Computer Science and Network Security 10 (5): 121–128.
- Kraak, M.-J., R. E. Roth, B. Ricker, A. Kagawa, and G. Le Sourd. 2020. Mapping for a Sustainable World. New York: United Nations.
- Krygier, J. B. 1994. “In Visualization in Modern Cartography, Volume Two, edited by A. M. MacEachren and D. R. F. Taylor.” 149-166: Elsevier.
- Kubíček, P., Č Šašinka, Z Stachoň, Z Štěrba, J Apeltauer, and T. Urbánek. 2017. “Cartographic Design and Usability of Visual Variables for Linear Features.” The Cartographic Journal 54 (1): 91–102. doi:10.1080/00087041.2016.1168141.
- Kwok, T. C., P. Kiefer, V. R. Schinazi, B. Adams, and M. Raubal. 2019. “Gaze-guided Narratives: Adapting Audio Guide Content to Gaze in Virtual and Real Environments.” Paper read at Proceedings of the 2019 CHI Conference on Human Factors in Computing Systems, Glasgow, Scotland.
- Lagner, R., L. Besançon, C. Collins, T. Dywer, P. Isenberg, T. Isenberg, B. Lee, C. Perin, and C. Tominski. 2022. “An Introduction to Mobile Data Visualization.” In Mobile Data Visualization, edited by B. Lee, R. Dachselt, P. Isenberg, and E. K. Choe, 1–31. Boca Raton: CRC Press.
- Lammes, S., and C. Wilmott. 2018. “The Map as Playground: Location-based Games as Cartographical Practices.” Convergence 24 (6): 648–665. doi:10.1177/1354856516679596.
- Langner, R., T. Horak, and R. Dachselt. 2017. “Vis Tiles: Coordinating and Combining Co-located Mobile Devices for Visual Data Exploration.” IEEE Transactions on Visualization and Computer Graphics 24 (1): 626–636. doi:10.1109/TVCG.2017.2744019.
- Lee, B., M. Brehmer, P. Isenberg, E. K. Choe, R. Langner, and R. Dachselt. 2018. “Data Visualization on Mobile Devices.” Paper read at Extended Abstracts of the 2018 CHI Conference on Human Factors in Computing Systems, Montreal, Canada.
- Lee, B., R. Dachselt, P. Isenberg, and E. K. Choe. 2022. Mobile Data Visualization. Boca Raton: CRC Press.
- Lella, A., and A. Lipsman. The U.S. mobile app report 2014 cited 1 August 2022. Available 1 August 2022 from http//www.comscore.com/Insights/Presentations-and-Whitepapers/2014/The-US-Mobile-App-Report.
- Lewicka, M. 2011. “Place Attachment: How Far Have We Come in the Last 40 Years?” Journal of Environmental Psychology 31 (3): 207–230. doi:10.1016/j.jenvp.2010.10.001.
- Li, K.-J. 2008. Indoor Space: A New Notion of Space. Paper Read at International Symposium on Web and Wireless Geographical Information Systems.
- Liao, H., X. Wang, W. Dong, and L. Meng. 2019. “Measuring the Influence of Map Label Density on Perceived Complexity: A User Study Using Eye Tracking.” Cartography and Geographic Information Science 46 (3): 210–227. doi:10.1080/15230406.2018.1434016.
- Li, R., and A. Klippel. 2016. “Wayfinding Behaviors in Complex Buildings: The Impact of Environmental Legibility and Familiarity.” Environment and Behavior 48 (3): 482–510. doi:10.1177/0013916514550243.
- Li, R., A. Korda, M. Radtke, and A. Schwering. 2014. “Visualising distant off-screen landmarks on mobile devices to support spatial orientation.” Journal of Location Based Services 8 (3): 166–178. doi:10.1080/17489725.2014.978825.
- Liu, H., H. Darabi, P. Banerjee, and J. Liu. 2007. “Survey of Wireless Indoor Positioning Techniques and Systems.” IEEE Transactions on Systems, Man, and Cybernetics, Part C (Applications and Reviews) 37 (6): 1067–1080. doi:10.1109/TSMCC.2007.905750.
- Lobben, A., and M. Lawrence. 2012. “The Use of Environmental Features on Tactile Maps by Navigators Who are Blind.” The Professional Geographer 64 (1): 95–108. doi:10.1080/00330124.2011.595619.
- Loeffler, S., R. E. Roth, S. Goring, and A. Myrbo. 2021. “Mobile UX Design: Learning from the Flyover Country Mobile App.” Journal of Maps 17 (2): 39–50. doi:10.1080/17445647.2020.1867247.
- Lokka, I. E., and A. Çöltekin. 2019. “Toward Optimizing the Design of Virtual Environments for Route Learning: Empirically Assessing the Effects of Changing Levels of Realism on Memory.” International Journal of Digital Earth 12 (2): 137–155. doi:10.1080/17538947.2017.1349842.
- Lokka, I. E., A. Çöltekin, J. Wiener, S. I. Fabrikant, and C. Röcke. 2018. “Virtual Environments as Memory Training Devices in Navigational Tasks for Older Adults.” Scientific Reports 8 (1): 1–15. doi:10.1038/s41598-018-29029-x.
- Luebke, D., M. Reddy, J. D. Cohen, A. Varshney, B. Watson, and R. Huebner. 2003. Level of Detail for 3D Graphics. San Francisco, USA: Morgan Kaufmann.
- MacEachren, A. M. 1986. “A Linear View of the World: Strip Maps as A Unique Form of Cartographic Representation.” The American Cartographer 13 (1): 7–26. doi:10.1559/152304086783900185.
- MacEachren, A. M. 1992. “Application of Environmental Learning Theory to Spatial Knowledge Acquisition from Maps.” Annals of the Association of American Geographers 82 (2): 245–274. doi:10.1111/j.1467-8306.1992.tb01907.x.
- MacEachren, A. M. 1995. How Maps Work. New York, NY, USA: Guilford Press.
- MacEachren, A. M. 2013. “Cartography as an Academic Field: A Lost Opportunity or A New Beginning.” The Cartographic Journal 50 (2): 166–170. doi:10.1179/0008704113Z.00000000083.
- MacEachren, A. M., F. P. Boscoe, D. Haug, and L. W. Pickle. 1998. “ Geographic Visualization: Designing Manipulable Maps for Exploring Temporally Varying Georeferenced Statistics.” Proceedings IEEE symposium on information visualization, Raleigh-Durham, USA (Cat. No. 98TB100258):87–94.
- MacEachren, A. M, G Cai, R Sharma, I Rauschert, I Brewer, L Bolelli, B Shaparenko, S Fuhrmann, and H. Wang. 2005. “Enabling collaborative geoinformation access and decision‐making through a natural, multimodal interface.” International Journal of Geographical Information Science 19 (3): 293–317. doi:10.1080/13658810412331280158.
- MacEachren, A. M., and M.-J. Kraak. 1997. “Exploratory Cartographic Visualization: Advancing the Agenda.” Computers & Geosciences 23 (4): 335–343. doi:10.1016/S0098-3004(97)00018-6.
- MacEachren, A. M., and M. Monmonier. 1992. “Geographic visualization - Introduction.” Cartography and Geographic Information Science 19 (4): 197–200. doi:10.1559/152304092783721303.
- MacEachren, A. M., M. Wachowicz, R. Edsall, D. Haug, and R. Masters. 1999. “Constructing Knowledge from Multivariate Spatiotemporal Data: Integrating Geographical Visualization with Knowledge Discovery in Database Methods.” International Journal of Geographical Information Science 13 (4): 311–334. doi:10.1080/136588199241229.
- Maher, M. L., and L. Lee. 2017. “Designing for Gesture and Tangible Interaction.” Synthesis Lectures on Human-Centered Interaction 10 (2): i–111.
- Marcotte, E. 2010. Responsive web design. A List Apart, cited 23 March 2014. Available from 23 March 2014 http://alistapart.com/article/responsive-web-design/.
- Mascarenas, D. D., J. P. Ballor, O. L. McClain, M. A. Mellor, C.-Y. Shen, B. Bleck, J. Morales, L.-M. R. Yeong, B. Narushof, and P. Shelton. 2021. “Augmented reality for next generation infrastructure inspections.” Structural Health Monitoring 20 (4): 1957–1979. doi:10.1177/1475921720953846.
- Mathews, A. J., and A. Frazier. 2017. “Unmanned Aerial Systems.” In Geographic Information Science & Technology Body of Knowledge, edited by J. P. Wilson. Raleigh-Durham, USA: UCGIS. doi.10.22224/gistbok/2017.2.4.
- Matthews, T. 2006. “ Designing and Evaluating Glanceable Peripheral Displays.” Paper read at Proceedings of the 6th conference on Designing Interactive systems, University Park, PA.
- Mautz, R. 2012. “Indoor positioning technologies”(Rehabilitation Thesis), ETH Zurich, Zurich, Switzerland.”doi:10.3929/ethz-a-007313554.
- McConchie, A. 2015. “Hacker Cartography: Crowdsourced Geography, OpenStreetMap, and the Hacker Political Imaginary.” ACME: An International Journal for Critical Geographies 14 (3): 874–898.
- Mead, C., S. Buxner, G. Bruce, W. Taylor, S. Semken, and A. D. Anbar. 2019. “Immersive, Interactive Virtual Field Trips Promote Science Learning.” Journal of Geoscience Education 67 (2): 131–142. doi:10.1080/10899995.2019.1565285.
- Meilinger, T., C. Hölscher, S. J. Büchner, and M. Brösamle. 2007. “How Much Information Do You Need? Schematic Maps in Wayfinding and Self Localisation”. In Vol 4387 Spatial Cognition,V: Reasoning, Action, Interaction, edited by T. Barkowsky, M. Knauff, G. Ligozat, and D. R. Montello, 381–400. Berlin-Heidelberg: Spring-Verlag.
- Meng, L. 2005. “Egocentric design of map-based mobile services.” The Cartographic Journal 42 (1): 5–13. doi:10.1179/000870405X57275.
- Meng, L. 2020. “An IEEE value loop of human-technology collaboration in geospatial information science.” Geo-spatial Information Science 23 (1): 61–67. doi:10.1080/10095020.2020.1718004.
- Meng, L., T Bandrova, T Midtbø, and V. Voženílek. 2021. “Toward a New ICA Research Agenda.” Abstracts of the ICA 3:205. doi:10.5194/ica-abs-3-205-2021.
- Meng, L., and T. Reichenbacher. 2005. “Map-based Mobile Services.” In Map-based Mobile Services, edited by L. Meng, A. Zipf, and T. Reichenbacher, 1–10: Springer.
- Meng, L., A. Zipf, and T. Reichenbacher. 2005. Map-based Mobile Services: Theories, Methods, and Implementations. Berlin-Heidelberg: Springer.
- Miller, H. J. 1991. “Modelling Accessibility Using space-time Prism Concepts within Geographical Information Systems.” International Journal of Geographical Information System 5 (3): 287–301. doi:10.1080/02693799108927856.
- Miller, T., and J. Stasko. 2002. “ Artistically Conveying Peripheral Information with the InfoCanvas.” Paper read at Proceedings of the Working Conference on Advanced Visual Interfaces, Trento, Italy.
- Montello, D. R. 1993. “Scale and Multiple Psychologies of Space.” Paper read at European conference on spatial information theory, Elba, Italy.
- Muehlenhaus, I. 2011. “From Print to Mobile mApps: How to Take Adobe Illustrator Maps, Add pinch-to-zoom, and Place Them on the Android Market.” Cartographic Perspectives 69 (69): 59–70. doi:10.14714/CP69.23.
- Muehlenhaus, I. 2013. Web Cartography: Map Design for Interactive and Mobile Devices. Boca Raton, FL: CRC Press.
- Mullins, C. 2015. “Responsive, Mobile App, Mobile First: Untangling the UX Design Web in Practical Experience. ”Paper read at Proceedings of the 33rd Annual International Conference on the Design of Communication, Limerick, Ireland.
- Münzer, S., H. D. Zimmer, M. Schwalm, J. Baus, and I. Aslan. 2006. “Computer-assisted Navigation and the Acquisition of Route and Survey Knowledge.” Journal of Environmental Psychology 26 (4): 300–308. doi:10.1016/j.jenvp.2006.08.001
- Murali, M., and A. Çöltekin. 2021. Conducting eye tracking studies online. Paper read at Proceedings of the Workshop on Adaptable Research Methods for Empirical Research with Map Users, Virtual Workshop.
- Murari, A., E. Mahfoud, W. Wang, and A. Lu. 2021. “Cross-Platform immersive visualization and navigation with augmented reality .” Paper read at The 14th International Symposium on Visual Information Communication and Interaction, Postdam, Germany.
- Murphy, C. E. 2014. Concise Image maps-a Design Approach. Munich, Germany: Technische Universität München.
- Murphy, C. E. 2019. “Designing the Imagery on Image maps–how Far Can We Take It?” International Journal of Cartography 5 (2–3): 316–331. doi:10.1080/23729333.2019.1613074.
- Nagi, R. 2014. Cartographic Visualizaton for Mobile Appliations, International Institute for Geo-information Science and Earth Observation. Enschede, The Netherlands: University of Twente.
- Narzt, W., G. Pomberger, A. Ferscha, D. Kolb, R. Müller, J. Wieghardt, H. Hörtner, and C. Lindinger. 2006. “Augmented Reality Navigation Systems.” Universal Access in the Information Society 4 (3): 177–187. doi:10.1007/s10209-005-0017-5.
- Nash, J. C. 2008. “Re-thinking intersectionality.” Feminist review 89 (1): 1–15. doi:10.1057/fr.2008.4.
- Nelson, J. K., and A. M. MacEachren. 2020. “User-centered Design and Evaluation of a Geovisualization Application Leveraging Aggregated Quantified-Self Data.” Cartographic Perspectives (96):7–31.
- Nestel, C., ed. 2019a. Design and Aesthetics. Raleigh-Durham, USA: UCGIS. doi.10.22224/gistbok/2019.4.14.
- Nestel, C. M. 2019b. “Designing an Experience: Maps and Signs at the Archaeological Site of Ancient Troy.” Cartographic Perspectives 94:25–47.
- Newbury, R., K. A Satriadi, J Bolton, J Liu, M Cordeil, A Prouzeau, and B. Jenny. 2021. “Embodied Gesture Interaction for Immersive Maps.” Cartography and Geographic Information Science 48 (5): 417–431. doi:10.1080/15230406.2021.1929492.
- Niroumand-Jadidi, M., H. Helali, and A. Alesheikh. 2011. “Optimal Visualization of Satellite Imagery and Superimposed Vector Data: A New Rend to the Conceptual Visualization of land-use Maps .” Paper read at Proceedings of the International Cartographic Conference, Paris, France.
- Nold, C. 2009. Emotional Cartography: Technologies of the Self. Softhook http://www.emotionalcartography.net/EmotionalCartography.pdf
- Norman, D. A. 1988. The Design of Everyday Things. New York, NY: Basic Books.
- Nyerges, T. L., M. Karwan, R. Laurini, and M. J. Egenhofer. 1995. Cognitive Aspects of human-computer Interaction for Geographic Information Systems. Boston: Kluwer Academic Publishers.
- Okeleke, K., and S. Suardi. 2022. The Mobile Economy 2022. London: Global System for Mobile Communications.
- Ooms, K., P. De Maeyer, and V. Fack. 2014. “Study of the Attentive Behavior of Novice and Expert Map Users Using Eye Tracking.” Cartography and Geographic Information Science 41 (1): 37–54. doi:10.1080/15230406.2013.860255.
- Ormeling, F. 2000. “Toponymic education and training.” Onoma 35:215–225. doi:10.2143/ONO.35.0.574376.
- Oulasvirta, A., S. Estlander, and A. Nurminen. 2009. “Embodied Interaction with a 3D versus 2D Mobile Map.” Personal and Ubiquitous Computing 13 (4): 303–320. doi:10.1007/s00779-008-0209-0.
- Page, T. 2014. “Skeuomorphism or flat design: future directions in mobile device User Interface (UI) design education.” International Journal of Mobile Learning and Organization 8 (2): 130–142. doi:10.1504/IJMLO.2014.062350.
- Palazzi, A., D. Abati, R. Cucchiara, R. Cucchiara, and R. Cucchiara. 2018. “Predicting the Driver’s Focus of Attention: The DR (Eye) VE Project.” IEEE Transactions on Pattern Analysis and Machine Intelligence 41 (7): 1720–1733. doi:10.1109/TPAMI.2018.2845370.
- Park, J., P. A. Chou, and J.-N. Hwang. 2018. “Volumetric Media Streaming for Augmented Reality. ” Paper read at 2018 IEEE Global communications conference (GLOBECOM), Abu Dhabi, United Arab Emirites.
- PCMag. Maps one touch zoom. PCMag 2016 cited 1 August 2022. Available from http://www.youtube.com/watch?v=_2aRcMw3DL0.
- Pearce, M. W. 2008. “Framing the Days: Place and Narrative in Cartography.” Cartography and Geographic Information Science 35 (1): 17–32. doi:10.1559/152304008783475661.
- Pearce, M. W. 2009. Place Codes: Narrative and Dialogical Strategies for Cartography. Paper read at 24th International Cartographic Conference, 15-21 November, at Santiago.
- Pearce, M. W. 2014. “The Last Piece Is You.” The Cartographic Journal 51 (2): 107–122. doi:10.1179/1743277414Y.0000000078.
- Peterson, M. P. 2014. Mapping in the Cloud. New York, NY: Guilford Press.
- Peterson, M. P. 2021. “A Comparison of Feature Density for Large Scale Online Maps.” Cartographic Perspectives (97):26–42.
- Pike, W. A., J. T. Stasko, R. Chang, and T. A. O’Connell. 2009. “The Science of Interaction.” Information Visualization 8 (4): 263–274. doi:10.1057/ivs.2009.22.
- Pousman, Z., and J. Stasko. 2006. “ A Taxonomy of Ambient Information Systems: Four Patterns of Design .” Paper read at Proceedings of the working conference on Advanced visual interfaces, Venezia, Italy.
- Pousman, Z., J. Stasko, and M. Mateas. 2007. “Casual information visualization: Depictions of data in everyday life.” IEEE Transactions on Visualization and Computer Graphics 13 (6): 1145–1152. doi:10.1109/TVCG.2007.70541.
- Thorn, R. 2018. “How to Play with Maps.”. MSc thesis. University of Wisconsin-Madison: Madison, WI.
- Raposo, P. 2017. “Scale and generalization.” In Geographic Information Science & Technology Body of Knowledge, edited by J. P. Wilson. Raleigh-Durham, USA: UCGIS doi.10.22224/gistbok/2017.4.3.
- Rappo, A., A. Cecconi, and D. Burghardt. 2004. “Fischaugenprojektionen für generalisierte Kartendarstellungen auf kleinen Bildschirmen.” KN-Journal of Cartography and Geographic Information 54 (2): 73–79. doi:10.1007/BF03545035.
- Ratajski, L. 1967. “Phenomenes Des Points de Generalization.” International Yearbook of Cartography 7:143–151.
- Raubal, M., and S. Winter. 2002.“Enriching wayfinding instructions with local landmarks.”. “ In Geographic Information Science, Lecture Notes in Computer ScienceBerlin-Heidelberg: Springer-Verlag. doi:10.1007/3-540-45799-2_17.
- Reichenbacher, T. 2001. “Adaptive Concepts for a Mobile Cartography.” Journal of Geographical Sciences 11 (1): 43–53. doi:10.1007/BF02837443.
- Reichenbacher, T. 2004. Mobile Cartography: Adaptive Visualization of Geographic Information on Mobile Devices. Munich: Technische Universitat Munchen.
- Reichenbacher, T. 2005. “Adaptive Egocentric Maps for Mobile Users.” In Map-based Mobile Services, edited by L. Meng, A. Zipf, and T. Reichenbacher, 141-158. Springer.
- Rice, M. T., R. D. Jacobson, D. R. Caldwell, S. D. McDermott, F. I. Paez, A. O. Aburizaiza, K. M. Curtin, A. Stefanidis, and H. Qin. 2013. “Crowdsourcing Techniques for Augmenting Traditional Accessibility Maps with Transitory Obstacle Information.” Cartography and Geographic Information Science 40 (3): 210–219. doi:10.1080/15230406.2013.799737.
- Richardson, P. 2018.“ bendy-map.” Accessed1 August 2022. Retieved from http://github.com/meetar/bendy-map.
- Richardson, A. E., D. R. Montello, and M. Hegarty. 1999. “Spatial knowledge acquisition from maps and from navigation in real and virtual environments.” Memory & cognition 27 (4): 741–750. doi:10.3758/BF03211566.
- Riche, N. H., C. Hurter, N. Diakopoulos, and S. Carpendale. 2018. Data-driven Storytelling. Boca Raton, USA:CRC Press.
- Ricker, B. 2019. “Mobile Devices.” In Geographic Information Science & Technology Body of Knowledge, edited by J. P. Wilson. Raleigh-Durham, USA: UCGIS. doi.10.22224/gistbok/2018.2.5.
- Ricker, B., S. Daniel, and N. Hedley. 2014. “Fuzzy Boundaries: Hybridizing location-based Services, Volunteered Geographic Information, and Geovisualization Literature.” Geography Compass 8 (7): 490–504. doi:10.1111/gec3.12138.
- Ricker, B. A., and R. E. Roth. 2018. “Mobile Maps and Responsive Design.” In Geographic Information Science & Technology Body of Knowledge, edited by J. P. Wilson. Raleigh-Durham, USA: UCGIS.doi.10.22224/gistbok/2018.2.5.
- Ricker, B., N. Schuurman, and F. Kessler. 2015. “Implications of smartphone usage on privacy and spatial cognition: Academic literature and public perceptions.” GeoJournal 80 (5): 637–652. doi:10.1007/s10708-014-9568-4.
- Robinson, A. C. 2008. Collaborative Synthesis of Visual Analytic Results. Paper read at Visual Analytics Science and Technology, October 19-24, at Columbus, OH.
- Robinson, A. C. 2011. “Highlighting in Geovisualization.” Cartography and Geographic Information Science 38 (4): 373–383. doi:10.1559/15230406384373.
- Robinson, A. C., J. Chen, E. J. Lengerich, H. G. Meyer, and A. M. MacEachren. 2005. “Combining Usability Techniques to Design Geovisualization Tools for Epidemiology.” Cartography and Geographic Information Science 32 (4): 243–255. doi:10.1559/152304005775194700.
- Robinson, A. C., U. Demšar, A. B. Moore, A. Buckley, B. Jiang, K. Field, M.-J. Kraak, S. P. Camboim, and C. R. Sluter. 2017. “Geospatial big data and cartography: research challenges and opportunities for making maps that matter.” International Journal of Cartography 3 (sup1): 32–60.
- Robinson, A., J. Morrison, P. Muehrcke, J. Kimerling, and S. C. Guptill. 1995. Elements of Cartography. New York, USA: John Wiley & Sons.
- Robinson, A. C., R. E. Roth, and A. M. MacEachren. 2010. Challenges for map symbol standardization in crisis management. Paper read at ISCRAM.
- Roche, S. 2020. “Smile, You’re Being Traced! Some Thoughts about the Ethical Issues of Digital Contact Tracing Applications.” Journal of Location Based Services 14 (2): 71–91. doi:10.1080/17489725.2020.1811409.
- Rød, J. K., F. Ormeling, and C. van Elzakker. 2001. “An Agenda for Democratising Cartographic Visualization.” Norsk Geografisk Tidsskrift-Norwegian Journal of Geography 55 (1): 38–41. doi:10.1080/00291950120034.
- Rose-Redwood, R., and D. Alderman. 2011. “Critical Interventions in Political Toponymy.” ACME: An International Journal for Critical Geographies 10 (1): 1–6.
- Rose-Redwood, R., D. Alderman, and M. Azaryahu. 2010. “Geographies of Toponymic Inscription: New Directions in Critical place-name Studies.” Progress in Human Geography 34 (4): 453–470. doi:10.1177/0309132509351042.
- Rose, C., R. Roth, and K. Woodward. 2013. Wisconsin State Capitol Building tileset 2013. Accessed 1 January 2015 Retrieved from http://cmrrose.github.io/capitolMap/.
- Roth, R. E. 2012. “Cartographic Interaction Primitives: Framework and Synthesis.” The Cartographic Journal 49 (4): 376–395.
- Roth, R. E. 2013a. “An empirically-derived Taxonomy of Interaction Primitives for Interactive Cartography and Geovisualization.” Transactions on Visualization & Computer Graphics 19 (12): 2356–2365. doi:10.1109/TVCG.2013.130.
- Roth, R. E. 2013b. “Interactive Maps: What We Know and What We Need to Know.” The Journal of Spatial Information Science 6:59–115 http://josis.org/index.php/josis/issue/archive
- Roth, R. E. 2017a. “User Interface and User Experience (UI/UX) Design.” In Geographic Information Science & Technology Body of Knowledge, edited by J. P. Wilson. Raleigh-Durham, USA: UCGIS doi.10.22224/gistbok/2017.2.5.
- Roth, R. E. 2017b. “Visual Variables.” International Encyclopedia of Geography: People, the Earth, Environment and Technology 1–11. doi.10.1002/9781118786352.wbieg0761.
- Roth, R. E. 2019a. “How Do user-centered Design Studies Contribute to Cartography?” Geografie 124 (2): 133–161. doi:10.37040/geografie2019124020133.
- Roth, R. E. 2019b. “What Is Mobile First Cartographic Design? ” Paper read at ICA Joint Workshop on User Experience Design for Mobile Cartography, Beijing, China.
- Roth, R. E. 2021. “Cartographic design as visual storytelling: synthesis and review of map-based narratives, genres, and tropes.” The Cartographic Journal 58 (1): 83–114. doi:10.1080/00087041.2019.1633103.
- Roth, R. E., C. A. Brewer, and M. S. Stryker. 2011. “A Typology of Operators for Maintaining Legible Map Designs at Multiple Scales.” Cartographic Perspectives 68.
- Roth, R. E., A. Çöltekin, L. Delazari, H. F. Filho, A Griffin, A Hall, J Korpi, I Lokka, A Mendonça, and K. Ooms C. van Elzakker 2017. “User Studies in Cartography: Opportunities for Empirical Research on Interactive Maps and visualizations.” International Journal of Cartography 3 (sup1): 61–89. doi:10.1080/23729333.2017.1288534.
- Roth, R. E., R. G. Donohue, C. M. Sack, T. R. Wallace, and T. M. A. Buckingham. 2014. “A Process for Keeping Pace with Evolving Web Mapping Technologies.” Cartographic Perspectives 78:25–52.
- Roth, R. E., A. Griffin, and H. Huang. 2024. “User Experience Design for Mobile Cartography: Setting the Agenda.” Journal of Location Based Services.
- Roth, R. E., and M. Harrower. 2008. “Addressing map interface usability: Learning from the Lakeshore Nature Preserve Interactive Map.” Cartographic Perspectives 60 (Spring): 46–66. doi:10.14714/CP60.231.
- Roth, R. E., and A. M. MacEachren. 2016. “Geovisual Analytics and the Science of Interaction: An Empirical Interaction Study.” Cartography and Geographic Information Science 43 (1): 30–54. doi:10.1080/15230406.2015.1021714.
- Roth, R. E., S. Young, C Nestel, C Sack, B. Davidson, J. Janicki, V. Knoppke-Wetzel, F. Ma, R. Mead, and C. Rose. 2018. “Global Landscapes: Teaching Globalization through Responsive Mobile Map Design.” The Professional Geographer 70 (3): 395–411. doi:10.1080/00330124.2017.1416297.
- Rowe, P. G. 1991. Design Thinking. Cambridge, USA: MIT press.
- Ruginski, I. T., S. H. Creem-Regehr, J. K. Stefanucci, and E. Cashdan. 2019. “GPS Use Negatively Affects Environmental Learning through Spatial Transformation Abilities.” Journal of Environmental Psychology 64(August):12–20. doi:10.1016/j.jenvp.2019.05.001.
- Sack, C. 2013. Online Participatory Mapping: Volunteered Geographic Information Tools for Local Empowerment over Land Use. Paper read at 26th International Cartographic Conference, at Dresden, Germany.
- Sarjakoski, L. T. 2007. “Conceptual models of generalization and multiple representation.” In Generalization of geographic information: Cartographic modelling and applications, edited by W. A. Mackaness, A. Ruas, and L. T. Sarjakoski: Elsevier. 11–35
- Sarjakoski, L. T., and A. M. Nivala 2005.“Adaptation to context—a way to improve the usability of mobile maps”. In Map-based mobile services: Theories, methods and implementations, edited by Meng, L., Zipf, A. and T. Reichenbacher, 107–123 Berlin, Heidelberg: Springer Berlin Heidelberg. doi:10.1007/3-540-26982-7_8.
- Satyanarayanan, M. 2001. “Pervasive computing: Vision and challenges.” IEEE Personal communications 8 (4): 10–17. doi:10.1109/98.943998.
- Savino, G.-L., M. Sturdee, S. Rundé, C. Lohmeier, B. Hecht, C. Prandi, N. J. Nunes, and J. Schöning. 2021. “MapRecorder: Analyzing real-world Usage of Mobile Map Applications.” Behaviour & Information Technology 40 (7): 646–662. doi:10.1080/0144929X.2020.1714733.
- Šavrič, B., B. Jenny, and H. Jenny. 2016. “Projection wizard–an Online Map Projection Selection Tool.” The Cartographic Journal 53 (2): 177–185. doi:10.1080/00087041.2015.1131938.
- Šavric, B., B. Jenny, D. White, and D. R. Strebe. 2015. “User Preferences for World Map Projections.” Cartography and Geographic Information Science 42 (5): 398–409. doi:10.1080/15230406.2015.1014425.
- Schafer, R. M. 1993. The Soundscape: Our Sonic Environment and the Tuning of the World. New York, USA: Simon and Schuster.
- Schall, G., E Mendez, E Kruijff, E Veas, S. Junghanns, B. Reitinger, and D. Schmalstieg. 2009. “Handheld augmented reality for underground infrastructure visualization.” Personal and Ubiquitous Computing 13 (4): 281–291. doi:10.1007/s00779-008-0204-5.
- Schwab, M., S. Hao, O. Vitek, J Tompkin, J Huang, and M. A. Borkin. 2019. “Evaluating Pan and Zoom Timelines and Sliders. ” Paper read at Proceedings of the 2019 CHI conference on human factors in computing systems, Glasgow, Scotland.
- Sedlmair, M., M. Meyer, and T. Munzner. 2012. “Design Study Methodology: Reflections from the Trenches and the Stacks.” IEEE Transactions on Visualization and Computer Graphics 18 (12): 2431–2440. doi:10.1109/TVCG.2012.213.
- Segel, E., and J. Heer. 2010. “Narrative Visualization: Telling Stories with Data.” IEEE Transactions on Visualization and Computer Graphics 16 (6): 1139–1148. doi:10.1109/TVCG.2010.179.
- Shahat, E., C. T. Hyun, and C. Yeom. 2021. “City digital twin potentials: A review and research agenda.” Sustainability 13 (6): 3386. doi:10.3390/su13063386.
- Shneiderman, B., and C. Plaisant. 2020. Designing the user interface: Strategies for effective human-computer interaction. Boston, MA: Addison-Wesley.
- Shum, A., K Holmes, K Woolery, M. Price, D. Kim, E. Dvorkina, D. Dietrich-Muller, et al. 2016. Inclusive Design Toolkit.
- Smith, A., K. McGeene, M. Duggan, L. Rainie, and S. Keeter. U.S. smartphone use in 2015 2015 cited 1 August 2022. Available 1 August 2022 from http://www.pewinternet.org/2015/04/01/us-smartphone-use-in-2015/.
- Snyder, J. P. 1987. Map projections–A Working Manual. Washington D.C., USA: US Government Printing Office.
- Soh, B. K., and T. L. Smith-Jackson. 2004. “Influence of Map Design, Individual Differences, and Environmental Cues on Wayfinding Performance.” Spatial Cognition and Computation 4 (2): 137–165. doi:10.1207/s15427633scc0402_2.
- Stachoň, Z., P. Kubicek, and L. Herman. 2020. “Virutal and Immersive Environments.” In Geographic Information Science & Technology Body of Knowledge, edited by J. P. Wilson. Raleigh-Durham, USA: UCGIS, doi:10.22224/gistbok/2020.3.9.
- Stephens, M. 2013. “Gender and the GeoWeb: Divisions in the Production of user-generated Cartographic Information.” GeoJournal 78 (6): 981–996. doi:10.1007/s10708-013-9492-z.
- Stevens, J. E., A. C. Robinson, and A. M. MacEachren. 2013. Designing Map Symbols for Mobile Devices: Challenges, Best Practices, and the Utilization of Skeuomorphism. Paper read at International Cartographic Conference, at Dresden, Germany.
- Stolper, C. D., B. Lee, N. H. Riche, and J. Stasko. 2016. Emerging and Recurring data-driven Storytelling Techniques: Analysis of a Curated Collection of Recent Stories. Washington, USA: Microsoft Research.
- Sutton, J., T. Langlotz, A. Plopski, S. Zollmann, Y. Itoh, and H. Regenbrecht. 2022. “Look over there! investigating saliency modulation for visual guidance with augmented reality glasses.” Paper Read at the 35th Annual ACM Symposium on User Interface Software and Technology. New York, USA Association for Computing Machinery.
- Swan, M. 2012. “Sensor Mania! the Internet of Things, Wearable Computing, Objective Metrics, and the Quantified Self 2.0.” Journal of Sensor and Actuator Networks 1 (3): 217–253. doi:10.3390/jsan1030217.
- Swan, M. 2013. “The Quantified Self: Fundamental Disruption in Big Data Science and Biological Discovery.” Big Data 1 (2): 85–99. doi:10.1089/big.2012.0002.
- Tabassum, N. 2021. A Systematic Approach to Formulate Design Recommendations for location-based Stories in Augmented Reality, Cartography. Munich: Technical University Munich.
- Tait, A. 2018. “Visual Hierarchy and Layout.” In Geographic Information Science & Technology Body of Knowledge, edited by J. P. Wilson. Raleigh-Durham, USA: UCGIS. doi.10.22224/gistbok/2018.2.4.
- Taylor, K., and L. Silver. Smartphone ownership is growing rapidly around the world, but not always equally. Pew Research Center 2019 cited 1 August 2022. Available from 1 August 2022 http://www.pewresearch.org/global/2019/02/05/smartphone-ownership-is-growing-rapidly-around-the-world-but-not-always-equally/.
- Thomas, J. J., K. A. Cook, A. Bartoletti, S. Card, D. Carr, J. Dill, R. Earnshaw, et al. 2005. Illuminating the Path: The Research and Development Agenda for Visual Analytics. Los Alametos, CA: IEEE CS Press.
- Thrash, T., S Lanini-Maggi, S. I Fabrikant, S. Bertel, A. Brügger, S. Credé, C. T. Do, G. Gartner, H. Huang, and S. Münzer. 2019. “The Future of Geographic Information Displays from Giscience, Cartographic, and Cognitive Science Perspectives. ” Paper read at 14th International Conference on Spatial Information Theory (COSIT 2019), Regensburg, Germany.
- Tliba, M., M. A Kerkouri, B Ghariba, A Chetouani, A Çöltekin, M. S. Shehata, and A. Bruno. 2022. “SATSal: A Multi-Level Self-Attention Based Architecture for Visual Saliency Prediction.” IEEE Access 10:20701–20713. doi:10.1109/ACCESS.2022.3152189.
- Töpfer, F., and W. Pillewizer. 1966. “The Principles of Selection.” The Cartographic Journal 3 (1): 10–16. doi:10.1179/caj.1966.3.1.10.
- Towler, J. O. 1970. “Egocentrism and Map Reading Ability.”
- Tsou, M.-H. 2004. “Integrated Mobile GIS and Wireless Internet Map Servers for Environmental Monitoring and Management.” Cartography and Geographic Information Science 31 (3): 153–165. doi:10.1559/1523040042246052.
- Tufte, E. R. 1990. Envisioning Information. Cheshire, CT: Graphics Press.
- Turner, A. J. 2006. “Introduction to Neogeography.” O’Reilly.
- Underwood, N. 2022. Mapping Guatemale-US migration: A case study in critical visual storytellign, Geography. Madison: University of Wisconsin-Madison.
- Valliappan, N., N. Dai, E. Steinberg, J. He, K. Rogers, V. Ramachandran, P. Xu, M. Shojaeizadeh, L. Guo, and K. Kohlhoff. 2020. “Accelerating Eye Movement Research via Accurate and Affordable Smartphone Eye Tracking.” Nature Communications 11 (1): 1–12. doi:10.1038/s41467-020-18360-5.
- Van Dam, A. 1997. “Post-WIMP User Interfaces.” Communications of the ACM 40 (2): 63–67. doi:10.1145/253671.253708.
- van Elzakker C.P.J.M., I. Delikostidis, and P. J. M. van Oosterom. 2008.“Field-based usability evaluation methodology for mobile geo-applications”. The Cartographic Journal.45 (2): 139–149. doi:10.1179/174327708X305139.
- van, Tonder, B., and J. Wesson. 2009. “Design and Evaluation of an Adaptive Mobile map-based Visualization System.” In Human-Computer Interaction, Lecture Notes in Computer Science, edited by T. Gross, J. Gulliksen, P. Kotzé, L. Oestreicher, P. Palanque, R. O. Prates, and M. Winckler, 839–852. Berlin-Heidelberg: Spring-Verlag.
- Vincent, K., R. E. Roth, S. A. Moore, Q. Huang, N. Lally, C. M. Sack, E. Nost, and H. Rosenfeld. 2019. “Improving Spatial Decision Making Using Interactive Maps: An Empirical Study on Interface Complexity and Decision Complexity in the North American Hazardous Waste Trade.” Environment and Planning B: Urban Analytics and City Science 46 (9): 1706–1723.
- Wallace, T. R. 2016. Cartographic Journalism: Situating Modern News Mapping in a History of Map-User Interaction. Madison, USA: University of Wisconsin-Madison.
- Wang, J., X. Lin, and C. North. 2012. GreenVis: Energy-saving Color Schemes for Sequential Data Visualization on OLED Displays. Blacksburg, USA: Department of Computer Science, Virginia Polytechnic Institute & State University.
- Wang, X., C. van Elzakker, and M.-J. Kraak. 2017. “Conceptual Design of a Mobile Application for Geography Fieldwork Learning.” ISPRS International Journal of Geo-Information 6 (11): 355. doi:10.3390/ijgi6110355.
- Ward, K. 1979. “Cartography in the Round—The Orthographic Projection.” The Cartographic Journal 16 (2): 104–116. doi:10.1179/caj.1979.16.2.104.
- Ware, C. 2021. Information Visualization: Perception for Design. Cambridge, MA: Morgan Kaufmann.
- Webb, M. SMART 2020: Enabling the Low Carbon Economy in the Information Age. The Climate Group 2008 cited 1 August 2022. Available from 1 August 2022http://www.sustainabilityexchange.ac.uk/files/enabling_the_low_carbon_economy_in_the_information_age_1.pdf.
- Weibel, R., and G. Dutton. 1999. “Generalizing Spatial Data and Dealing with Multiple Representations.” Geographical Information Systems 1:125–155.
- Weiser, M., and J. S. Brown. 1996. “Designing calm technology.” PowerGrid Journal 1 (1): 75–85.
- Wen, W., T. Ishikawa, and T. Sato. 2013. “Individual Differences in the Encoding Processes of Egocentric and Allocentric Survey Knowledge.” Cognitive Science 37 (1): 176–192. doi:10.1111/cogs.12005.
- White, T. 2017. “Symbolization and the Visual Variables.” In Geographic Information Science & Technology Body of Knowledge, edited by J. P Wilson. Raleigh-Durham, USA: UCGIS. doi.10.22224/gistbok/2017.2.3.
- Whitefield, A., A. Escgate, I. Denley, and P. Byerley. 1993. “On Distinguishing Work Tasks and Enabling Tasks.” Interacting with Computers 5 (3): 333–347. doi:10.1016/0953-5438(93)90014-K.
- Willis, K. S., C. Hölscher, G. Wilbertz, and C. Li. 2009. “A Comparison of Spatial Knowledge Acquisition with Maps and Mobile Maps.” Computers, Environment and Urban Systems 33 (2): 100–110. doi:10.1016/j.compenvurbsys.2009.01.004.
- Wilson, M. W. 2011. “‘Training the Eye’: Formation of the Geocoding Subject.” Social & Cultural Geography 12 (4): 357–376. doi:10.1080/14649365.2010.521856.
- Wilson, M. W. 2012. “Location-based Services, Conspicuous Mobility, and the location-aware Future.” Geoforum 43 (6): 1266–1275. doi:10.1016/j.geoforum.2012.03.014.
- Wilson, M. W. 2015. “Flashing Lights in the Quantified self-city-nation.” Regional Studies, Regional Science 2 (1): 39–42. doi:10.1080/21681376.2014.987542.
- Winter, S., M. Raubal, and C. Nothegger. 2005. “Focalizing Measures of Salience for Wayfinding.” In Map-based Mobile Services, edited by L. Meng, A. Zipf, and T. Reichenbacher. 125–139: Springer.
- Woodruff, A. 2007. The Utility of Aerial Photographs in Online Maps, Geography. Madison: University of Wisconsin–Madison.
- Wu, H.-Y. 2016. “ Focus+ Context Metro Map Layout and Annotation .” Paper read at Proceedings of the 32nd Spring Conference on Computer Graphics, Smolenice, Slovakia.
- Wu, M., T. Chen, H. Wang, G. Lv, and A. X. Zhu. 2018. “An Adaptive Approach to Create On‐demand Color Schemes for Mapping Quantitative Geographic Data.” Color Research & Application 43 (4): 569–585. doi:10.1002/col.22212.
- Wu, M., L. Guonian, L. Qiao, R. E. Roth, and A-X. Zhu. 2024. “Green Cartography: A Research Agenda Towards Sustainable Development.” Annals of GIS. doi:10.1080/19475683.2024.2305321.
- Yamamoto, D., S. Ozeki, and N. Takahashi. 2009. “Wired Fisheye Lens: A motion-based Improved Fisheye Interface for Mobile Web Map Services .” Paper read at International Symposium on Web and Wireless Geographical Information Systems, Maynooth, Ireland.
- Yan, J., A. A. Diakité, and S. Zlatanova. 2018. “An Extraction Approach of the top-bounded Space Formed by Buildings for Pedestrian Navigation.” ISPRS Annals of Photogrammetry, Remote Sensing & Spatial Information Sciences 4 (4): 247-–254
- Yanow, K. 2018. “Remote Sensing Platforms.” In Geographic Information Science & Technology Body of Knowledge, edited by J. P. Wilson. Raleigh-Durham, USA: UCGIS. doi.10.22224/gistbok/2018.4.1.
- Yi, J. S., Y. A. Kang, J. T. Stasko, and J. A. Jacko. 2007. “Toward a Deeper Understanding of the Role of Interaction in Information Visualization.” Transactions on Visualization and Computer Graphics 13 (6): 1224–1231. doi:10.1109/TVCG.2007.70515.
- Zhou, P, Y Zheng, Z Li, M Li, and G. Shen. 2012. “Iodetector: A Generic Service for Indoor Outdoor Detection .” Paper read at Proceedings of the 10th acm conference on embedded network sensor systems, Toronto, Canada.
- Zhu, Q., Y. Li, Q. Xiong, S. Zlatanova, Y Ding, Y Zhang, and Y. Zhou. 2016. “Indoor multi-dimensional Location Gml and Its Application for Ubiquitous Indoor Location Services.” ISPRS International Journal of Geo-Information 5 (12): 220. doi:10.3390/ijgi5120220.
- Zhu, L., J Shen, J Zhou, Z. Stachoň, S. Hong, and X. Wang. 2022. “Personalized Landmark Adaptive Visualization Method for Pedestrian Navigation Maps: Considering User Familiarity.” Transactions in GIS 26 (2): 669–690. doi:10.1111/tgis.12877.
- Zipf, A. 2002. User-adaptive Maps for location-based Services (LBS) for Tourism. Paper read at Information and Communication Technologies in Tourism, at Innsburck.
- Zipf, A., and K.-F. Richter. 2002. “Using Focus Maps to Ease Map Reading.” Künstliche Intelligenz 4 (2): 35–37.
- Zlatanova, S.U. Isikdag. 2015. “3D Indoor Models and Their Applications.” In Encyclopedia of GIS, edied by Shekhar, S., Xiong, H., and Zhou, X. Cham: Springer. doi.10.1007/978-3-319-23519-6_1551-1.
- Zlatanova, S., G. Sithole, M. Nakagawa, and Q. Zhu. 2013. “Problems in Indoor Mapping and Modelling.” In Acquisition and Modelling of Indoor and Enclosed Environments 2013. Cape Town, South Africa: ISPRS Archives 4/W4.
- Zook, M. A., and M. Graham. 2007. “Mapping DigiPlace: Geocoded Internet Data and the Representation of Place.” Environment and Planning B: Planning and Design 34 (3): 466–482. doi:10.1068/b3311.