
 ?Mathematical formulae have been encoded as MathML and are displayed in this HTML version using MathJax in order to improve their display. Uncheck the box to turn MathJax off. This feature requires Javascript. Click on a formula to zoom.
ABSTRACT
Extreme climate conditions present the greatest challenge in achieving thermal comfort in buildings. To address this issue, researchers have evaluated the effectiveness of various low-carbon strategies in extreme climates, assessing their impact on comfort levels and carbon emissions. Among the strategies examined are shading, natural ventilation, dehumidification/humidification, insulation, and green roofs. This research uses dynamic thermal simulations to investigate the efficacy of these strategies on a detached house in extremely dry, humid, and cold climates. Although the study found that insulation is the most effective design strategy, a range of context-specific design combinations can substantially reduce HVAC loads, with reductions of 39%, 32%, and 40% achievable for tropical, dry, and cold climates, respectively. These findings underline the importance of carefully considering design strategies when constructing buildings in extreme climates. By employing a combination of insulation, shading, natural ventilation, and other low-carbon strategies, architects, and builders can create buildings that are more resilient and comfortable to inhabit while minimizing their carbon footprint.
1. Introduction
As reported by the World Green Building Council, the built environment is responsible for 39% of carbon emissions globally (WGBC Citation2019) and based on the findings of the International Energy Agency (Citation2018), the energy consumed for electricity and HVAC system across all building typologies reaches approximately 33% of total carbon emissions. These highlight the role of architects and engineers in reducing global emissions, in the era of changing climate, through a reduction in energy demand and improving building performance (Nazi et al. Citation2017). Climate change mitigation strategies are diverse and complex (BEIS Citation2021). The WGBC (Citation2021) reported that the built environment sector impacts are up to 53% of the 17 United Nations Sustainable development goals, including industry, innovation and infrastructure, sustainable cities, climate action, and well-being.
Zero to low carbon emission design generally refers to ‘a design with less or no dependency on energy-intensive high-emission cooling and heating technologies to achieve comfort for users’ (Gething et al. Citation2010). Schrot et al. (Citation2021) warn demanding climate change conditions push architecture to address extreme climate conditions even though Domingos and Rato (Citation2019) stated that severe weather has always existed, and architecture technology should focus on improving techniques in such situations. especially, when the future showcases hotter summers and warmer winters worldwide. The purpose of this research is to simulate and analyse the effectiveness of low carbon strategies for achieving thermal comfort in extreme climates.
2. Literature review
Based on the literature, the following design strategies and technologies are found to be most effective in improving thermal comfort and reducing carbon emissions in extreme climates:
Shading: These devices are mainly labelled as louvred shades, overhangs or side fins. These are most predominantly located at outdoor windows but could also be at indoor or other openings. The definition of the shape depends on the capability of sunlight infiltration or visibility. In shading simulation studies, Lavafpour and Sharples (Citation2015), Nematchoua et al. (Citation2020), and Touma and Ouahrani (Citation2017) quantified the positive effect of shadings in extreme climates. Elouadjeri, Boussoualim, and Haddou (Citation2021) reported shading devices impact daylighting, but the most appropriate approach should be based on multicriteria strategies. Furthermore, high-performance devices such as kinetic shading actively mitigates the weather conditions through changing seasonal and daily sun orientation (Wanas et al. Citation2015).
Dehumidification / Humidification: This process regulates air flow, especially indoor space’s relative humidity. Once the Internal Air Quality is affected, it is necessary to use humidity control and moisture buffering to improve thermal comfort while decreasing the HVAC demand (IEA Citation2013). Spaces below 40% relative humidity tend to be unhealthy for users (Tu, Li, and Hwang Citation2020). A hot-humid climate with a relative humidity of over 60%, increases the use of cooling devices, as stated in the parametric study with EnergyPlus (version 6.0). Therefore, indoor humidity control and infiltration minimization reduce energy consumption (Fang, Winkler, and Christensen Citation2010). This highlights the fact that accurate regulator devices could be ideal for high indoor humidity cases. The principle of such regulators is to circulate the saturated water vapour indoors through a dry airflow in a chamber (Veldscholte, Horst, and de Beer Citation2021). They could also be effective in dry and cold climate Furthermore, Osanyintola and Simonson (Citation2006) state hygroscopic finishes decrease heating demand between 2% and 3%, and 5% to 30% on cooling Energy.
Natural Ventilation: As stated in ASHRAE (Citation2021), this is the ‘flow of outdoor caused by wind and thermal pressures through intentional openings in a building’s shell’. The relation between local conditions and building for efficient ventilation relays on window sizes, location and most notably, building orientation. Such strategies can reduce the consumption of cooling devices, avoid moisture condensation, and allow fresh air for healthy indoor spaces. According to Brager and Baker (Citation2009), using natural ventilation instead of electro-mechanical ventilation earns health cost savings by nearly 18%.
Thermal Insulation: In the case of ‘Thermal Insulation’, the aim is to have a high thermal resistance and low thermal conductivity (Livesey, Suttie, and Scovell Citation2013) Another relevant feature is the ‘Thermal transmittance’ or U-Value. Allbury and Anderson (Citation2011), classified insulation materials as ‘Traditional’, ‘Organic’ and ‘Advanced Material’. The most common ones worldwide are the following:
Mineral Fiber: is a ‘Traditional’ insulation material. Predominantly, according to Livesey, Suttie, and Scovell (Citation2013), stone wool is used for roof and truss insulation. These are usually found as batts and composite panels.
Expandable polystyrene (EPS): is an ‘Organic Non-Renewable’ insulation material. Kon and Caner (Citation2020) stated that the high vapour diffusion resistance coefficient for EPS by 30 µ is suitable for avoiding condensation and optimum thickness depends on the combined performance between temperature and dewpoint gradients of materials in the building envelope.
Domingos and Rato (Citation2019) suggest the effectiveness of ‘Multicriteria strategies’ for buildings is dependent on the optimum use of thermal insulation materials for the envelope, they established the following guidelines for extreme climate conditions in :
Phase Change Material (PCM): is an ‘Advance material’, not a rigorously thermal insulator. However, this works as a thermal energy storage (Baetens, Jelle, and Gustavsen Citation2010). This material is encapsulated mostly as a wallboard ideally designed for extreme seasonal temperatures (Feldman et al. Citation1991). As stated by Pacheco-Torgal et al. (Citation2014) natural resources for PCM are ideal scenarios due to its high embodied carbon. Alternatively, Sajjadian, Lewis, and Sharples (Citation2015) highlighted the benefits of PCM and Air gap integration to improve the PCM effects. Moreover, they reflect on the positive impacts of this thermal energy strategy on residential buildings.
Green Roof: This roof typology is suitable for energy conservation, reducing the thermal island effect and absorbing greenhouse gases. This roof is an envelope component that requires more rigorous techniques, irrigation systems, and site precipitation studies compared to a conventional roof (Grullón – Penkova, Zimmerman, and González Citation2020). Velasco and Roth (Citation2010) stated, the passive approach of green roof vegetation processes helps capture CO2 from the surroundings; therefore, this is ideal for carbon sequestration. In slightly moderate environments, such as the Mediterranean zones (subtropical oceanic), decrease of cooling demand in summer by 11% is reported with green roofs (Ascione et al. Citation2013).
Table 1. Extreme climate envelope (Domingos and Rato Citation2019).
The selected strategies aim to influence indoor thermal comfort. Thermal comfort is challenging to quantify as it relies on environmental conditions, occupant metabolism and occupant’s perception of feeling cold or hot within an indoor space and is highly dependent on context. Even though there is no universally accepted quantitative metric for thermal comfort. ASHRAE 55 standard has been widely used for thermal comfort assessment due to its clear guidelines, consistent development based on research and industry acceptance. This standard is for quantification in this study.
2.1. Extreme climate conditions
Beck et al. (Citation2020) classified five different types of climates; Tropical, Arid, Temperate, Continental, and Polar. Generally, every Climate and its sub-classification require a specific design. According to CIBSE (Citation2017a), the exponential growth of cities requires climate-based data to achieve a low-carbon built environment.
Despite the demanding conditions of Polar climate, such areas are not considered in this study because they are not populated to the same extent as the rest of the groups. Moreover, a Temperate climate is generally measured as comfortable with less requirement for HVAC systems to provide comfort (Jamei et al. Citation2021) large cities in cold, arid and tropical climates are the following (see ):
Cold: Montreal (Canada), Chicago (USA) and Helsinki (Finland).
Arid: Abu Dhabi (UEA), Lima (Peru) and New Delhi (India).
Tropical: Singapore (Singapore), Chennai (India) and Rio de Janeiro (Brazil).
In the guidance ‘Building for Extreme Environment’, CIBSE (Citation2014; Citation2017a; Citation2017b) emphasized the current and future extreme climate conditions in these zones (see ) as well as general strategies for adaptable building design:
Figure 1. Cold (Dfb), Tropical (Aw, As) and Arid (BWh) climates (1980–2016). Present and future Köppen-Geiger climate classification maps at 1-km resolution (Beck et al. Citation2020).
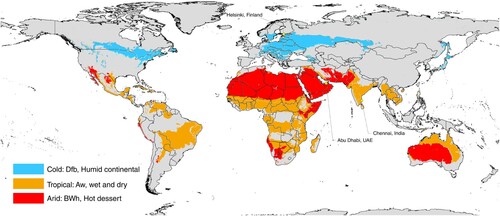
Table 2. Cities Climate condition.
3. Methods
The framework of effective design strategies was established based on the literature review as noted in section 1 and results are filtered by climate consultant software. A climate consultant (CC) digests EnergyPlus Weather (EPW) data to understand the local climate precisely. Climate physics such as ambient air temperature, radiation, dew point, sun shading, etc. are the basic information that this software process uses to suggest design strategies regarding determined locations (Murray Milne and Alshaali Citation2016). CC compilates the following annual data for cities:
Weather data summary: This includes the monthly average for 17 climate parameters.
Comfort Models: California Energy Code, ASHRAE Standard 55, ASHRAE 2005, Adaptative Comfort Model in ASHRAE 2010.
Criteria: Frame of strategies and their fundamental data.
Monthly graphics about Temperature Range, Diurnal and daylight hours averages, Sky cover range, Ground temperature, Dray bulb, Dew point and Relative Humidity, and Sun shading.
Psychrometric chart: Set up of local climate conditions.
Design framework: Set of different design strategies.
A digital 3D model is designed and used as case study for simulations. Simplicity, flexibility and adaptability of the model were the main considerations for comparative study. There is significant architectural and cultural differences in the studied cities but the characteristic of the model allows the focus to remain on effective strategies and technologies on energy, comfort and carbon emissions. Due to high accuracy of DesignBuilder on numerous studies (Martin-Escudero et al. Citation2022), the software is used for evaluations. This software analyses location and climates and Computational fluid dynamics (CFD) to optimise ventilation, indoor temperature, or airflow. Section 2.1, 2.2 and 2.3 provide details of the model and conditions of simulations including site parameters and how aforementioned design and technologies applied to the model.
3.1. Description of modelled house
A detached house is rectangular-shaped with a 65 total building area as shown in . The internal ceiling height is 2.5 m, and the pitched roof is a 30° slope facing South – North with 30 cm of overhang. The one-storey building has two bedrooms, one bathroom, one service room, one closet, one entrance hall, a living room, and a kitchen. The entrance faces north, and the building form is East–West orientation. Windows mostly face south; subsequently, individual windows face east and west equally.
Figure 2. Layout and 3D model used for simulation.
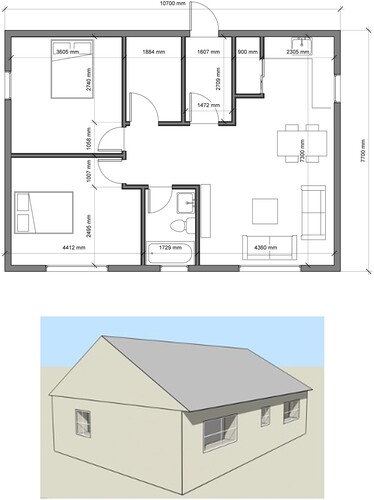
The model uses precast concrete for slabs and walls. Concrete is globally a popular construction material and in the last decades, has dominated the building industry due to its longevity, quality, and logistics benefits for construction developers (Kim, Kim, and Cho Citation2020). The U-Values for the wall and roof are shown in :
Table 3. Basic model envelope’s U-Value.
3.2. Site parameters
provides a detailed summary of the site parameters that were utilized in the simulations conducted for this research.
Table 4. Cities site parameters (EnergyPlus and World Meteorological Organization Citation2022).
Double glazed windows are used, and layers are generic clear 3 mm glass with a U-Value of 1.960 W/-K. No shading is included. The HVAC system is a fan coil unit (4-Piper) air cooler chiller, the heating uses natural gas, and the cooling system uses electricity from the grid.
3.3. Setting of strategies
displays the various low-carbon strategies that were simulated for each extreme climate condition, including dry, humid, and cold. The strategies were carefully selected based on their potential effectiveness in achieving thermal comfort and reducing carbon emissions.
Table 5. Strategies and coding.
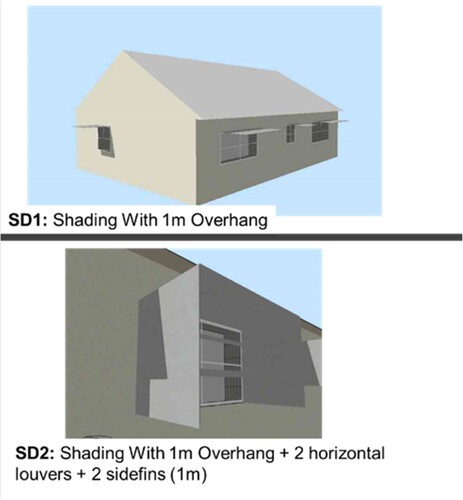
Two types of shadings are used as shown in . SD1 is a 1-meter overhang over the windows and SD2 has additional sidefins and louvers for bedroom one and living/kitchen. Circulation, service, or closet places were not considered for daylighting studies. The material applied for the shading options was steel.
Figure 3. 3D model with shading options in DB.
Depending on context humidification and dehumidification are activated. The Air Change rate per Hour is 5.00 ac/h.
4. Results and discussion
shows the extent of extreme climate in the selected cities, it shows the percentage of comfortability without energy loads in the model per year and the remaining percentage that needs multicriteria design strategies to achieve thermal comfort.
Figure 4. Comfort zone annually (8760 h) by ASHRAE 55 Methodology – Cities. Climate consultant.
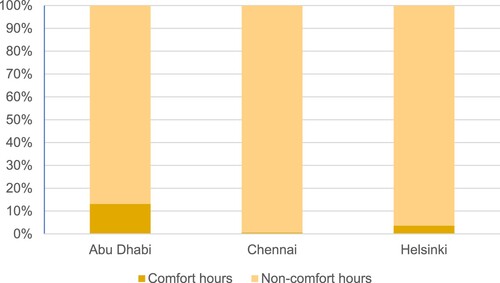
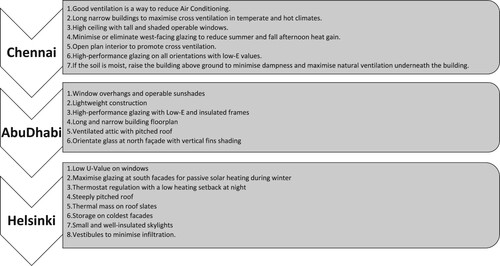
As shown in , the more challenging Climate is Chennai, India, where the comfortability hours are 0.6% per year. The climate conditions for design options based on the literature review and CC framework stated the following order () of design priorities for the case study.
Figure 5. Strategies per city.
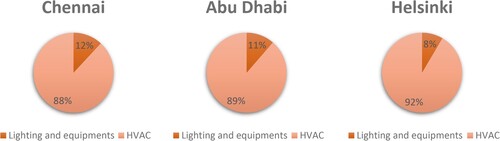
The focus of the analysis on this software was the energy consumption per square meter. For each scenario, energy distribution was divided between ‘Lighting and equipment’ and ‘Cooling and Heating’. Since ‘Lighting and equipment’ is a constant user consumption, the exact value of 1507 kWh is observed in different climates. The ‘HVAC Template’ used in this study is the ‘Fan Coil Unit (4-Pipe), Air cooled Chiller’ with seasonal CoP of 1.8 (for all climates). The HVAC energy consumption represents 88% to 92% overall energy load as shown in . The most severe case was Helsinki, where the rate is 92%.
Figure 6. Energy consumption distribution.
shows the effectiveness of each strategy as outlined in . shows overall energy savings where a combination of strategies is applied to the base case model and shows the energy per total building area improvement from the base model.
Figure 7. Effectiveness of operable energy decrease per strategies in different climates based on ().
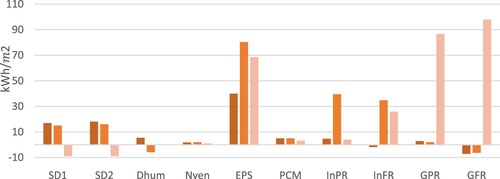
Figure 8. Comparison between the base model () and most effective design strategies (
).
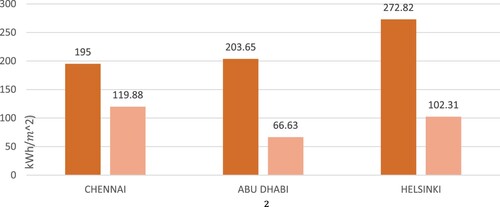
Table 6. Energy per total building area improvement from base model (kWh/).
The multicriteria in established the influence of the strategies. The best performance strategies are combined and compared with the base model energy performance in , which shows the effectiveness of the design improvement. shows the breakdown of each strategy’s effectiveness in Chennai.
Table 7. Design Strategies’ Effectiveness in Chennai.
Furthermore, this location is the most affected by overheating in the summer months; therefore, the SD2 achieves a desirable internal solar gain from windows to reduce energy consumption by 24%. Even though the daylight at SD2 implementation affects the annual hours of solar gain, there are no significant changes in lighting energy consumption because indirect natural lighting keeps spaces illuminated.
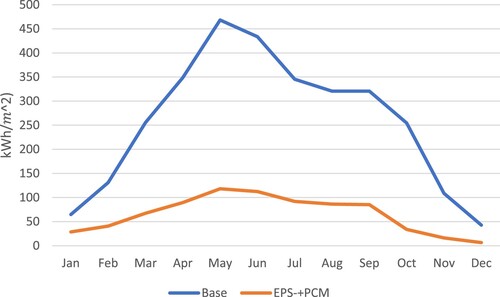
illustrates the effect of PCM in combination with EPS insulation. Therefore, the heat balance (kWh) stabilizes from 16kWh to 118 throughout the year, compared to the base model with the highest peak of 469.3 kWh in May.
Figure 9. Base model vs EPS + PCM for Chennai.
shows design Strategies’ Effectiveness in Abu Dhabi. It shows a similar trend to Chennai’s but with more negative impact from DHum and roof options. Like the tropical Climate, the insulation in the envelope shows significant impact. However, as expected overheating through solar gain at exterior windows in the base model created an excess energy consumption as shown in .
Table 8. Abu Dhabi’s design strategies’ effectiveness.
The best strategy in Abu Dhabi was the wall insulation (EPS) combined with PCM as shown in . The highest energy savings were in July and August.
Table 9. Comparison between base fabrics wall and EPS + PCM wall (kWh).
shows the results for Helsinki. Among the strategies, this was a climate in which insulation, as expected was the most effective strategy. Besides, Helsinki was the only one in the cases that GR has significant impact. shows the GR impact on energy loads throughout the year. Compared to the other cities, shadings have negative impact on the case study in Helsinki. This is due to the fact that Lighting level in Helsinki is significantly lower than the other two cities and use of shading devices is not improving comfort conditions, compares the daylight level in the three studies cities.
Figure 10. Daylight comparison in three cities, from top to bottom: Chennai, Abu Dhabi and Helsinki.
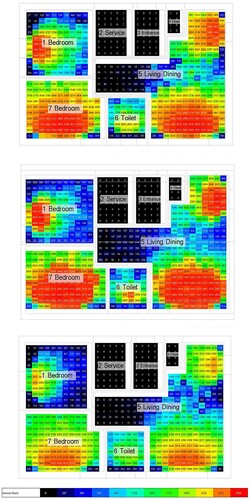
Table 10. Helsinki’s design strategies.
Table 11. Helsinki´s Comparison between base roof and GFR (kWh).
The annual simulation of the model in different climates achieves specific strategies and combinations ideal for reducing HVAC devices´ use. Dehumidification was notably efficient on Chennai’s Climate. Humidification had a neutral effect on Abu Dhabi as relative humidity normally fluctuates between 41% and 52%. Helsinki had months that humidity dropped below the recommended 40% from October to mid-March.
The Shading was effective in reducing overheating in Chennai and Abu Dhabi. Chennai has heavy seasonal rainfall with annual precipitation of 1400 mm (World Meteorological Organization Citation2022). This condition benefits irrigation for GR from June to December. However, the added thermal mass by the GR did not improve the performance in our model.
GR strategies are ideal for carbon sequestration too as it contributes to reducing the ‘urban heat island’ effect. DB currently does not include the projection of the carbon sequestration effect for GR. Furthermore, specific parameter settings for plant species do not create significant changes when simulated on DB. Wong et al. (Citation2003) highlight Climate’s sub-division, coordinates, microclimate and cities´ elevation from sea level are crucial for providing ideal conditions for the green roof in tropical weather.
5. Conclusion
In this research, a framework to evaluate the most used design strategies in extreme climates is created. By comparing each design strategy, the overall best performance was achieved when insulation was applied to the case study. The green roof was most effective for extremely cold climates and shading efficiency is evident in arid and tropical climates, however, a comprehensive research about how the air flows in different scenarios is required to further find optimum solutions for this strategy and its impact on ventilation. As proven by simulation, the low U-Values and phase change materials are essential to achieve the best performance in all scenarios. Other key qualitative findings of this research are:
There is no one size fit all for extreme climates, the most effective method is multicriteria strategies, due to the complexity of the building’s adaptability to local weather.
Simulation-based evaluation offers guidance for new or retrofitted projects in the extreme climates, but further research on real-scale monitoring is key for expanding the comprehension and accuracy of the model´s simulation.
Roof shape (flat or pitched) is a key factor for heat gain throughout the year. Flat roofs are ideal in cold climates, but pitched roof showed better performance in warmer climates.
Further research on dehumidification and humidification devices or materials (as hygroscopic) is also required to better understand the effectiveness of specific climates and building occupancy.
Disclosure statement
No potential conflict of interest was reported by the author(s).
Data availability statement
The data that support the findings of this study are available from the corresponding author upon reasonable request.
Additional information
Notes on contributors
Argenis Toyo Diaz
Argenis Toyo Diaz is an Architectural Innovator, Technologist, and Designer with six years of experience in diverse-scale projects. He is a recent graduate of Architectural Technology and Building Performance from Edinburgh Napier University and has a research focus on net-zero carbon buildings.
Seyed Masoud Sajjadian
Seyed Masoud Sajjadian is a Lecturer in Architectural Technology and Programme Leader for M.Sc. Architectural Technology and Building Performance in the School of Computing, Engineering and the Built Environment at Edinburgh Napier University, UK.
References
- Allbury, K., and J. Anderson. 2011. “Environmental Impact of Insulation.” BRE.
- Ascione, Fabrizio, Nicola Bianco, Filippo de Rossi, Gianluca Turni, and Giuseppe Peter Vanoli. 2013. “Green Roofs in European Climates. Are Effective Solutions for the Energy Savings in Air-Conditioning?” Applied Energy 104: 845–859. doi:10.1016/j.apenergy.2012.11.068.
- ASHRAE. 2021. “ASHRAE Fundamentals.”
- Baetens, Ruben, Bjørn Petter Jelle, and Arild Gustavsen. 2010. “Phase Change Materials for Building Applications: A State-of-the-Art Review.” Energy and Buildings 42 (9): 1361–1368. doi:10.1016/j.enbuild.2010.03.026.
- Beck, Hylke E., Niklaus E. Zimmermann, Tim R. McVicar, Noemi Vergopolan, Alexis Berg, and Eric F. Wood. 2020. “Present and Future Koppen-Geiger Climate Classification Maps at 1-Km Resolution (Vol 5, 180214, 2018).” Scientific Data 7 (1). doi:10.1038/s41597-020-00616-w.
- BEIS. 2021. “Operational Ratings for Commercial and Industrial Buildings Have Been Proposed by Government under the 2021 Consultation Introducing a Performance-Based Policy Framework in Large Commercial and Industrial Buildings.” BEIS. Bussiness, Energy & Industrial Strategy. https://www.gov.uk/government/consultations/introducing-a-performance-based-policy-framework-in-large-commercial-and-industrial-buildings.
- Brager, Gail, and Lindsay Baker. 2009. “Occupant Satisfaction in Mixed-Mode Buildings.” Building Research and Information : The International Journal of Research, Development and Demonstration 37 (4): 369–380. doi:10.1080/09613210902899785.
- Cabeza, L. F., A. Castell, and G. Pérez. 2014. “Pérez,13 - Life Cycle Assessment (LCA) of Phase Change Materials (PCMs) Used in Buildings.” In Eco-efficient Construction and Building Materials, edited by F. Pacheco-Torgal, L. F. Cabeza, J. Labrincha, and A. de Magalhães, 287–310. Woodhead Publishing.
- CIBSE. 2014. Buildings for Extreme Environments: Arid. London: CIBSE.
- CIBSE. 2017a. Buildings for Extreme Environments: Cold Climates. London: CIBSE.
- CIBSE. 2017b. Buildings for Extreme Environments: Tropical. London: CIBSE.
- Domingos, L., and V. Rato. 2019. “Multi-Criteria Material Selection for Buildings in Challenging Environments.” IOP Conference Series. Earth and Environmental Science 297 (1): 012038. doi:10.1088/1755-1315/297/1/012038.
- Elouadjeri, Sahar Magri, Aicha Boussoualim, and Hassan Ait Haddou. 2021. “Evaluating the Effect of External Horizontal Fixed Shading Devices Geometry on Internal Air Temperature, Daylighting and Energy Demand in Hot Dry Climate. Case Study of Ghardaïa, Algeria.” Buildings 11 (8). doi:10.3390/buildings11080348.
- EnergyPlus, and World Meteorological Organization. 2022. “Weather Data.”
- Fang, Xia, Jon Winkler, and Dane Christensen. 2010. “Using EnergyPlus to Perform Dehumidification Analysis on Building America Homes.”
- Feldman, D., D. Banu, D. Hawes, and E. Ghanbari. 1991. “Obtaining an Energy Storing Building Material by Direct Incorporation of an Organic Phase Change Material in Gypsum Wallboard.” Solar Energy Materials 22 (2-3): 231–242. doi:10.1016/0165-1633(91)90021-C.
- Gething, Bill, and Technology Strategy Board. 2010. “Design for Future Climate.” www.ukcip.org.uk.
- Grullón – Penkova, Iana F, Jess K Zimmerman, and Grizelle González. 2020. “Green Roofs in the Tropics: Design Considerations and Vegetation Dynamics.” Heliyon 6 (8): e04712–e04712. doi:10.1016/j.heliyon.2020.e04712.
- IEA. 2013. “Transition to Sustainable Buildings: Strategies and Opportunities to 2050.” https://www.iea.org/media/training/presentations/etw2014/publications/ Sustainable_Buildings_2013.pdf.
- International Energy Agency. 2018. “The Future of Cooling: Opportunities for Energy. Efficient Air Conditioning.” IEA.
- Jamei, Elmira, Hing Wah Chau, Mehdi Seyedmahmoudian, and Alex Stojcevski. 2021. “Review on the Cooling Potential of Green Roofs in Different Climates.” The Science of the Total Environment 791: 148407–148407. doi:10.1016/j.scitotenv.2021.148407.
- Kim, Taehoon, Yong-woo Kim, and Hunhee Cho. 2020. “Dynamic Production Scheduling Model Under Due Date Uncertainty in Precast Concrete Construction.” Journal of Cleaner Production 257: 120527. doi:10.1016/j.jclepro.2020.120527.
- Kon, O., and I. Caner. 2020. “Minimum Insulation Thickness to Prevent the Condensation of Building Outdoor Walls in a Different Direction.” In 12th International Exergy, Energy and Environment Symposium. https://www.researchgate.net/publication/347985035.
- Lavafpour, Y., and S. Sharples. 2015. “Summer Thermal Comfort and Self-Shading Geometries in Passivhaus Dwellings: A Pilot Study Using Future UK Climates.” Buildings (Basel) 5 (3): 964–984. https://doi.org/10.3390/buildings5030964.
- Livesey, Katie, Ed Suttie, and Katherine Scovell. 2013. “Advanced Thermal Insulation Technologies in the Built Environment.” www.architecture.com.
- Martin-Escudero, Koldobika, Garazi Atxalandabaso, Aitor Erkoreka, Amaia Uriarte, and Matteo Porta. 2022. “Comparison Between Energy Simulation and Monitoring Data in an Office Building.” Energies 15 (1). doi:10.3390/en15010239.
- Murray Milne, R. Liggett, and Rashed Alshaali. 2016. “Climate Consultant 3.0: A Tool for Visualizing Building Energy Implications of Climates.”
- Nazi, Wan Iman Wan Mohd, Yaodong Wang, Haisheng Chen, Xinjing Zhang, and Anthony Paul Roskilly. 2017. “Passive Cooling Using Phase Change Material and Insulation for High-Rise Office Building in Tropical Climate.” Energy Procedia 142: 2295–2302. doi:10.1016/j.egypro.2017.12.632.
- Nematchoua, M. K., J. C. V. Noelson, I. Saadi, H. Kenfack, A.-Z. F. R. Andrianaharinjaka, D. F. Ngoumdoum, J. B. Sela, and S. Reiter. 2020. “Application of Phase Change Materials, Thermal Insulation, and External Shading for Thermal Comfort Improvement and Cooling Energy Demand Reduction in an Office Building Under Different Coastal Tropical Climates.” Solar Energy 207: 458–470. https://doi.org/10.1016/j.solener.2020.06.110.
- Osanyintola, Olalekan F, and Carey J Simonson. 2006. “Moisture Buffering Capacity of Hygroscopic Building Materials: Experimental Facilities and Energy Impact.” Energy and Buildings 38 (10): 1270–1282. doi:10.1016/j.enbuild.2006.03.026.
- Sajjadian, Seyed Masoud, John Lewis, and Stephen Sharples. 2015. “The Potential of Phase Change Materials to Reduce Domestic Cooling Energy Loads for Current and Future UK Climates.” Energy and Buildings 93: 83–89. doi:10.1016/j.enbuild.2015.02.029.
- Schrot, O. G., J. Traxler, A. Weifner, and M. M. Kretzer. 2021. “Potential of “Future Workshop” Method for Educating Adolescents About Climate Change Mitigation and Adaptation: A Case from Freistadt, Upper Austria.” Applied Environmental Education & Communication 20 (3). https://doi.org/10.1080/1533015X.2020.1816515
- Touma, Albert al, and Djamel Ouahrani. 2017. “Shading and Day-Lighting Controls Energy Savings in Offices with Fully-Glazed Façades in Hot Climates.” Energy and Buildings 151: 263–274. doi:10.1016/j.enbuild.2017.06.058.
- Tu, Rang, Jiaqi Li, and Yunho Hwang. 2020. “Performance Analysis of Desiccant Wheels Assisted Fresh Air Humidifiers in Winter Using Natural Gas Boilers: Applied in Cold and Dry Climate Regions.” International Journal of Refrigeration 119: 24–36. doi:10.1016/j.ijrefrig.2020.08.003.
- Velasco, E., and M. Roth. 2010. “Cities as Net Sources of CO2: Review of Atmospheric CO2 Exchange in Urban Environments Measured by Eddy Covariance Technique.” Geography Compass 4 (9): 1238–1259. doi:10.1111/j.1749-8198.2010.00384.x.
- Veldscholte, Lars B, Rens J Horst, and Sissi de Beer. 2021. “Design, Construction, and Testing of an Accurate Low-Cost Humidistat for Laboratory-Scale Applications.” The European Physical Journal E, Soft Matter and Biological Physics 44 (4): 48–48. doi:10.1140/epje/s10189-021-00062-5.
- Wanas, A., S. Shafik, A. Farghal, and R. El-Dabaa. 2015. “Use of Kinetic Facades to Enhance Daylight Performance in Office Buildings with Emphasis on Egypt Climates.”
- WGBC. 2019. “Bringing Embodied Carbon Upfront.” www.worldgbc.org/embodied-carbon.
- WGBC. 2021. “The Net Zero Carbon Buildings Commitment.” www.Worldgbc.Org/Thecommitment.
- Wong, Nyuk Hien, Su Fen Tay, Raymond Wong, Chui Leng Ong, and Angelia Sia. 2003. “Life cycle cost analysis of rooftop gardens in Singapore.” Building and Environment 38 (3): 499–509. http://doi.org/10.1016/S0360-1323(02)00131-2.